District in Zwolle
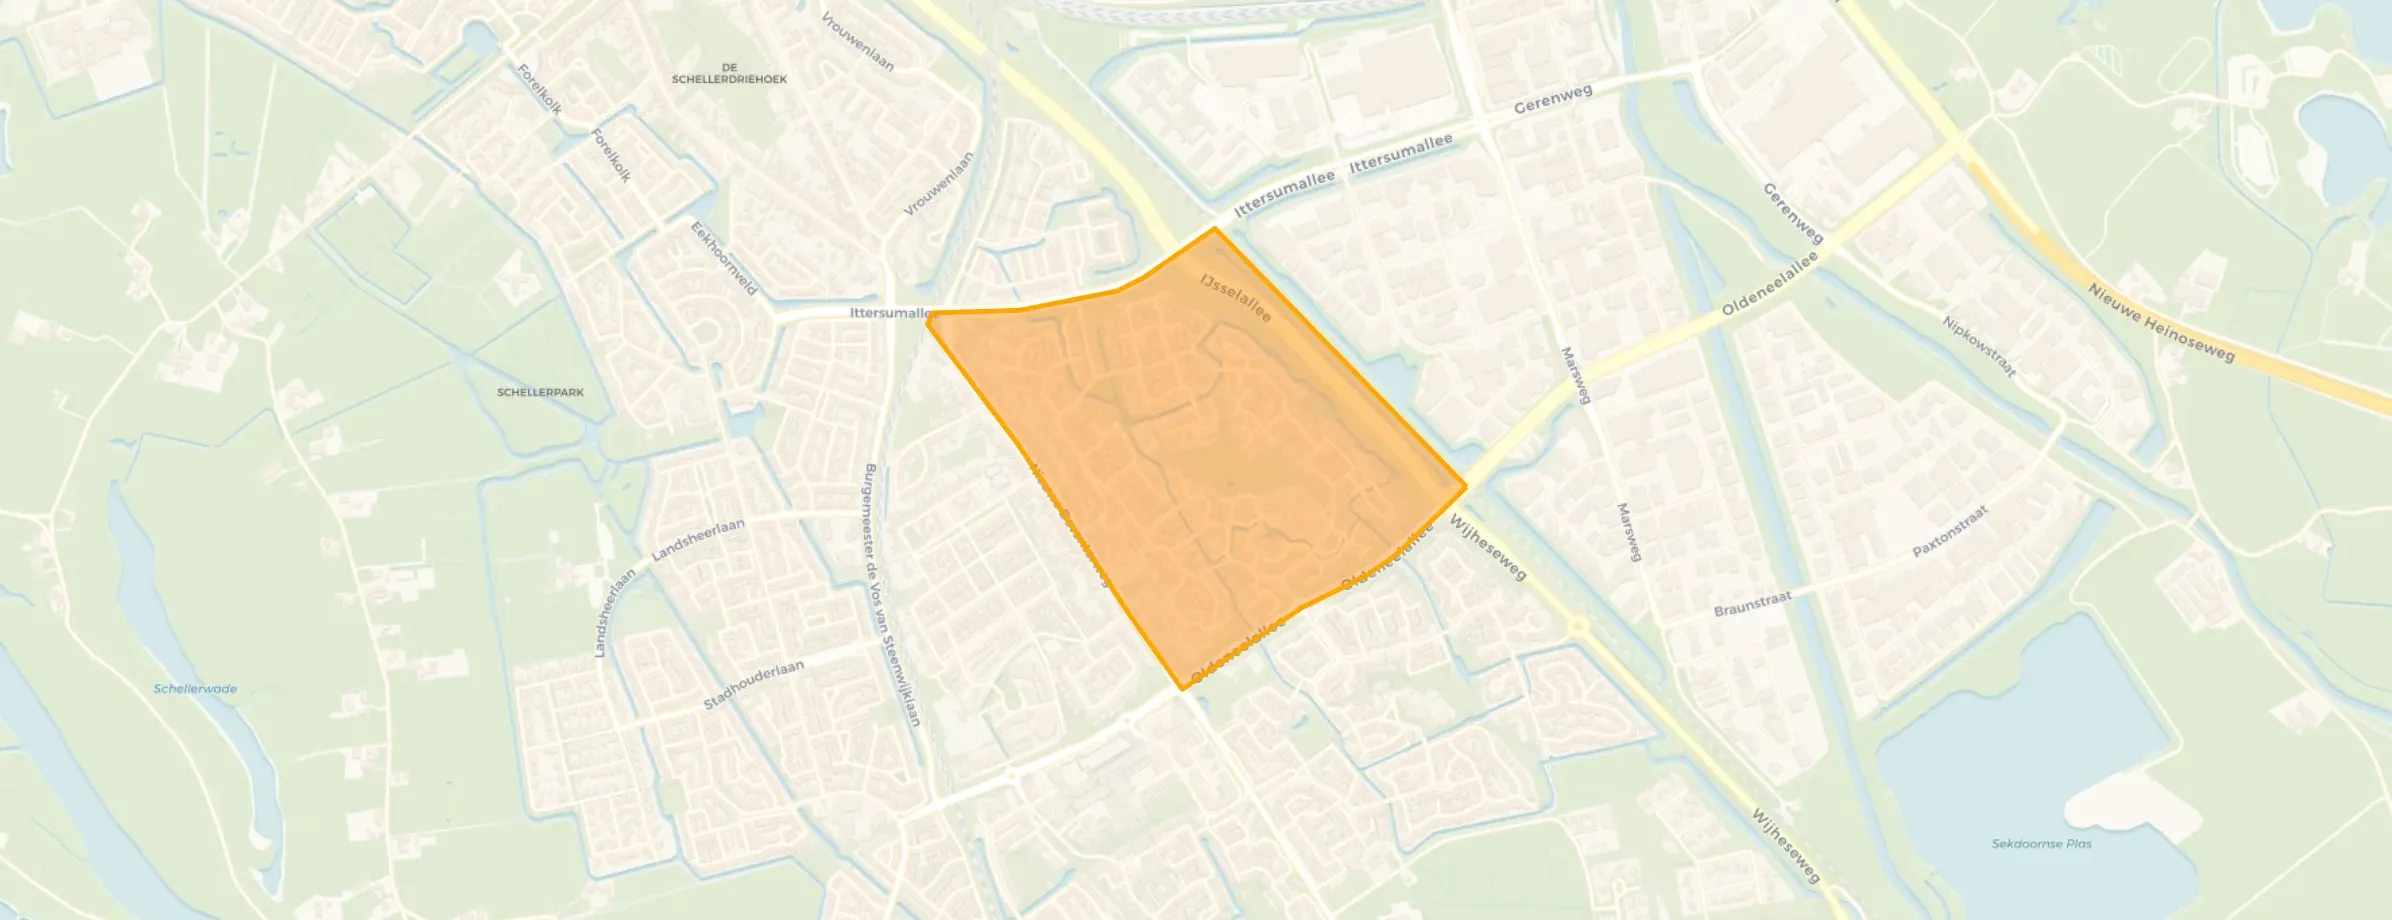
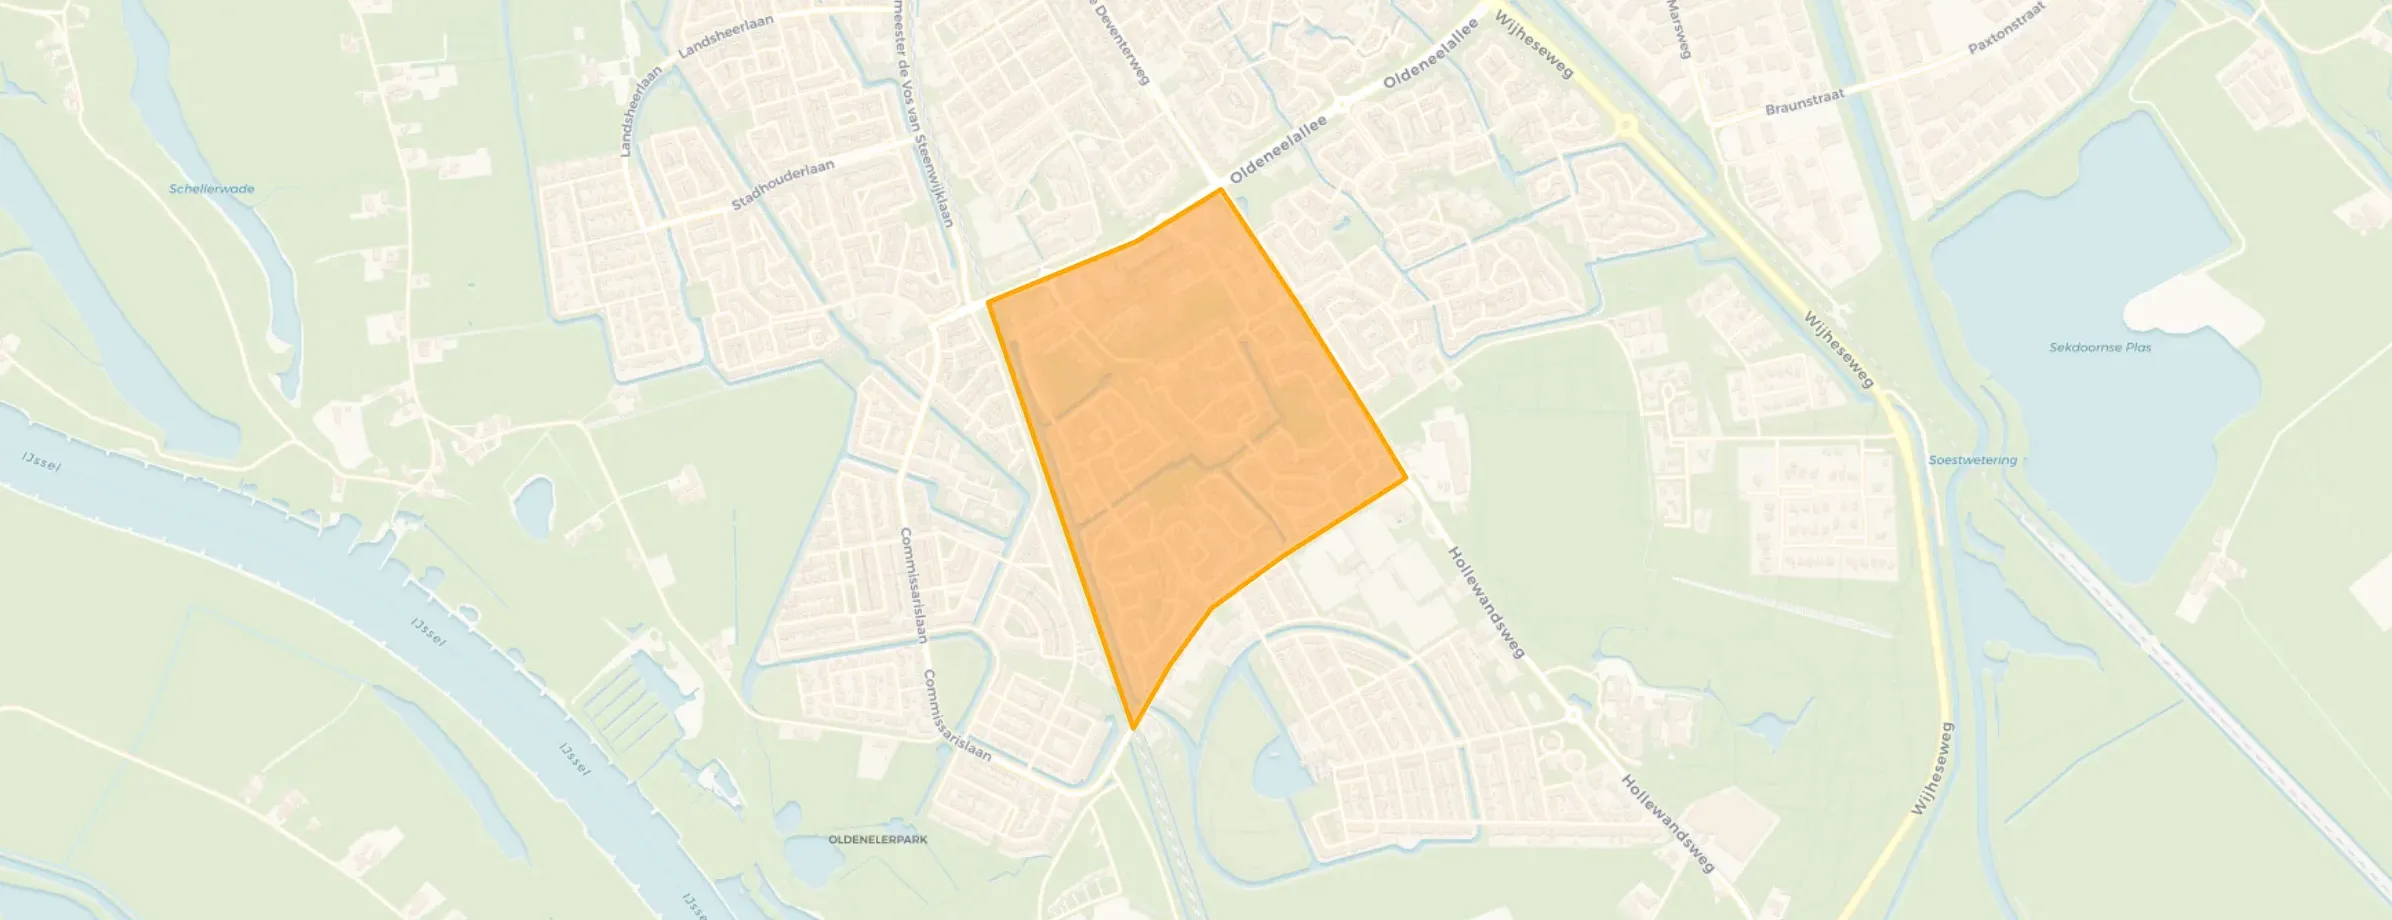
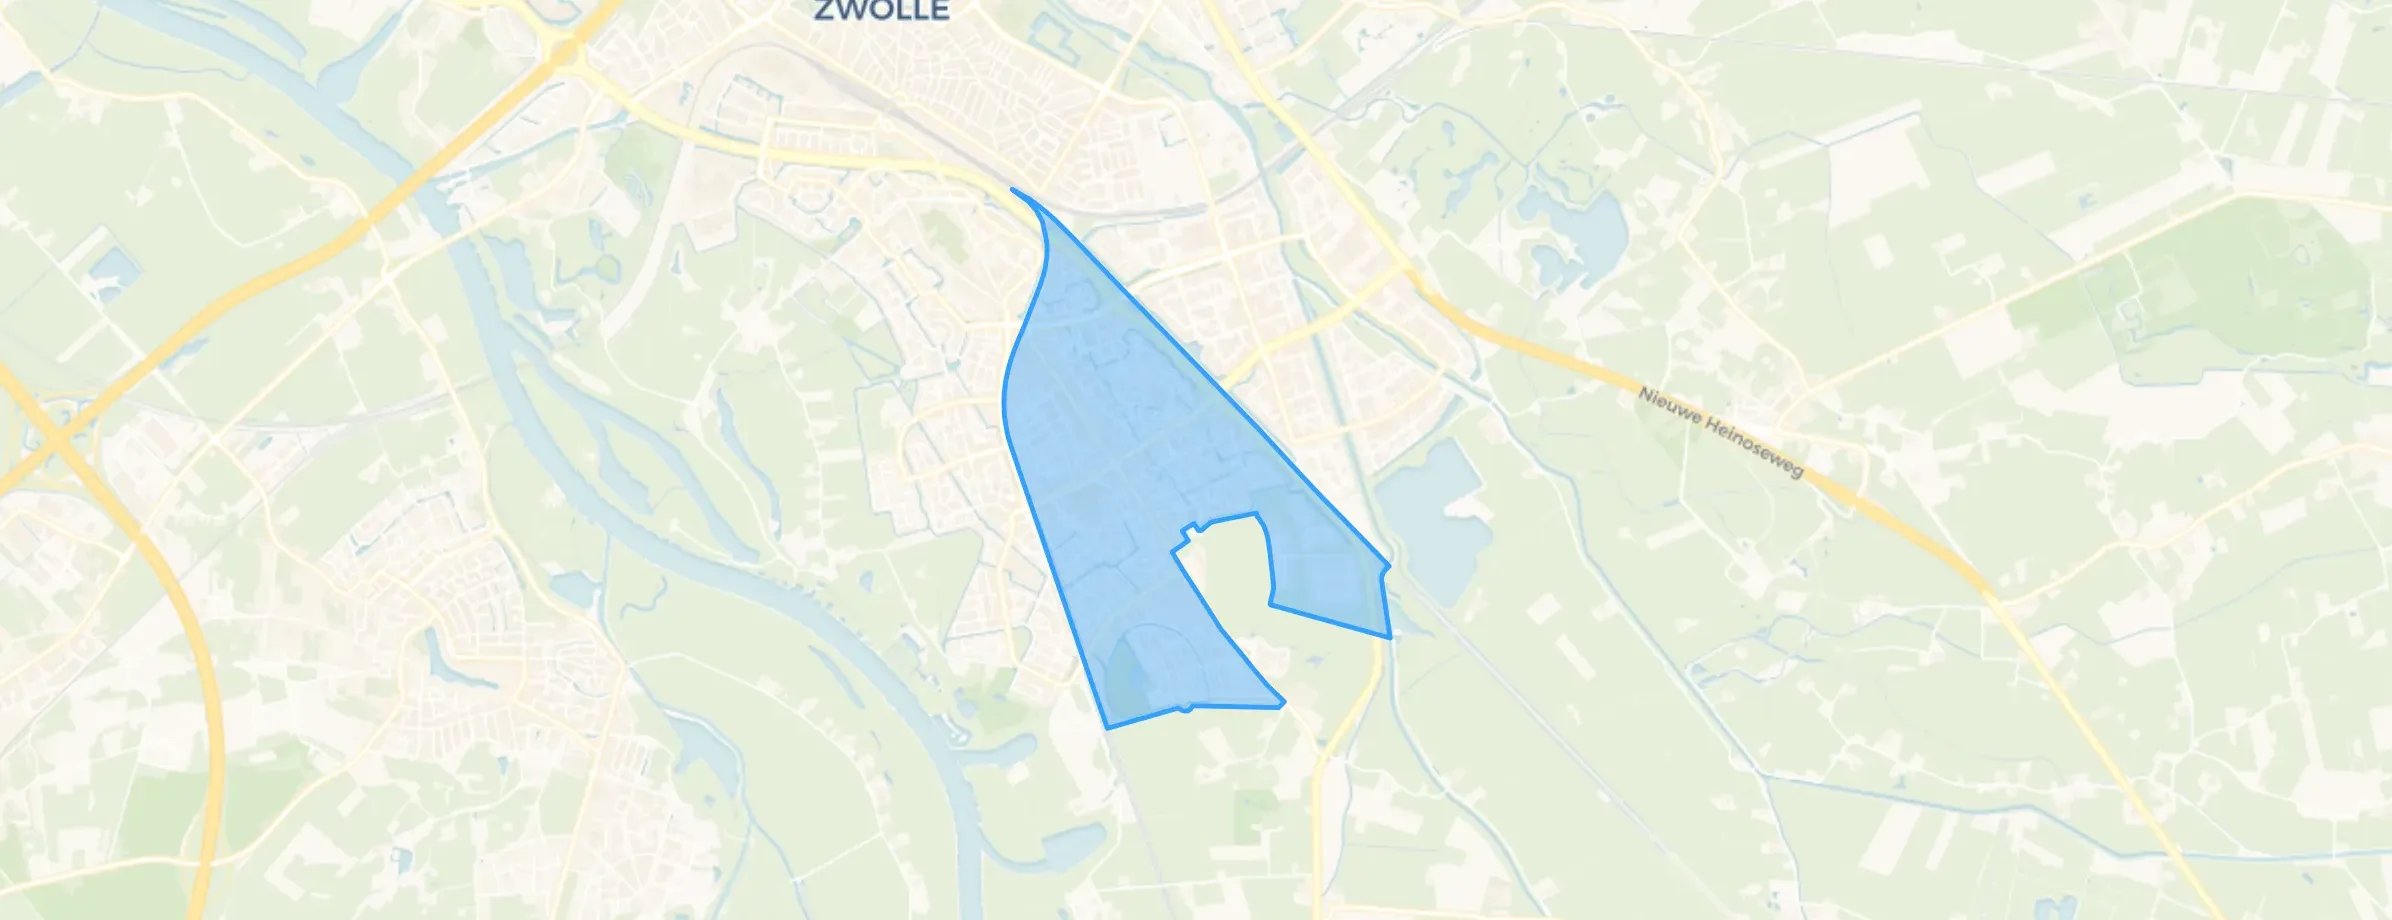
Ittersum is located in the province of Overijssel, in the municipality of Zwolle The district has a total area of 315 hectares, of which 302 hectares are land and 12 hectares are water. The district is coded as WK019351. The postcode area is 8013PE-8015EE.
Ittersum has 14.710 residents. Of these, 49,4% are men and 50,6% are women. Most residents are 45 to 65 years (26,7%). The other age groups are 25,2% for '25 to 45 years', 20,1% for '65 years or older', 16,9% for '0 to 15 years' and 11,3% for '15 to 25 years'. Of the residents, 46,9% is unmarried, 41,1% is married, 8,1% is divorced and 4,0% is widowed. 12.460 residents originate from the Netherlands, 535 come from Europe and 1.710 come from countries outside Europe.
There are 6.470 households in Ittersum. 33,5% of these are single-person households, 30,5% households without children and 36,0% households with children. The average household size is 2,2 persons. The national average is 2,1 persons.
In Ittersum there are 11.800 income recipients. The average income per income recipient is €40.700, which is €1.500 (4%) lower than the national average of €42.200. Per resident, the average income is €33.300, which is €1.600 (5%) lower than the national average of €34.900. Most residents of Ittersum are educated to an intermediate level. 41,2% have an intermediate education (HAVO, VWO or MBO 2-4), 38,2% have a university or higher professional education (HBO/WO) and 20,6% have a lower education (VMBO or MBO 1).
Of the 14.710 residents, around 74% are in paid employment, which amounts to 10.885 people. This is 2% higher than the national average of 72%. The majority of workers are in salaried employment (89%), while 11% are self-employed. In Ittersum, 26% of residents receive a benefit. The largest group is those receiving a state pension (AOW). 2.630 people receive this benefit.
In Ittersum there are 6.383 homes with an average assessed value (WOZ) of €375.000. Of these, around 98% are occupied and 2% unoccupied. Most homes are owner-occupied. This amounts to 38% rental homes and 62% owner-occupied homes. Of the homes, 63% privately owned, 29% owned by housing associations and 8% owned by other landlords. The most common construction periods in Ittersum are 1980-1990 (60%) and 1990-2000 (18%).
There are currently no homes for sale in Ittersum. The most recently listed home is Ulgerkamp 19 by Karssen Makelaars. No homes were sold in Ittersum over the past year.
There are currently no homes for rent in Ittersum. The most recent home is Staatsmanlaan 60C, offered by www.dewoningzoeker.nl. No homes were let in Ittersum over the past year.
No recent rental data available for Ittersum.
In Ittersum there are 4.162 addresses with a registered energy label. The most common labels are A (33%), B (31%) and C (26%). On average, an address in Ittersum uses 2.340 kWh of electricity per year. This is 8% below the national average of 2.550 kWh. With an annual consumption of 740 m³ per address, natural gas consumption is 8% below the national average of 800 m³.
Supermarket and other shops within walking distance, possibly reachable
Auto-translated to English by AIEvery year on Neighbour's Day maybe explain better how to join the WhatsApp group
Auto-translated to English by AIQuiet neighbourhood, few children. Miss the social contact with neighbours. Everyone is to themselves.
Auto-translated to English by AIIt's a reasonably safe neighbourhood. No bad experiences otherwise. Children aren't too troublesome either. Sometimes a bit loud, but what can you do about it. Kids will be kids. The house is sometimes hard for visitors to find because it's a bit of a maze, but with Google Maps it should be fine. The school my children attended was very bad. Nothing was done about bullying and the education was (sounds strange) too little. As a result, there was hardly any preparation for secondary school. Secondary school was therefore a huge step. They had never had homework before. So the education could be better.
Auto-translated to English by AIMy experience is that my neighbourhood is generally very safe and good. The people are friendly but not really connected to each other. One street is a bit more cohesive than another, but most people keep to themselves.
Auto-translated to English by AIIn Ittersumerbroek you can live pleasantly. The neighbourhood is spacious and lies between the IJssel and the Zandhove forest, greenery is very close by.
Auto-translated to English by AIThe housing stock is mainly post-war — 77% was built between 1945 and 1990. In addition, the most common type is terraced houses (47%).
Over the past year a home for sale in Ittersum was listed for an average of €476,736 (€3,984 per m²). Last quarter prices rose by 22%.
A rental home in Ittersum cost an average of €1,171 per month (€14 per m²).
Residents give Ittersum a 8.0 out of 10 based on 6 reviews. Especially safety (8.8) scores well; community (7.3) receives the lowest rating.
Wijk Ittersum has 14,710 residents. Many families: 36% of the households have children.
The housing supply in Ittersum is remarkably efficient: 70% has an A, A+ or B label. The average natural gas consumption per household is 740 m³ per year.
From Ittersum you can on average reach a supermarket at 0.9 km, a GP at 0.8 km, a railway station at 3.9 km, a primary school at 0.6 km (as the crow flies, source: CBS).
Right now you will find 33 homes for sale in Ittersum.