District in Deventer
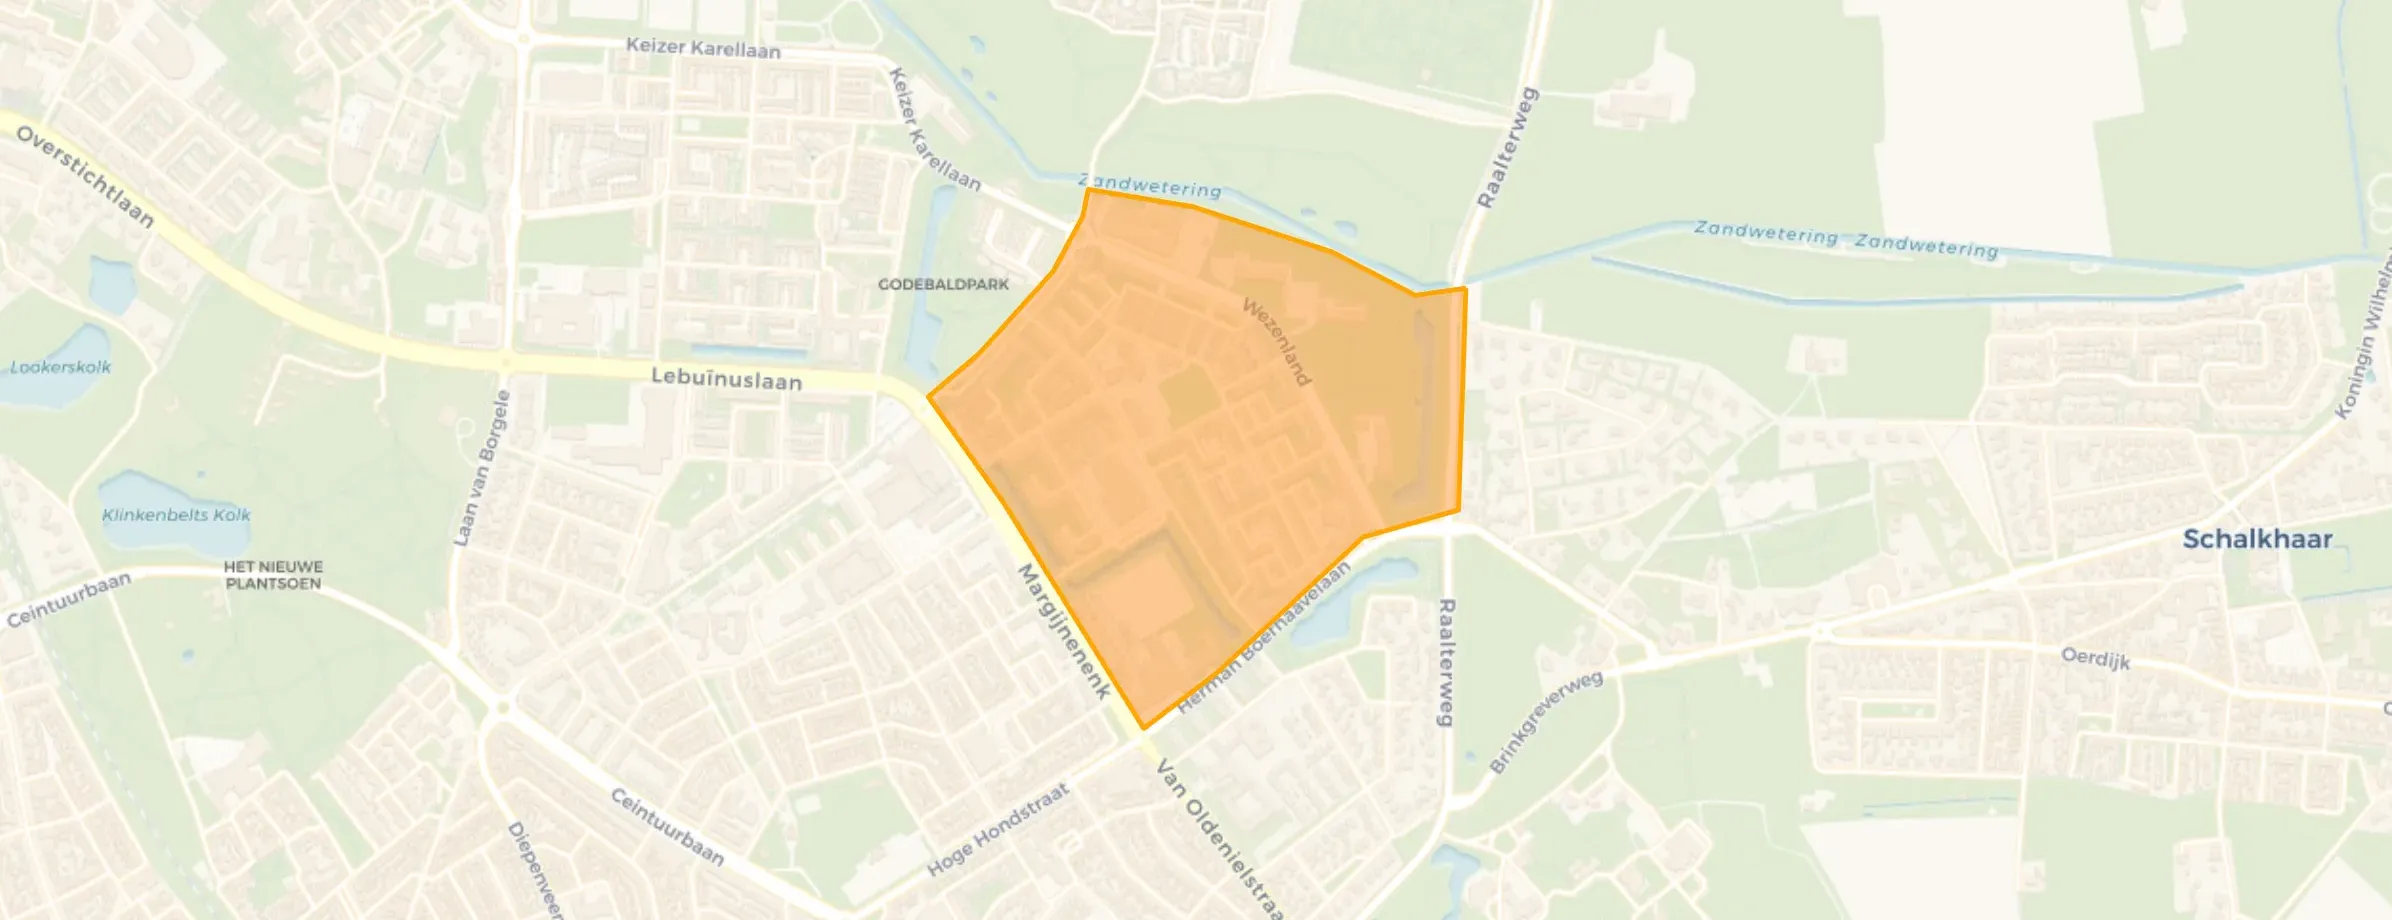
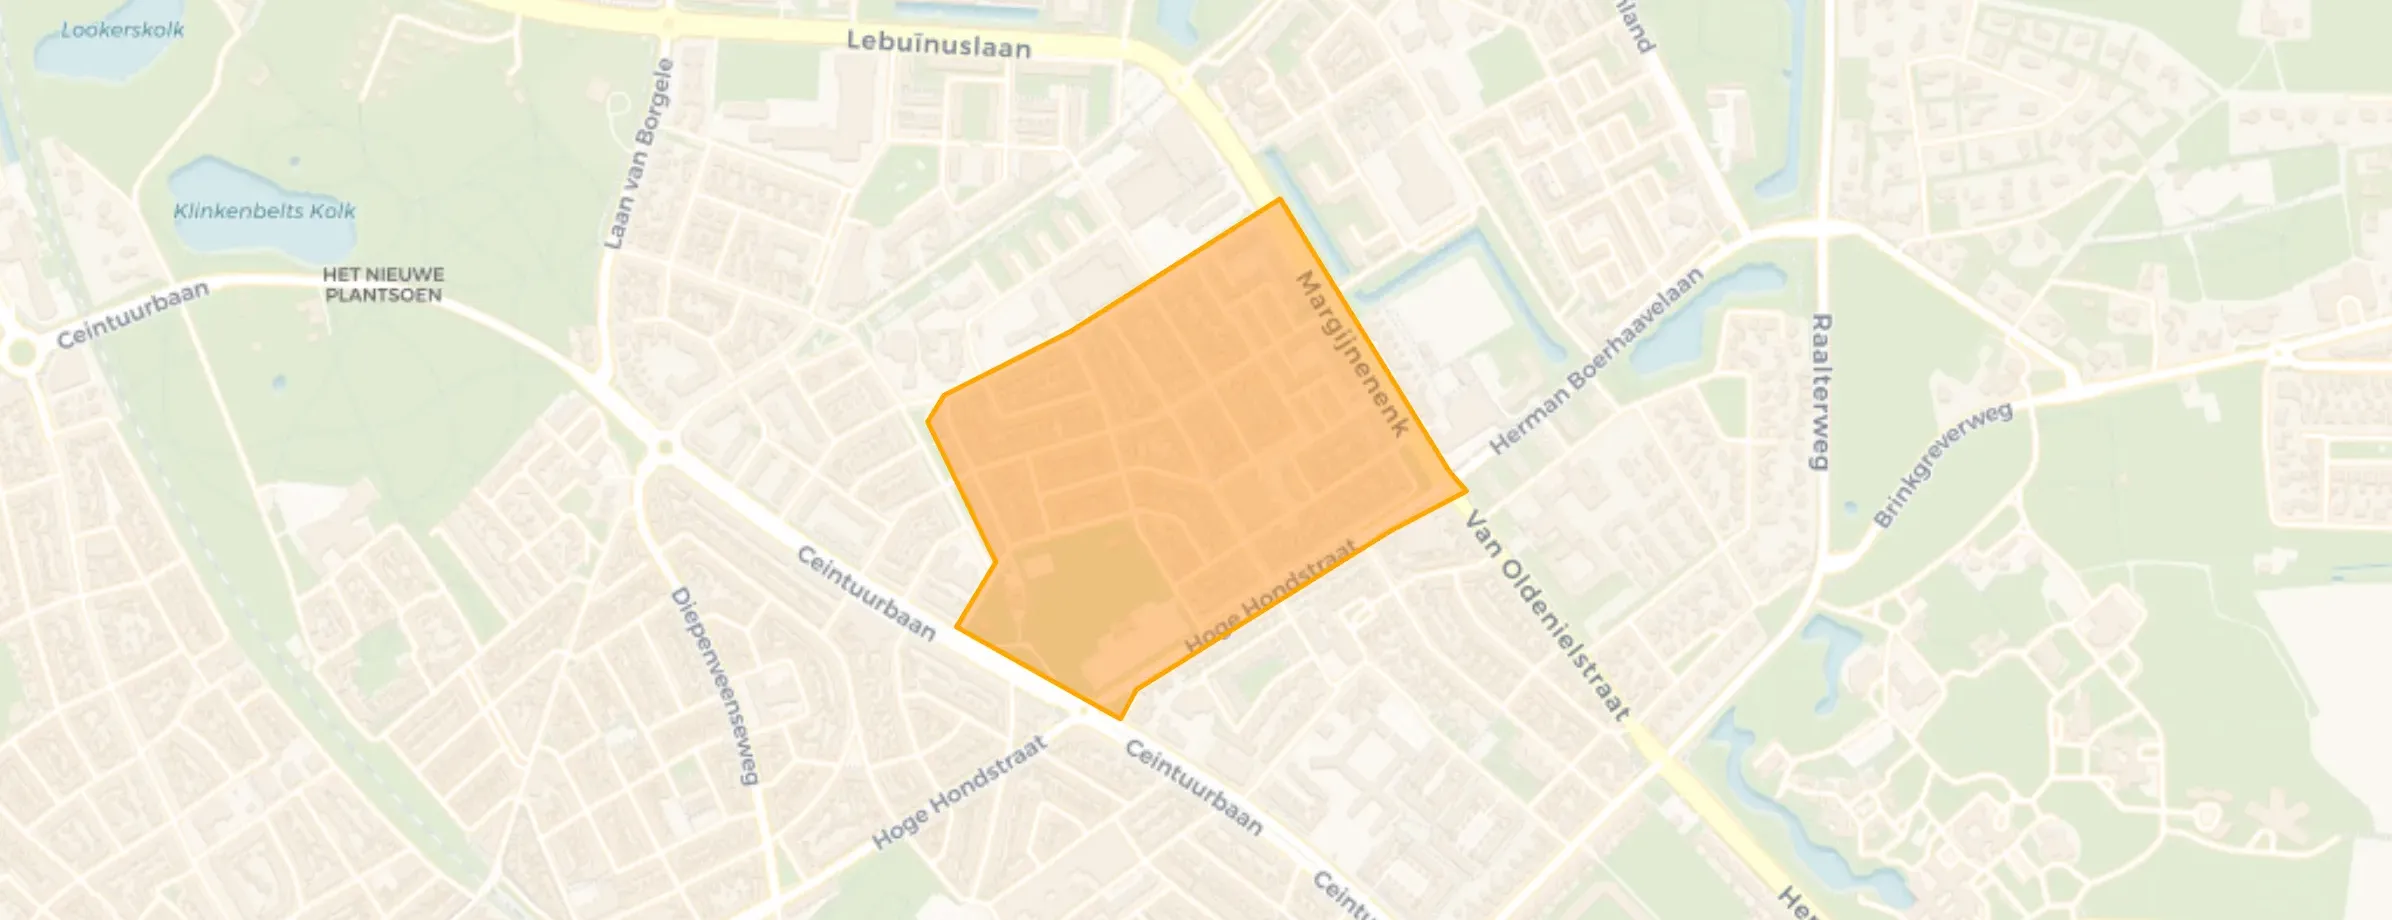
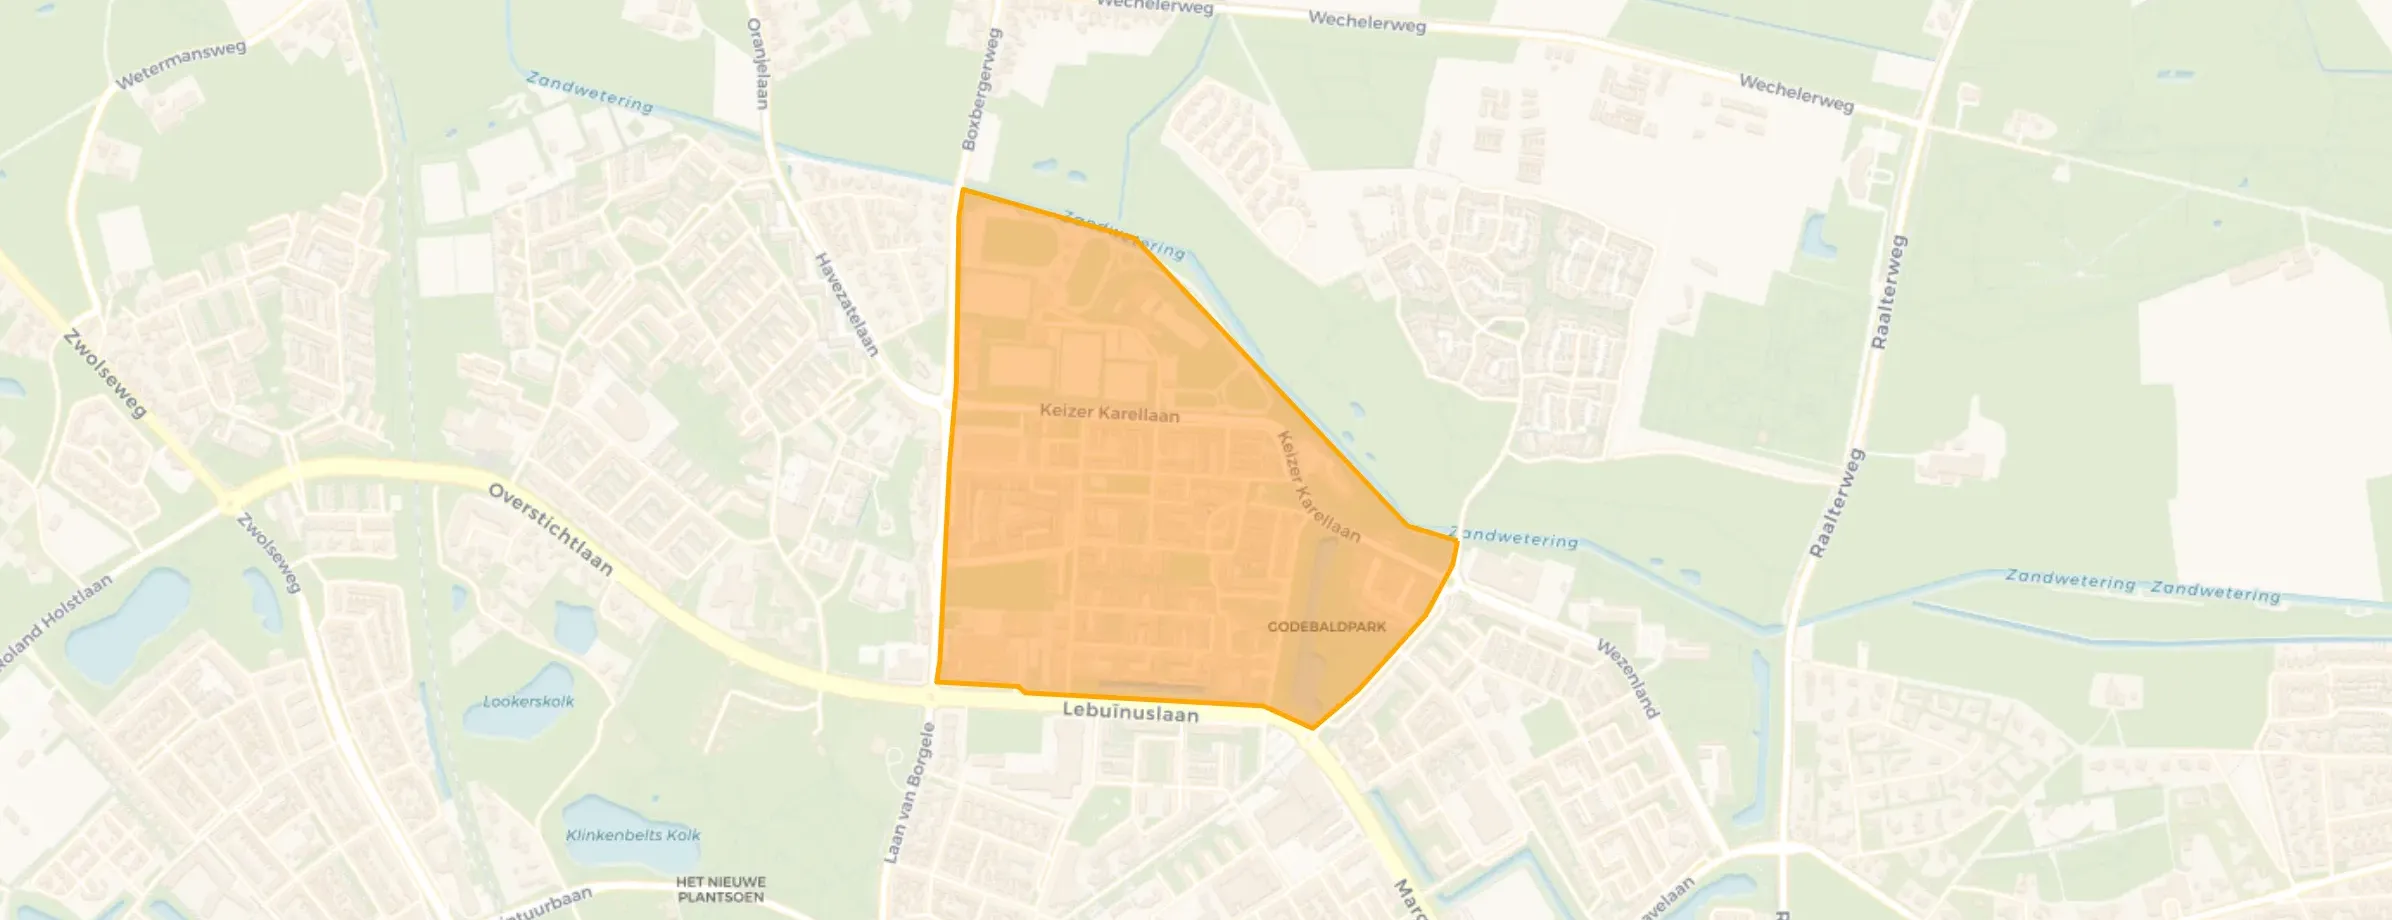
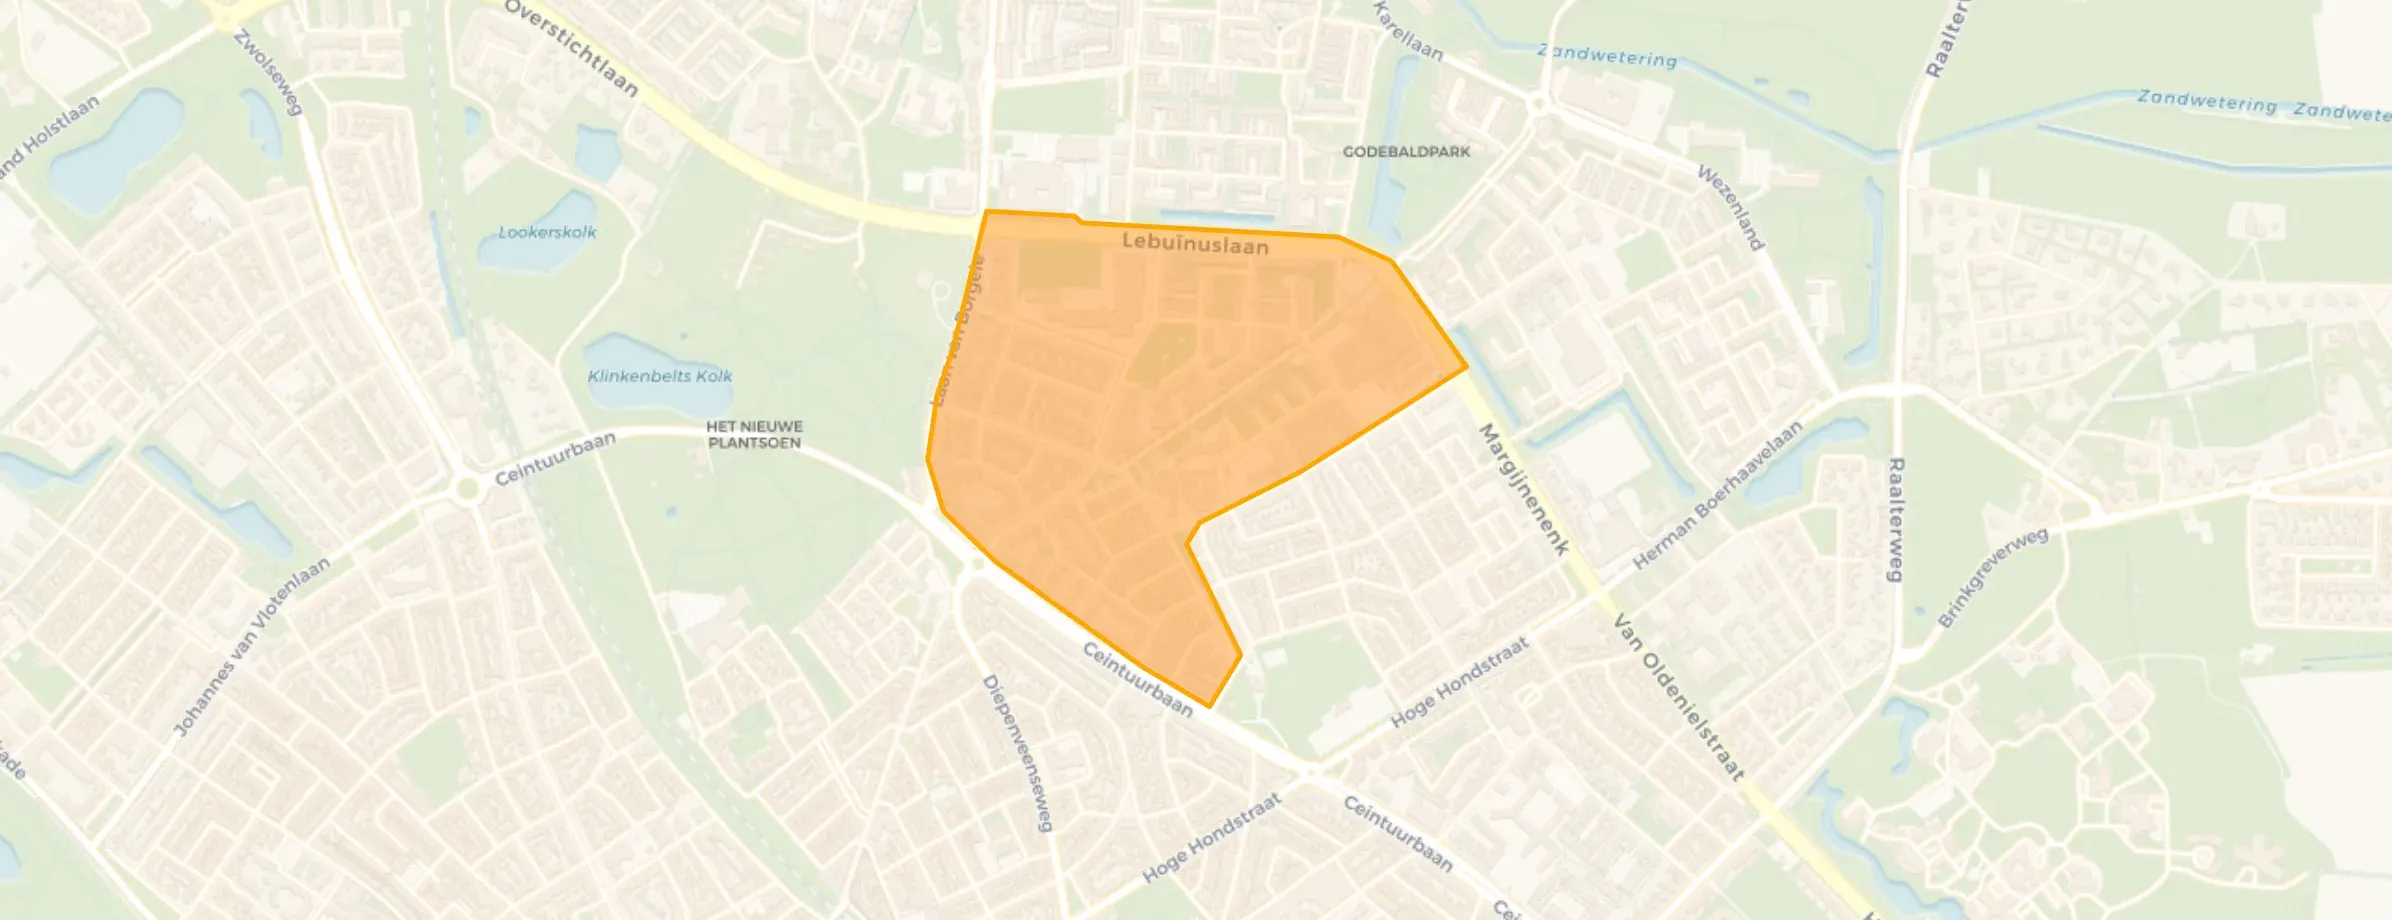
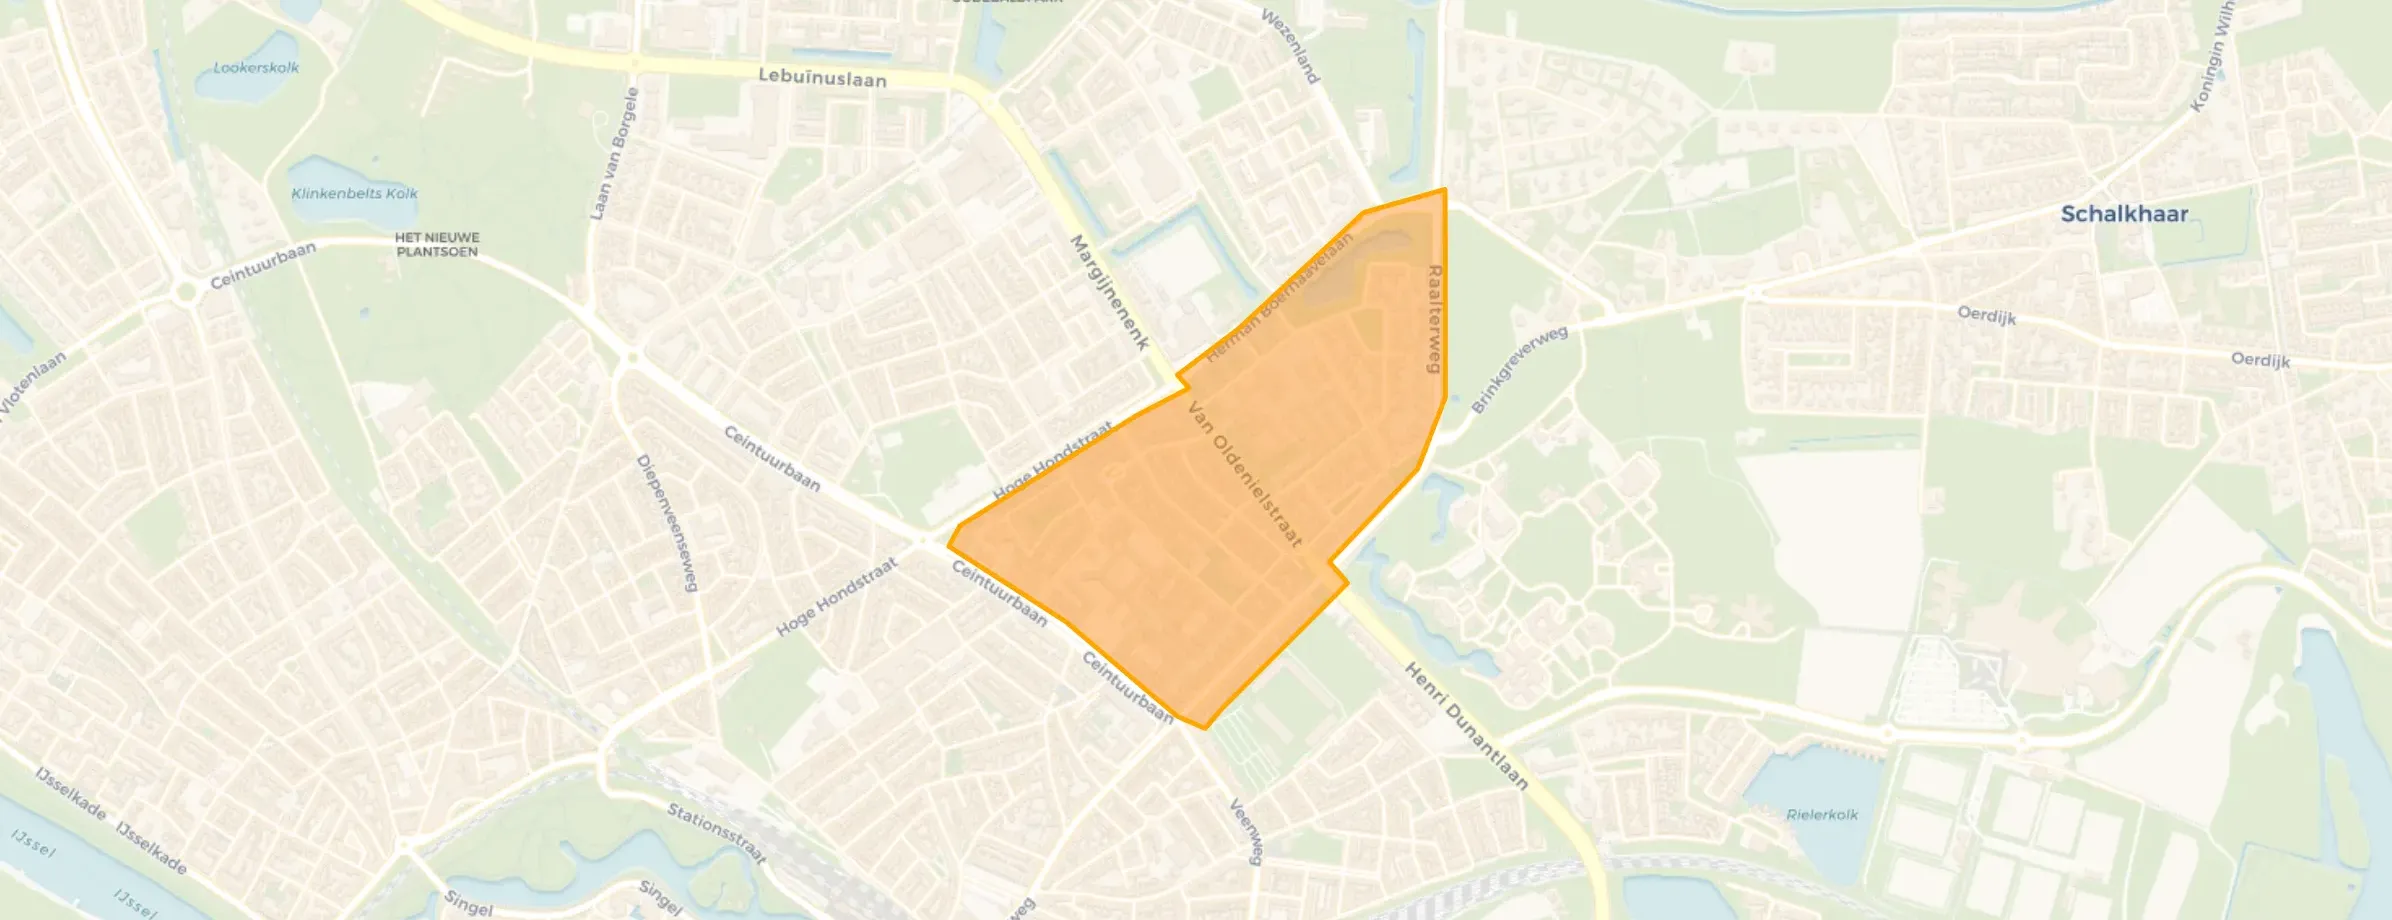
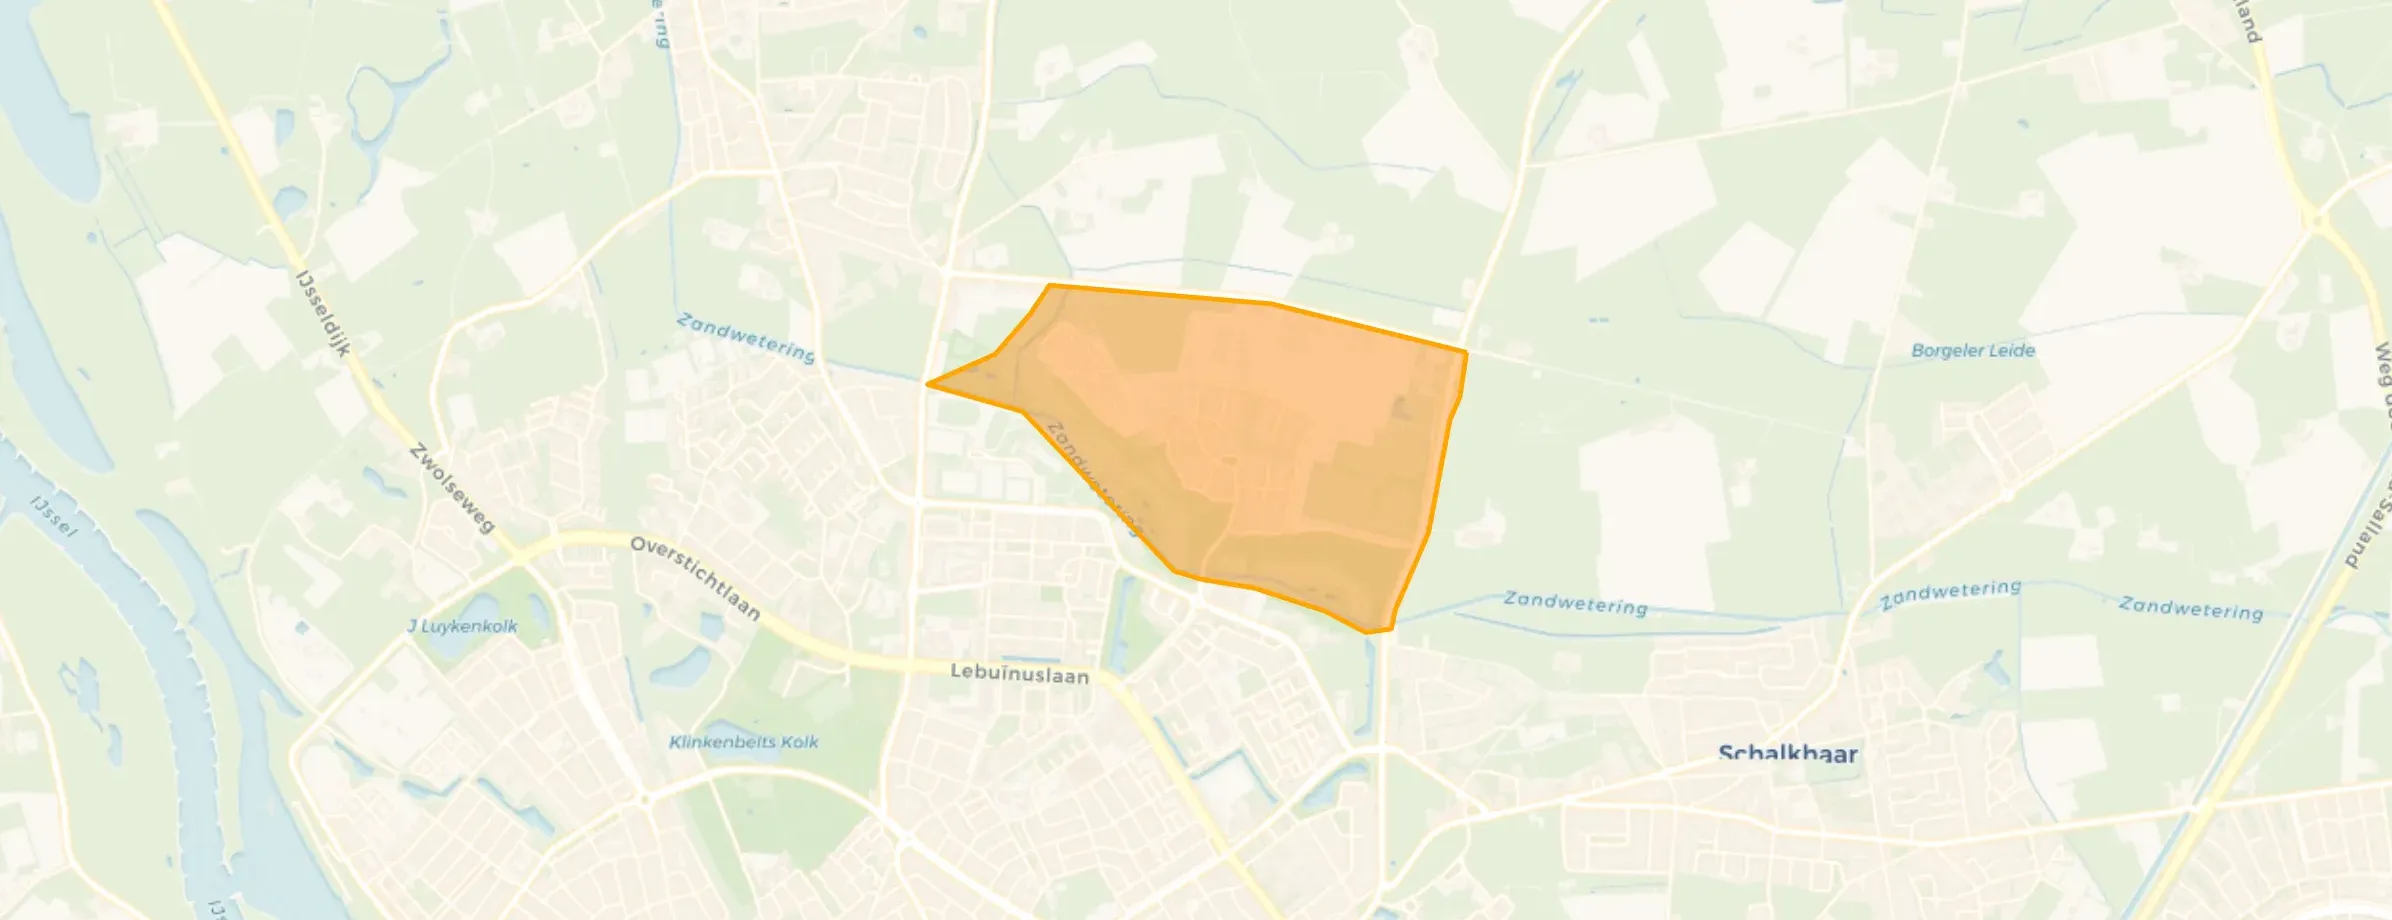
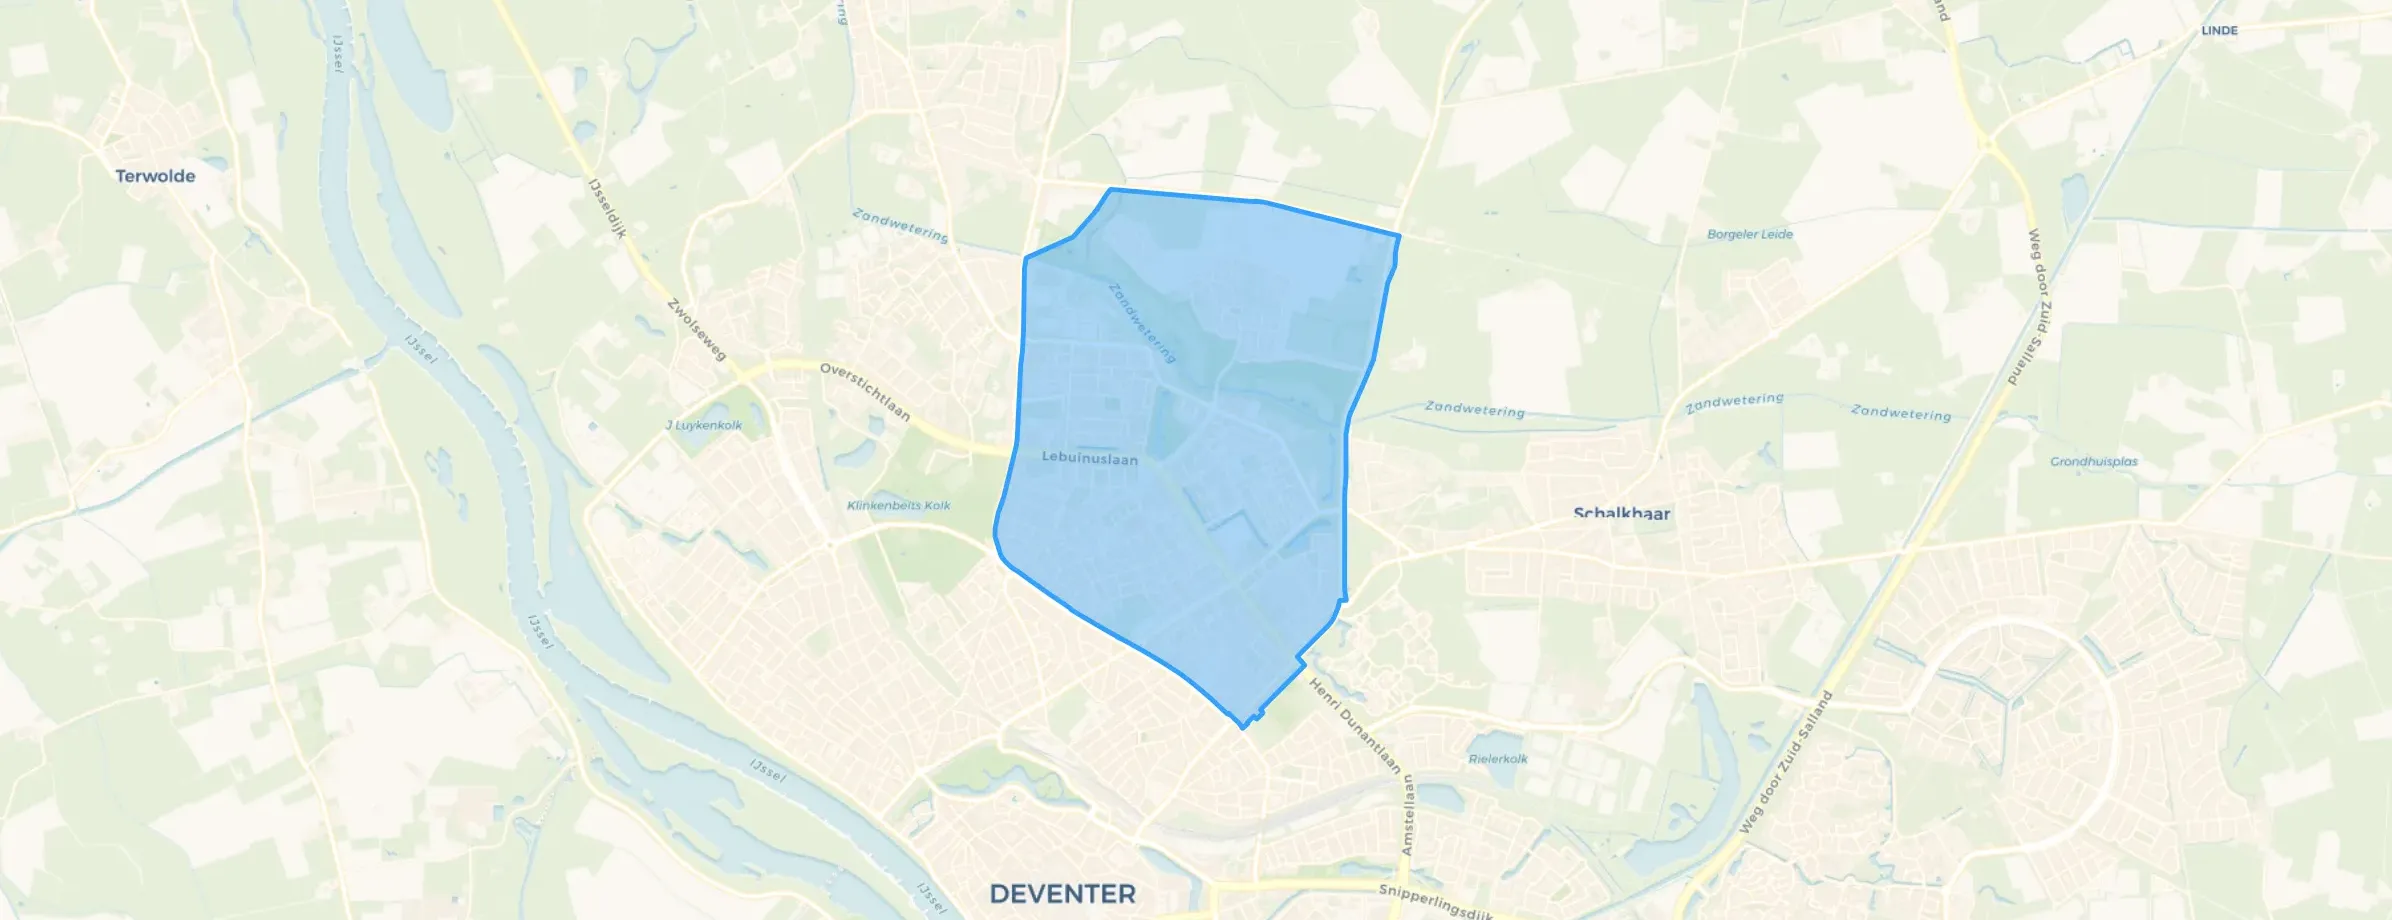
Keizerslanden is located in the province of Overijssel, in the municipality of Deventer The district has a total area of 295 hectares, of which 293 hectares are land and 2 hectares are water. The district is coded as WK015006. The postcode area is 7415AA-7431PA.
Keizerslanden has 12.900 residents. Of these, 48,1% are men and 51,9% are women. Most residents are 25 to 45 years (31,5%). The other age groups are 21,7% for '45 to 65 years', 18,9% for '65 years or older', 17,9% for '0 to 15 years' and 10,0% for '15 to 25 years'. Of the residents, 54,8% is unmarried, 29,9% is married, 9,6% is divorced and 5,7% is widowed. 8.525 residents originate from the Netherlands, 890 come from Europe and 3.485 come from countries outside Europe.
There are 6.170 households in Keizerslanden. 44,6% of these are single-person households, 23,1% households without children and 32,3% households with children. The average household size is 2,0 persons. The national average is 2,1 persons.
In Keizerslanden there are 9.500 income recipients. The average income per income recipient is €36.800, which is €5.400 (13%) lower than the national average of €42.200. Per resident, the average income is €29.300, which is €5.600 (16%) lower than the national average of €34.900. Most residents of Keizerslanden are educated to an intermediate level. 39,3% have an intermediate education (HAVO, VWO or MBO 2-4), 31,0% have a university or higher professional education (HBO/WO) and 29,7% have a lower education (VMBO or MBO 1).
Of the 12.900 residents, around 69% are in paid employment, which amounts to 8.901 people. This is 3% lower than the national average of 72%. The majority of workers are in salaried employment (89%), while 11% are self-employed. In Keizerslanden, 30% of residents receive a benefit. The largest group is those receiving a state pension (AOW). 2.270 people receive this benefit.
In Keizerslanden there are 6.379 homes with an average assessed value (WOZ) of €297.000. Of these, around 96% are occupied and 4% unoccupied. Most homes are rental properties. This amounts to 61% rental homes and 39% owner-occupied homes. Of the homes, 39% privately owned, 51% owned by housing associations and 10% owned by other landlords. The most common construction periods in Keizerslanden are 1950-1970 (52%) and 2020 and later (14%).
There are currently no homes for sale in Keizerslanden. The most recently listed home is Godebaldstraat 40 by Mercurius Makelaars. No homes were sold in Keizerslanden over the past year.
There are currently no homes for rent in Keizerslanden. The most recent home is Wezenland 290, offered by www.woonkeus-stedendriehoek.nl. No homes were let in Keizerslanden over the past year.
No recent rental data available for Keizerslanden.
In Keizerslanden there are 5.405 addresses with a registered energy label. The most common labels are A (32%), C (16%) and A+++ (15%). On average, an address in Keizerslanden uses 2.210 kWh of electricity per year. This is 13% below the national average of 2.550 kWh. With an annual consumption of 540 m³ per address, natural gas consumption is 33% below the national average of 800 m³.
Fijne woonomgeving, met winkels en groen in de buurt. Ook snel bij centrum Deventer en station.
Auto-translated to English by AIIt is visibly unsafe in the neighbourhood. Drugs are used, there are many loitering youths and graffiti. The public space is cheaply furnished. Houses are from the 1960s and in a state of disrepair. There is a lot of litter on the streets and sometimes problems with mice and other vermin. There is no neighbourhood supermarket, unless you count the petrol station. The square with amenities looks neglected.
Auto-translated to English by AICould be better. Too much nuisance, loud music, noise. Driving too fast, children and adults. Neighbour arguments.
Auto-translated to English by AISocial and at the same time independent per household.
Auto-translated to English by AINormal quiet place and nice surroundings, many children often play football, it's really fun, very social
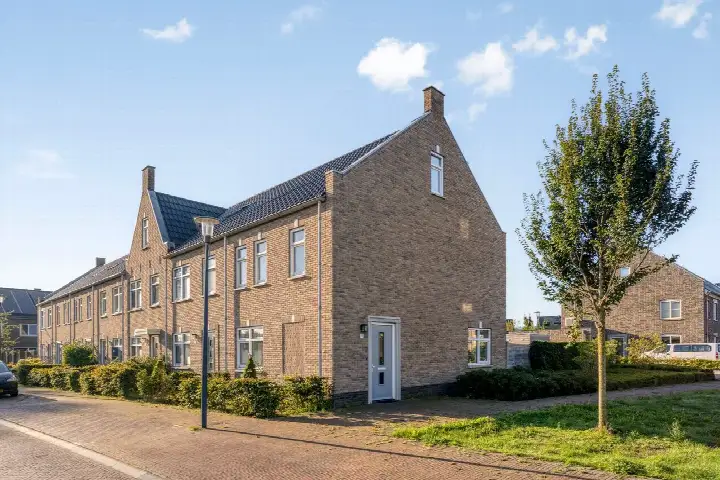
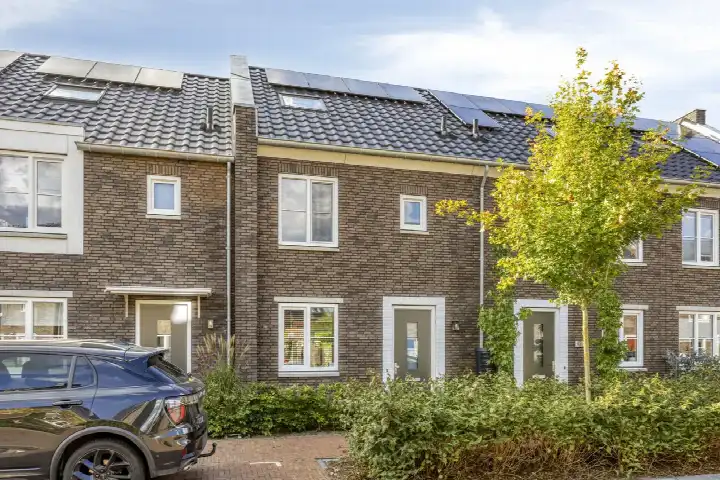
Auto-translated to English by AIThe housing stock is mainly post-war — 54% was built between 1945 and 1990. In addition, the most common type is flats (49%).
Over the past year a home for sale in Keizerslanden was listed for an average of €427,634 (€4,000 per m²). That is 19% below the Dutch national average. Last quarter prices rose by 11%.
A rental home in Keizerslanden cost an average of €1,692 per month (€16 per m²). That is 22% below the national average.
Residents give Keizerslanden a 6.9 out of 10 based on 5 reviews. The strongest score is for accessibility (7.8), the weakest for housing (6.0).
Wijk Keizerslanden has 12,900 residents. The largest age group is 25 to 45 years (32%).
The housing supply in Keizerslanden is remarkably efficient: 64% has an A, A+ or B label. The average natural gas consumption per household is 540 m³ per year.
From Keizerslanden you can on average reach a supermarket at 0.7 km, a GP at 0.6 km, a railway station at 2.3 km, a primary school at 0.6 km (as the crow flies, source: CBS).
Right now you will find 63 homes for sale and 4 homes for rent in Keizerslanden.