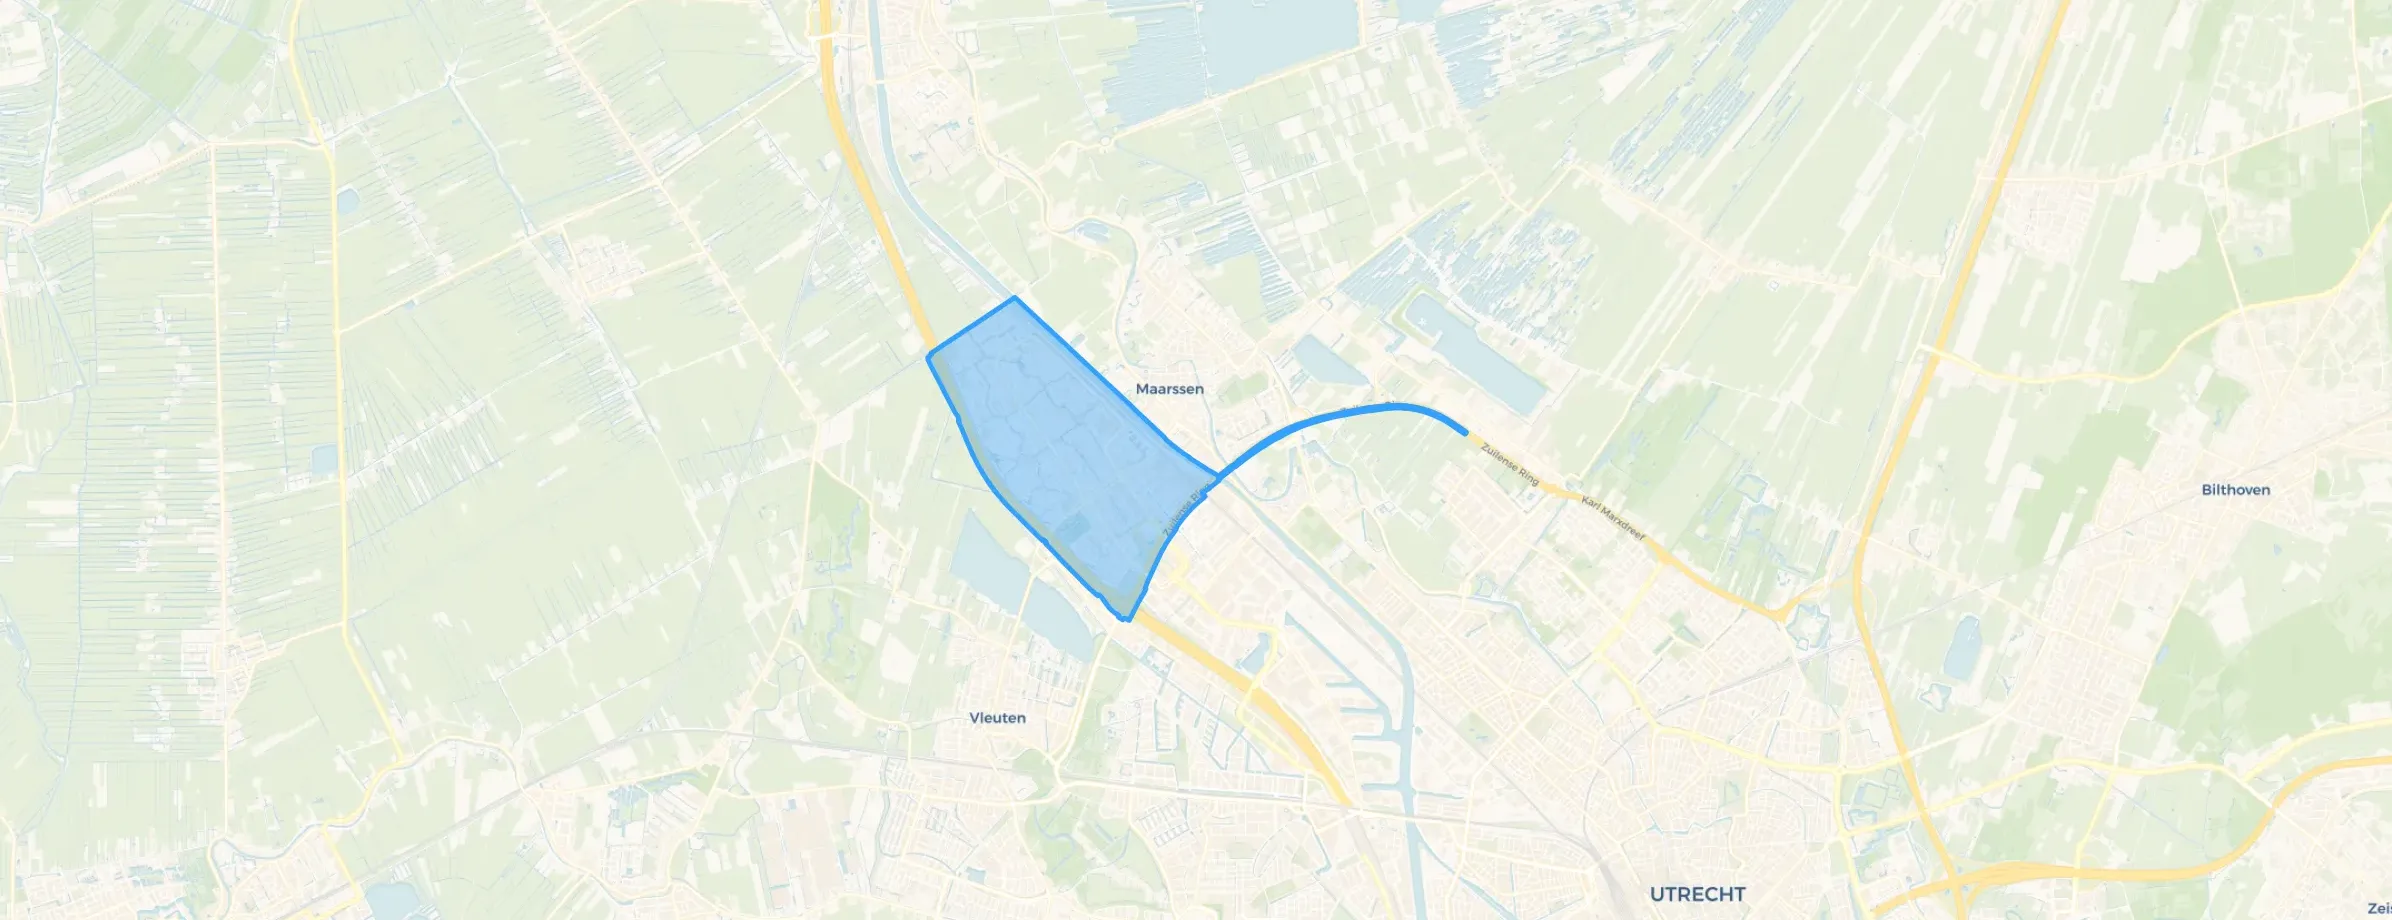
District in Stichtse Vecht
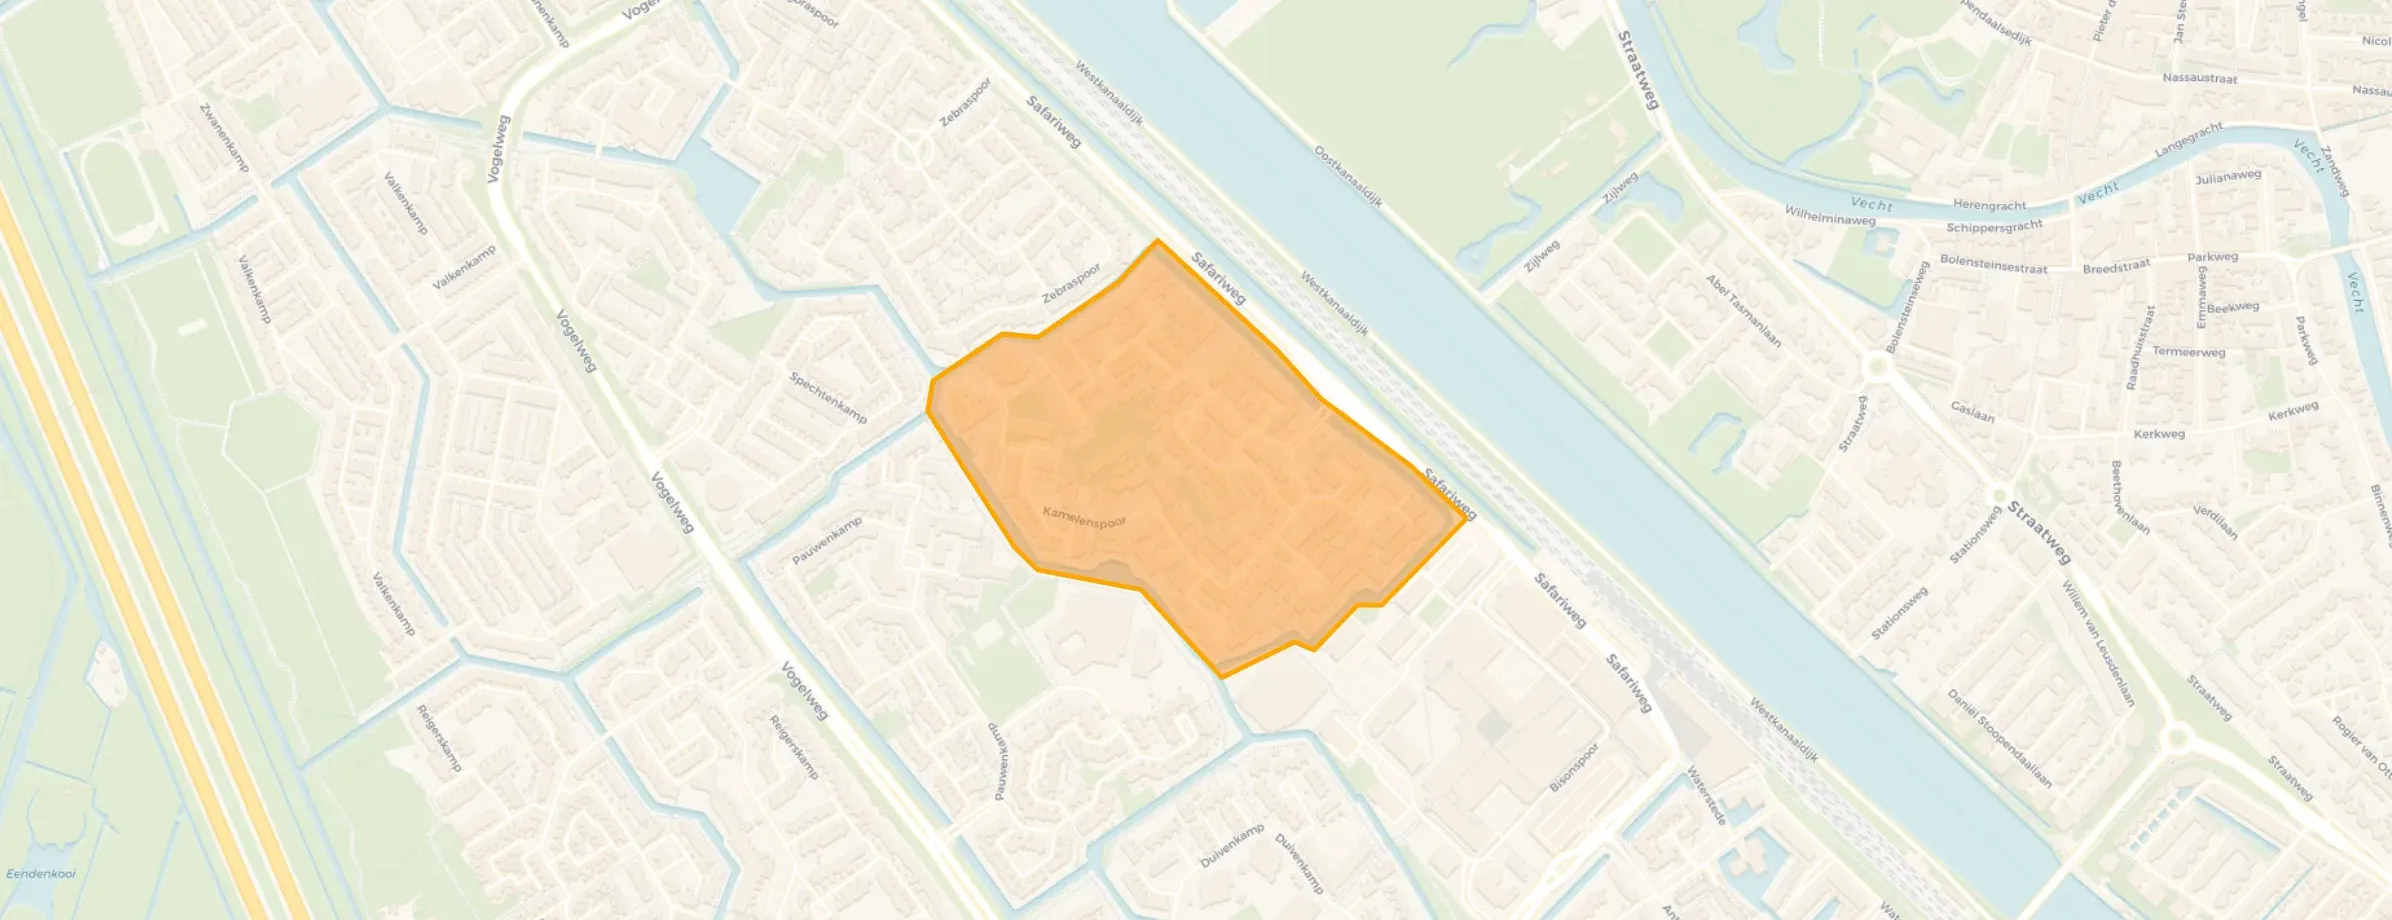
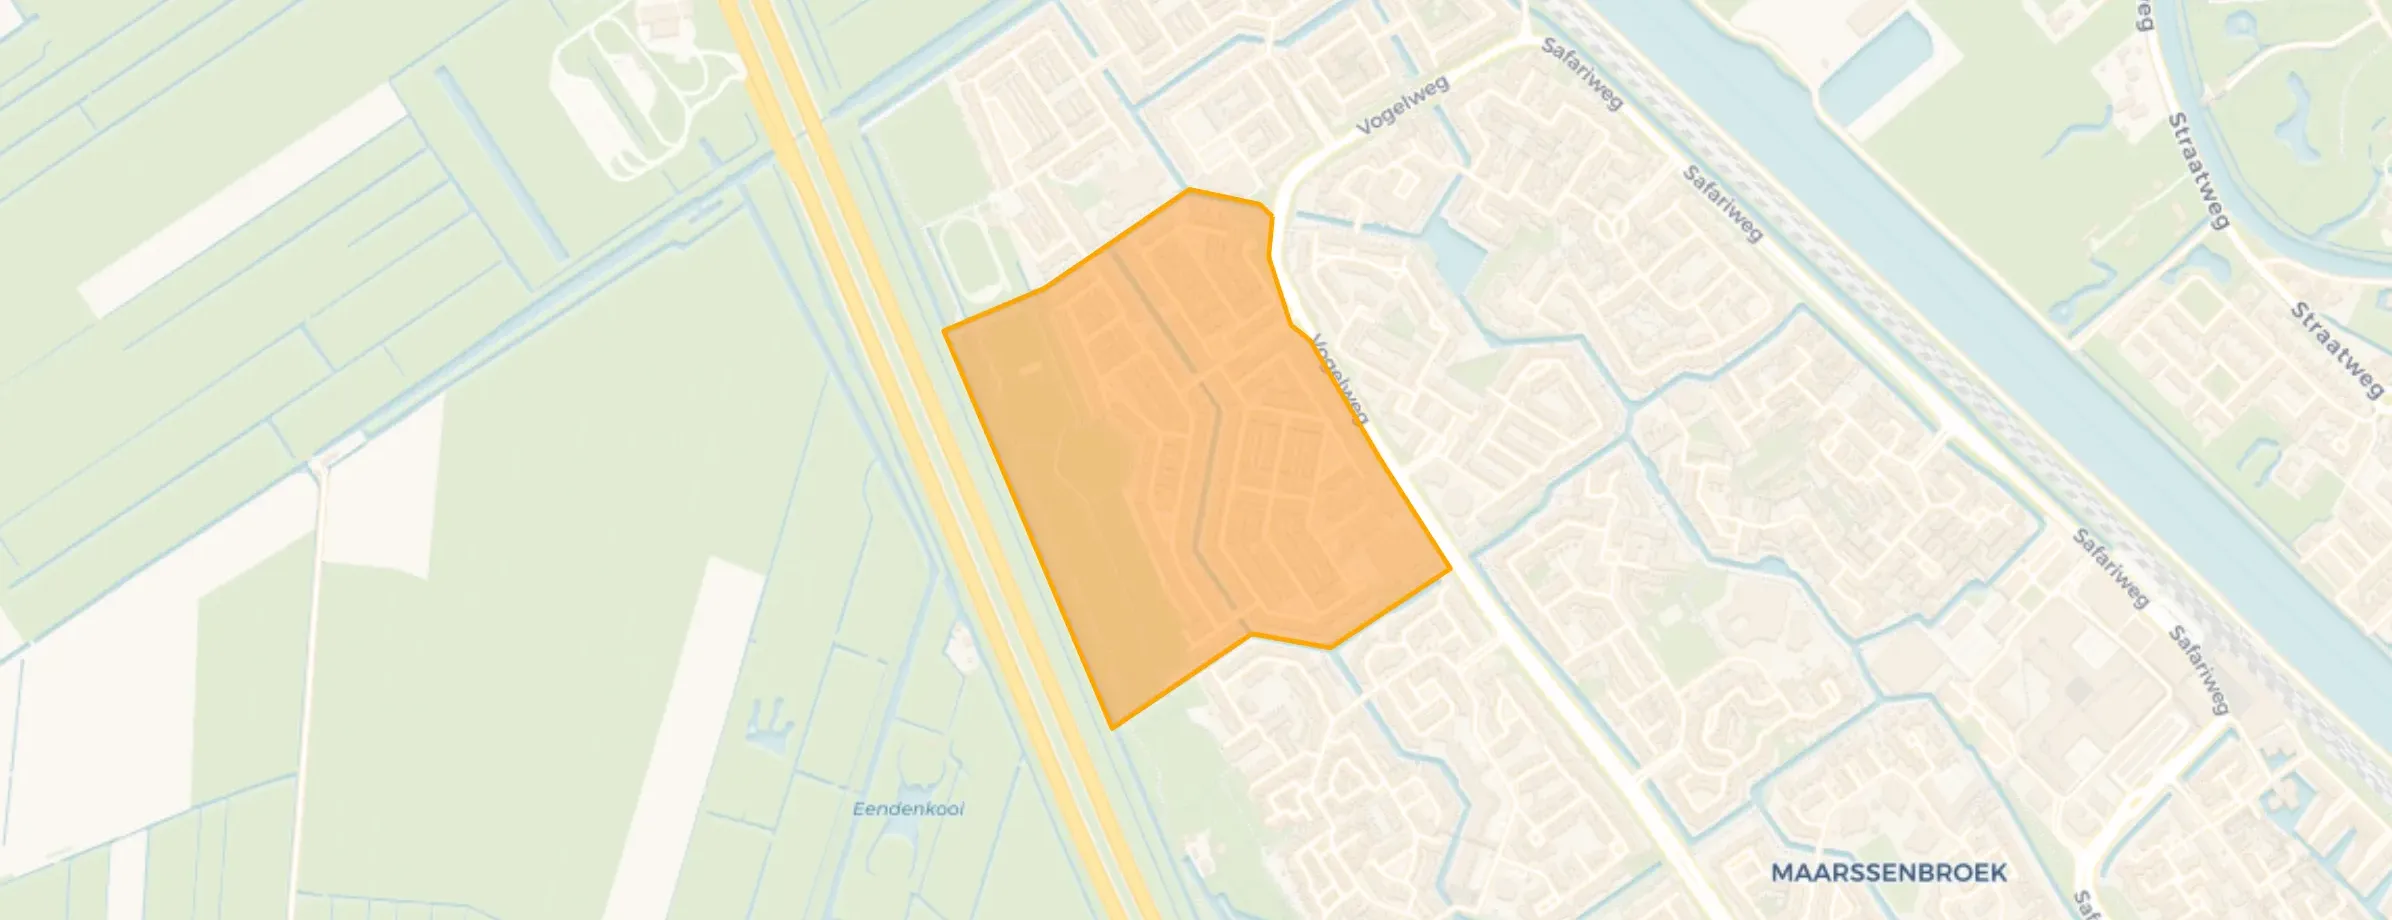
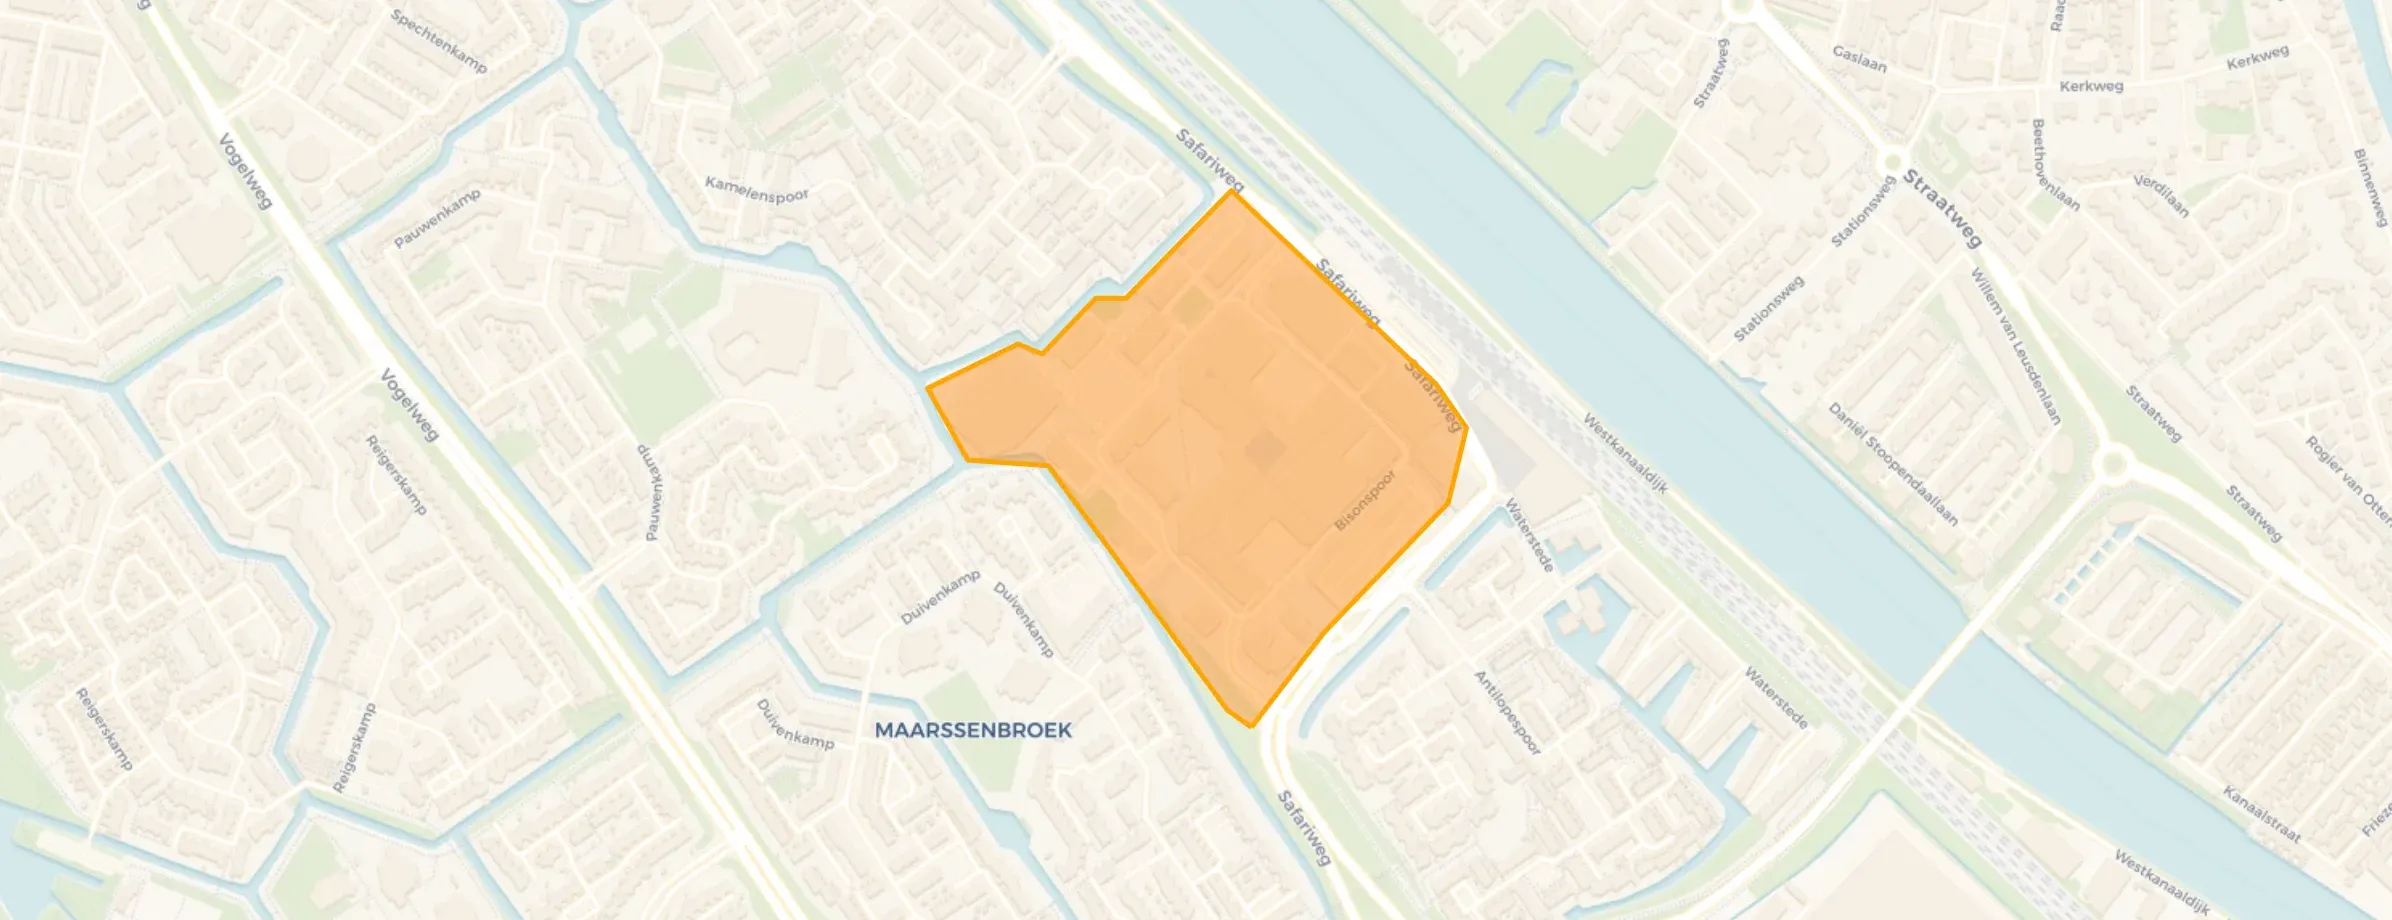
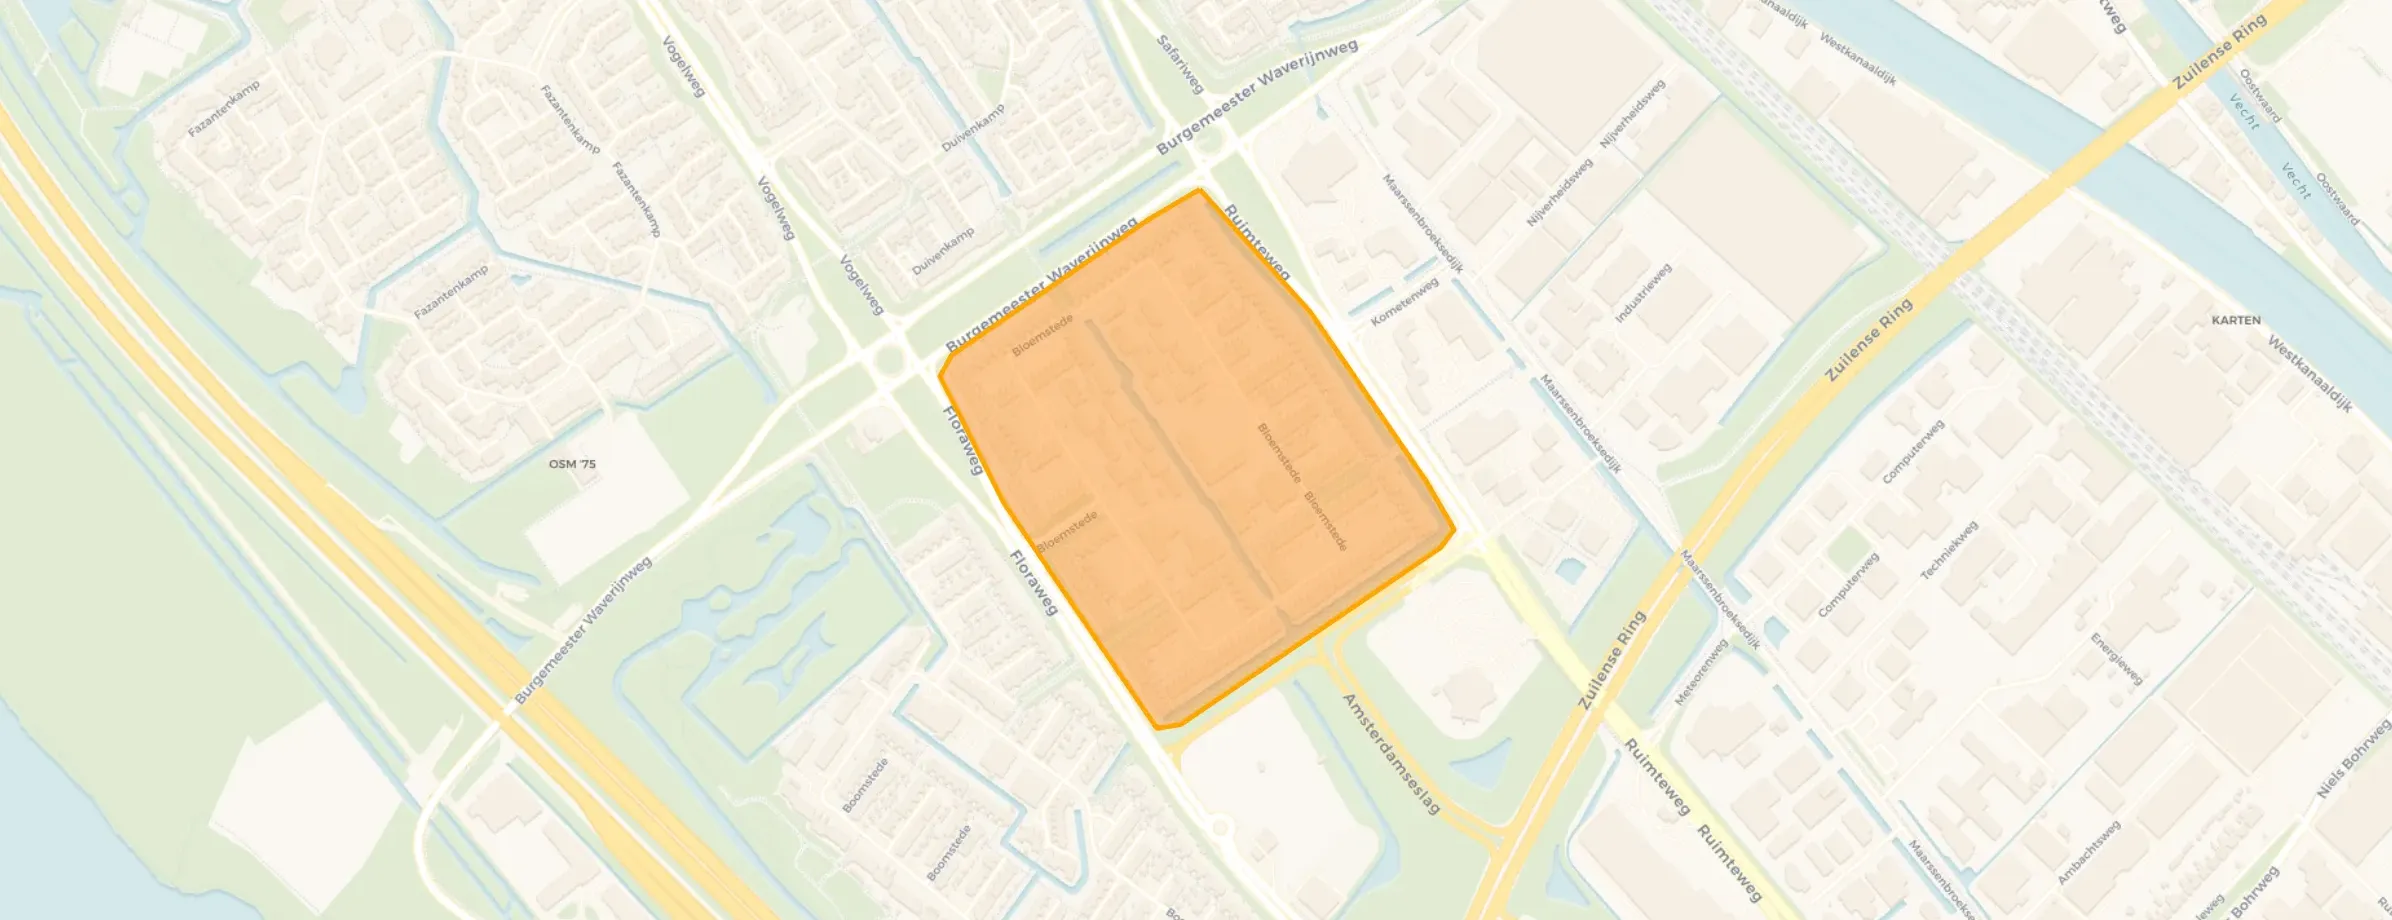
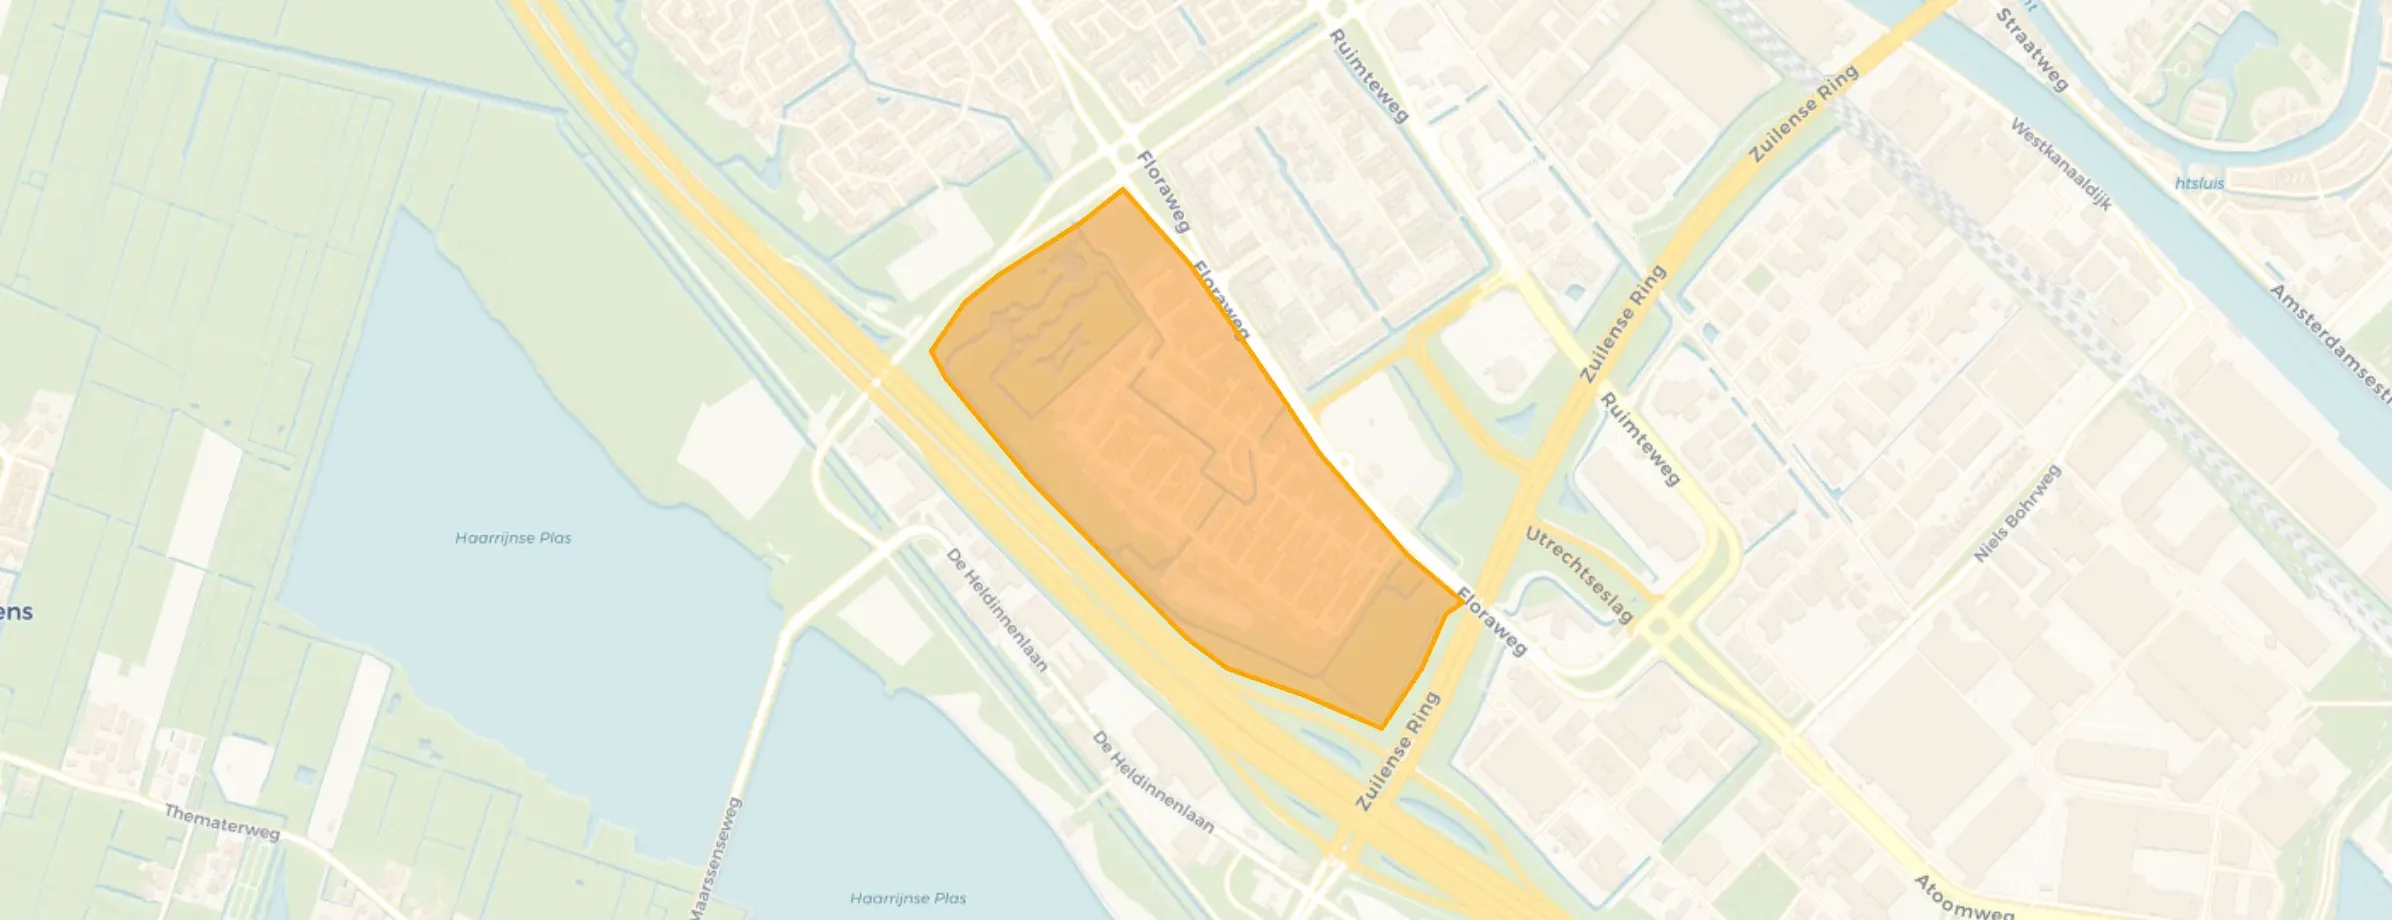
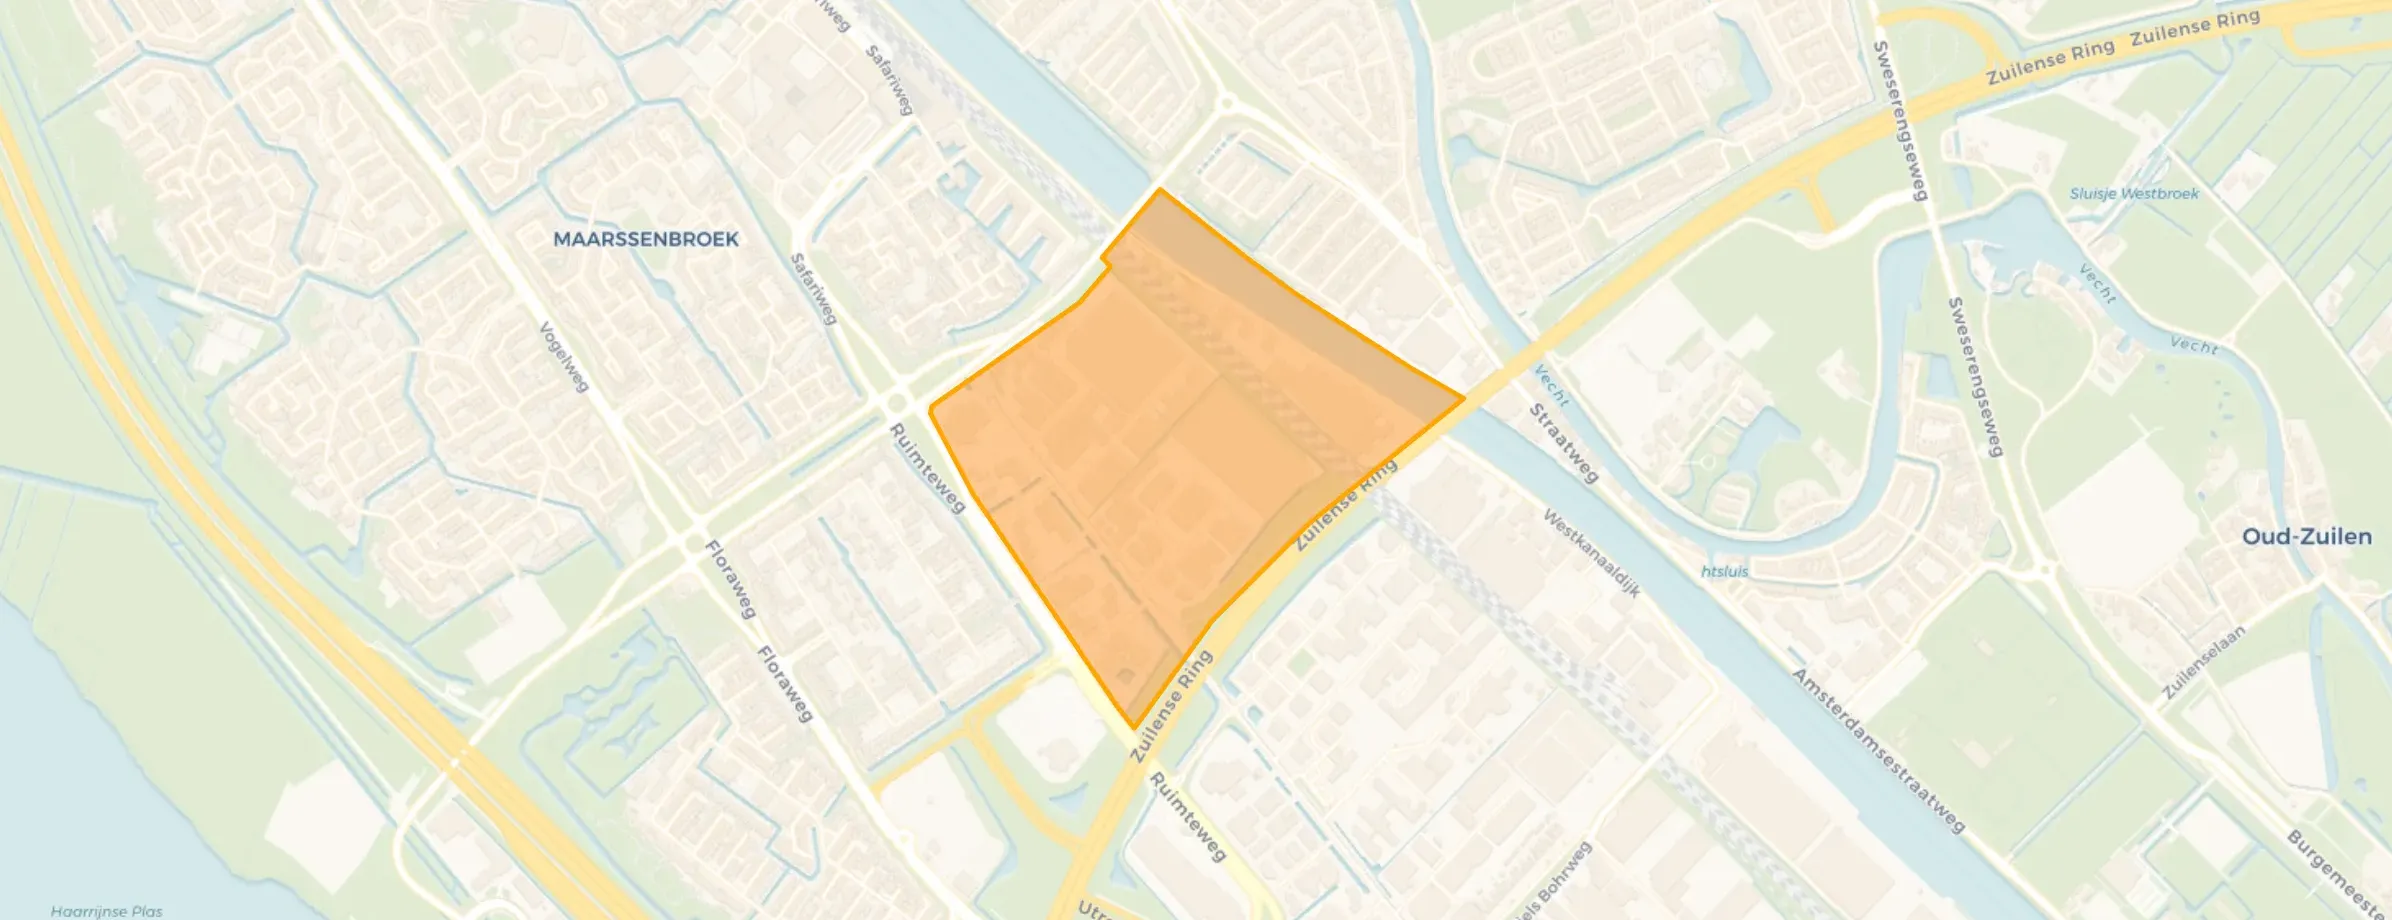
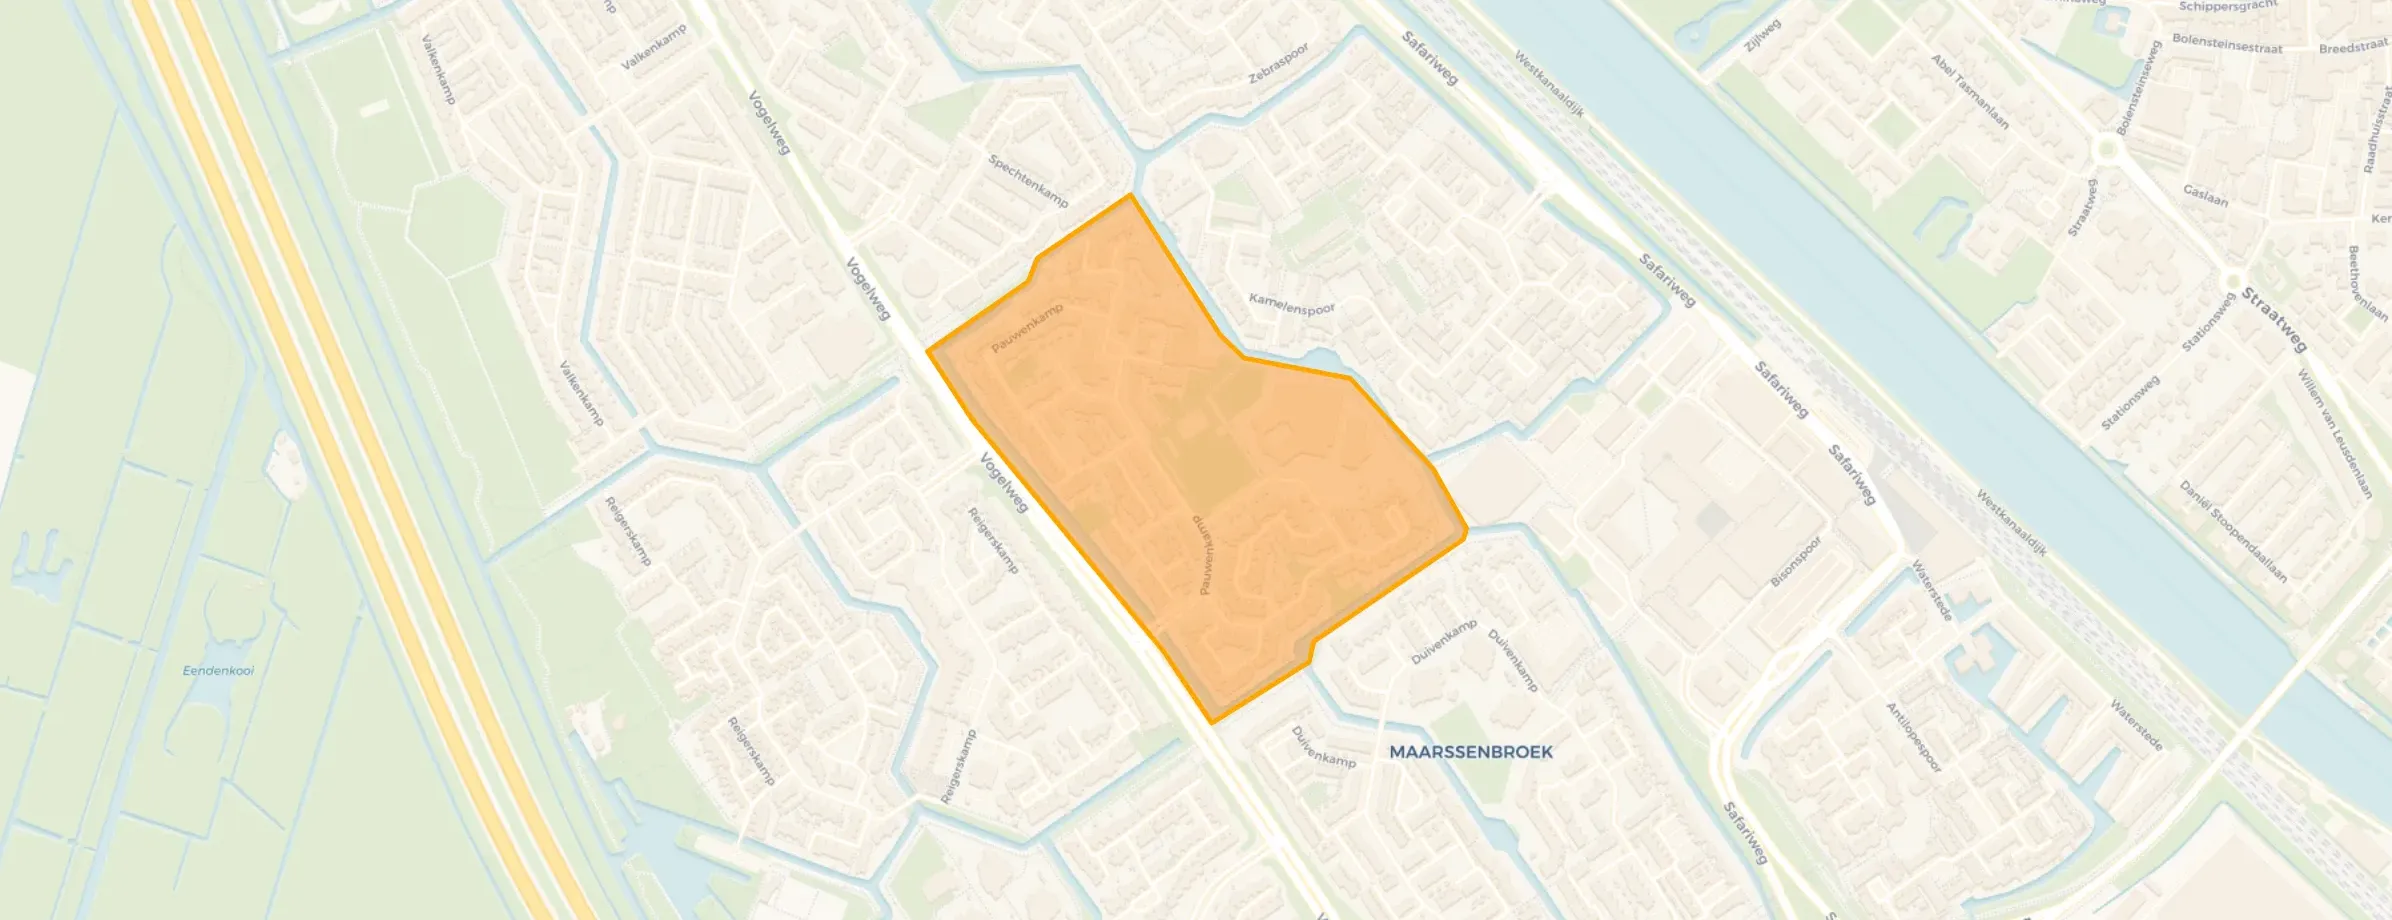
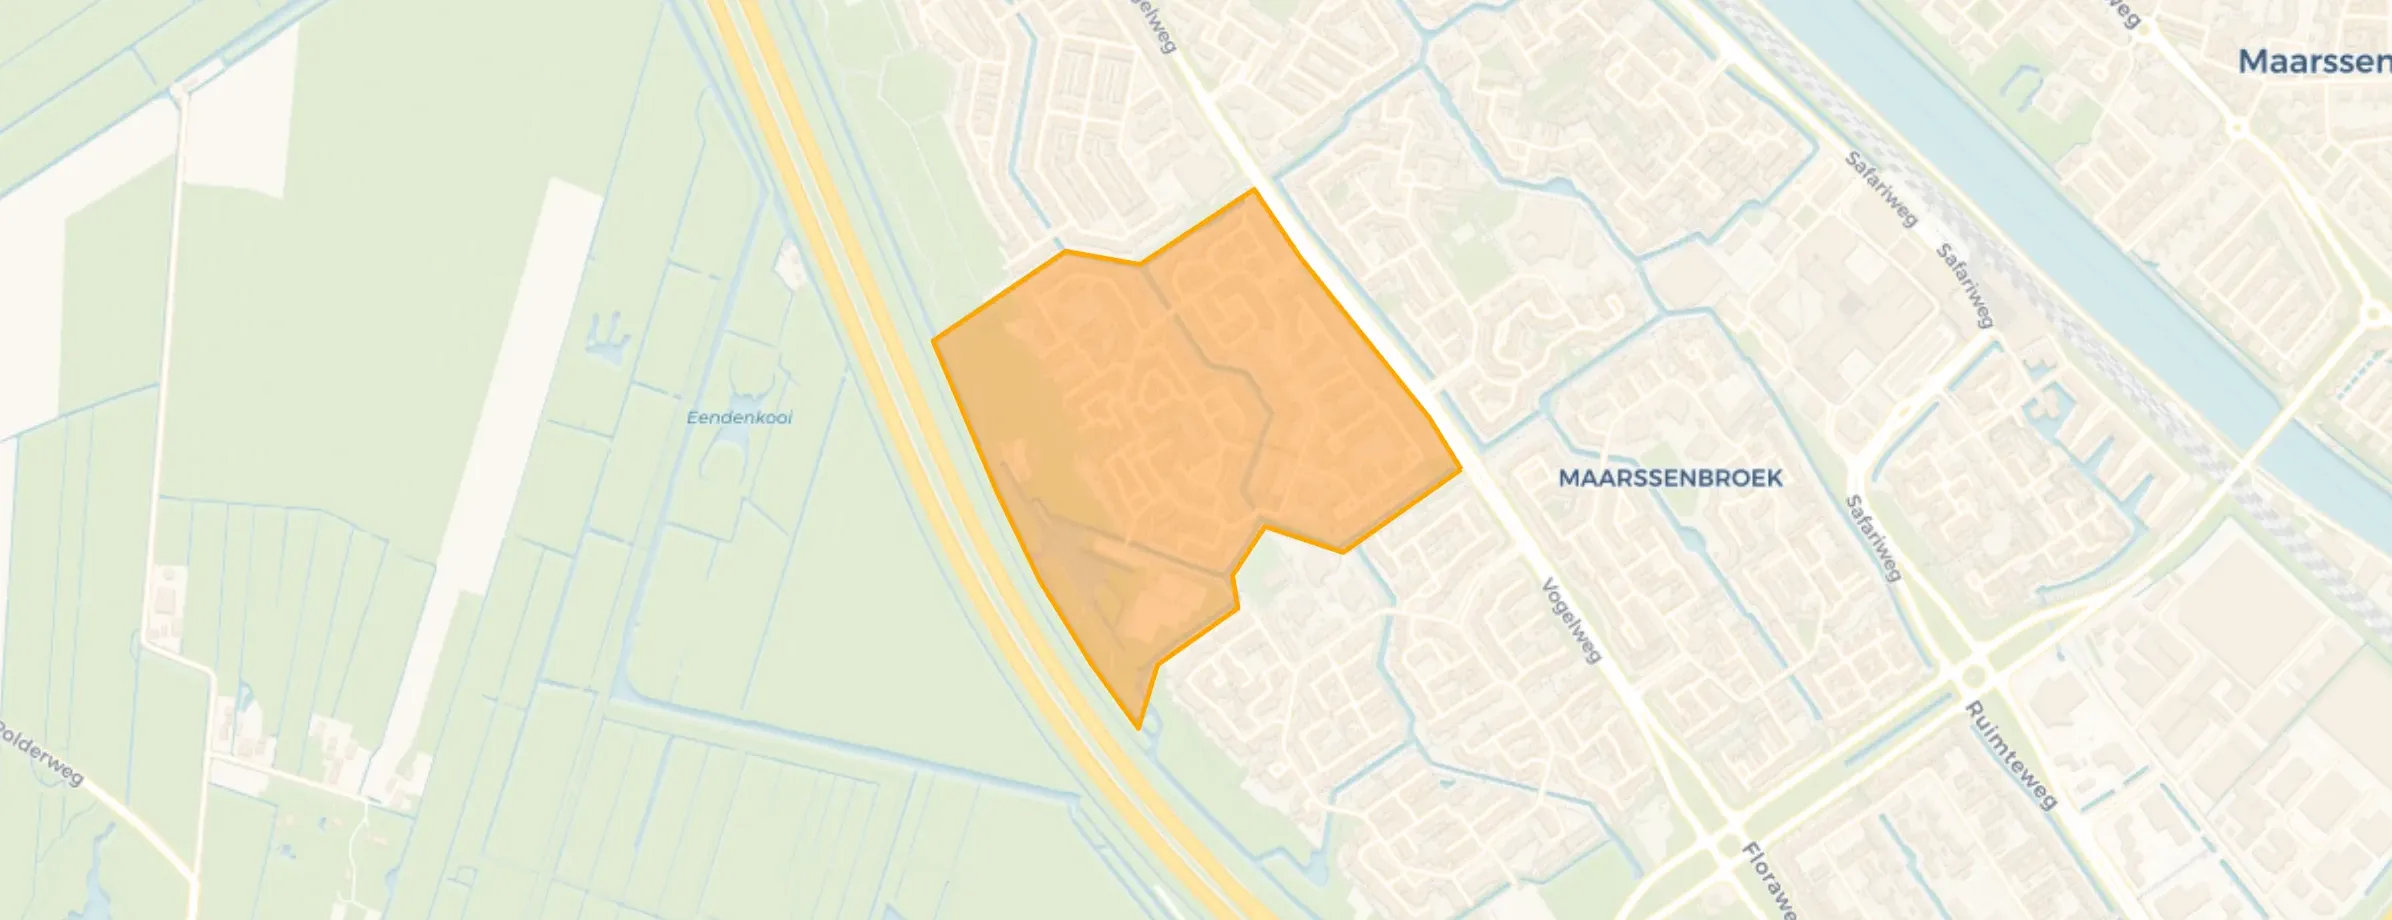
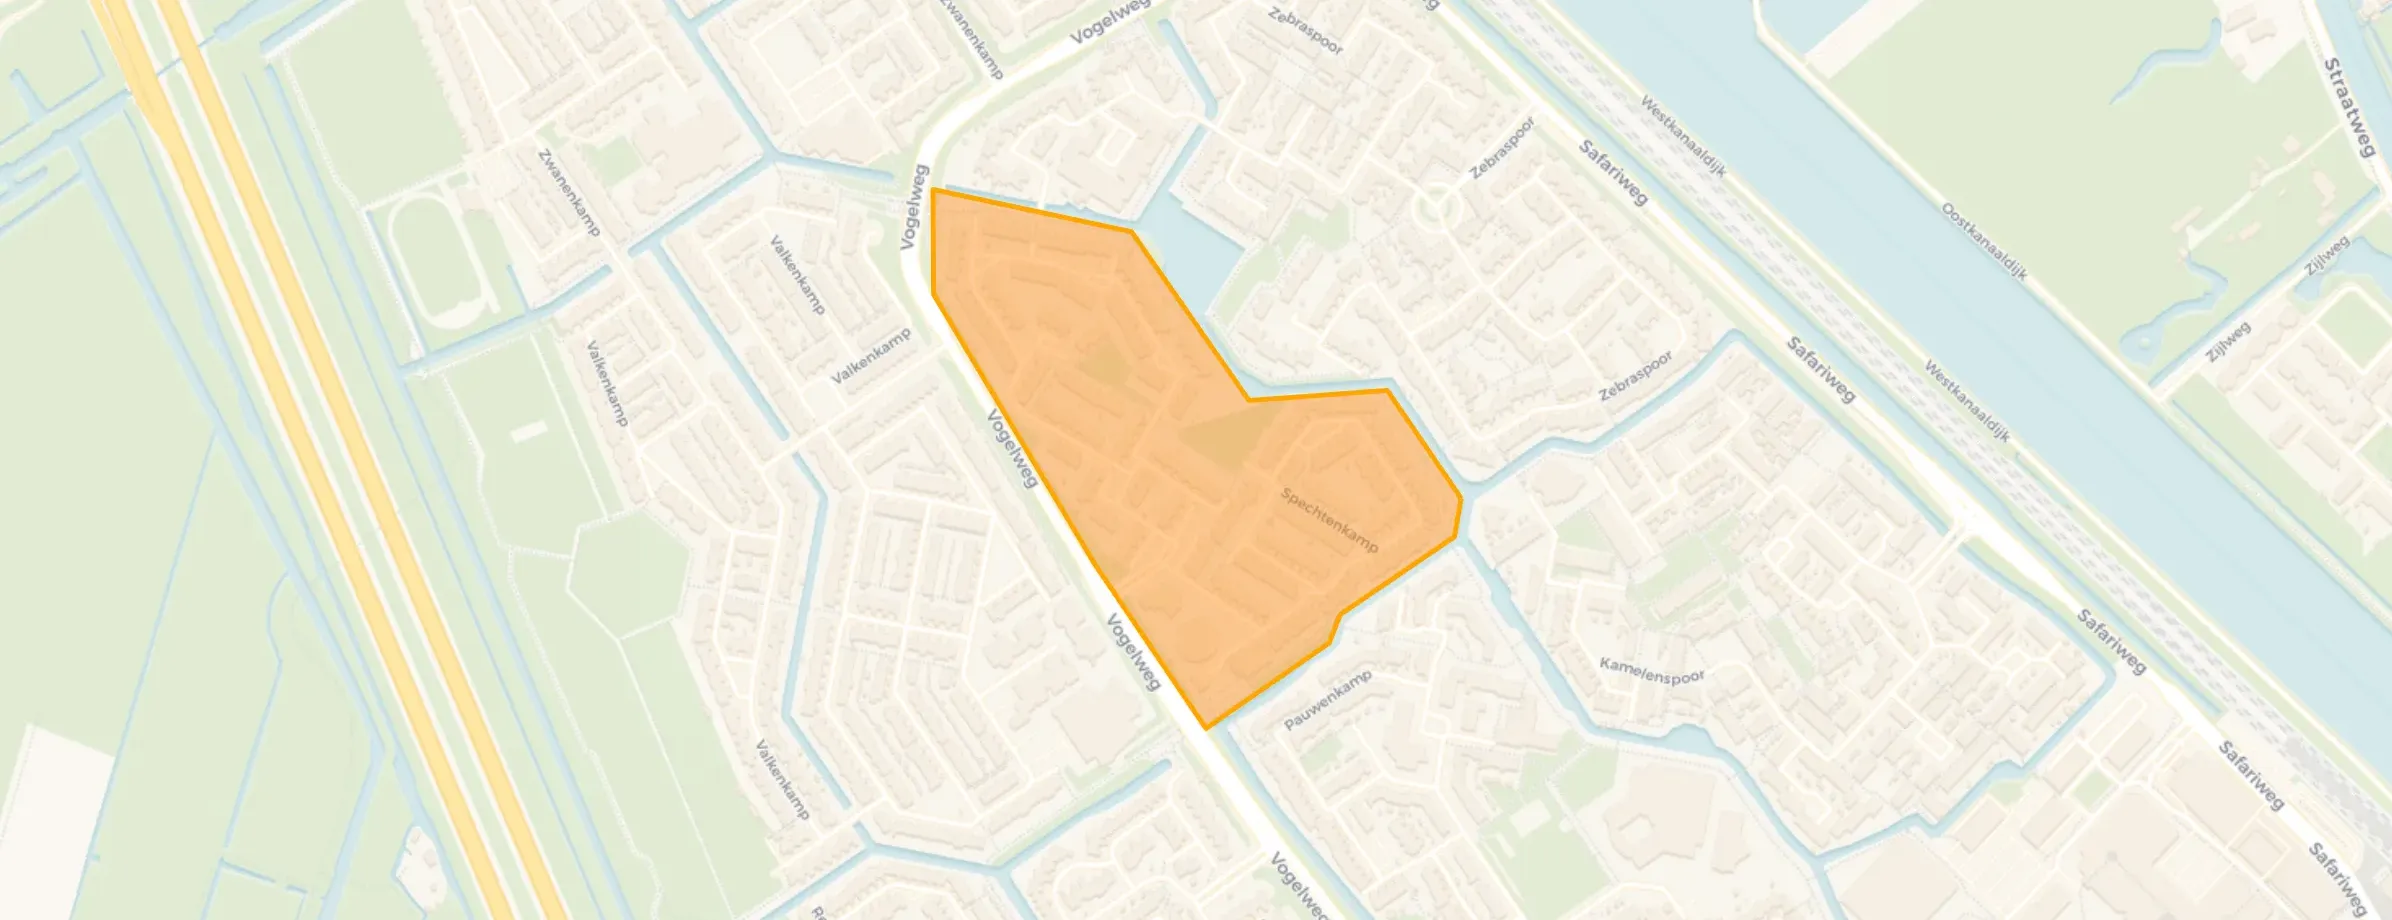
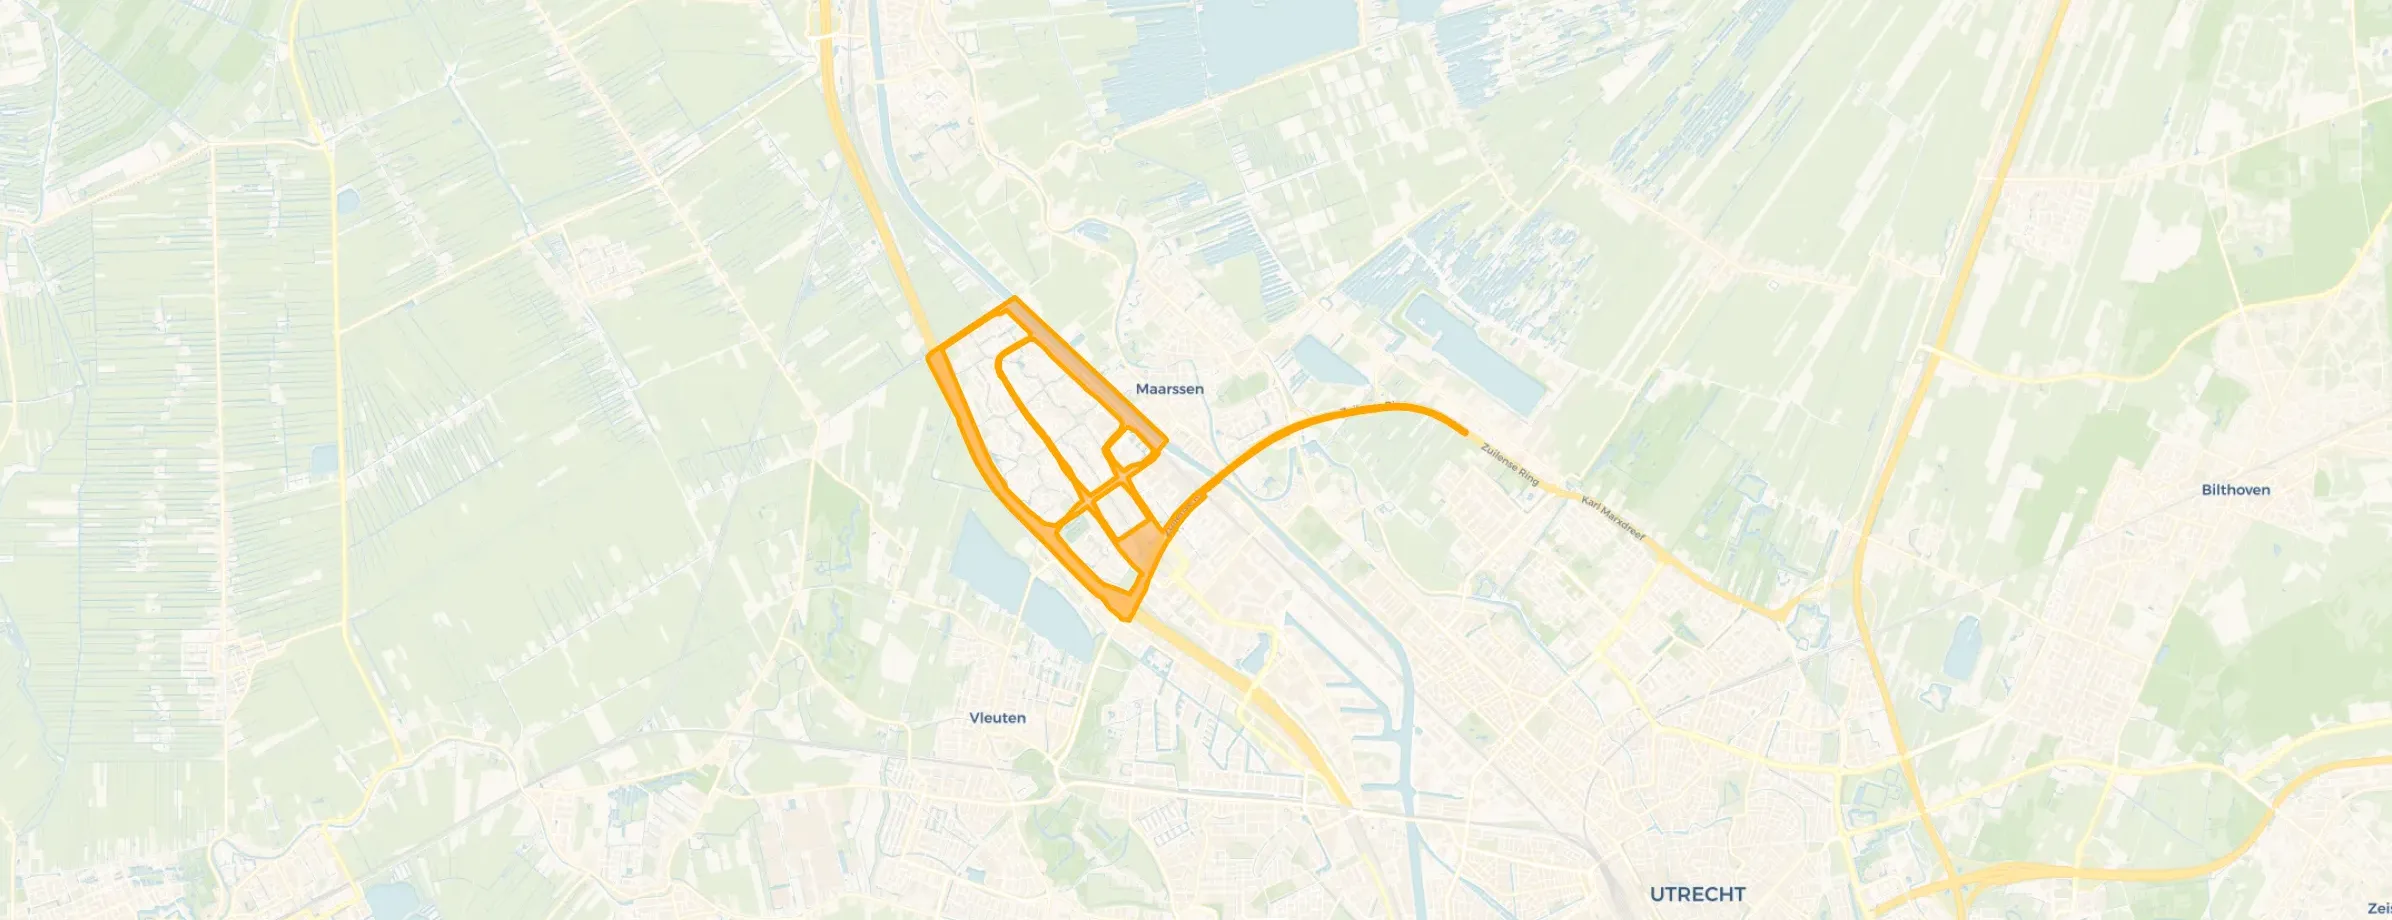
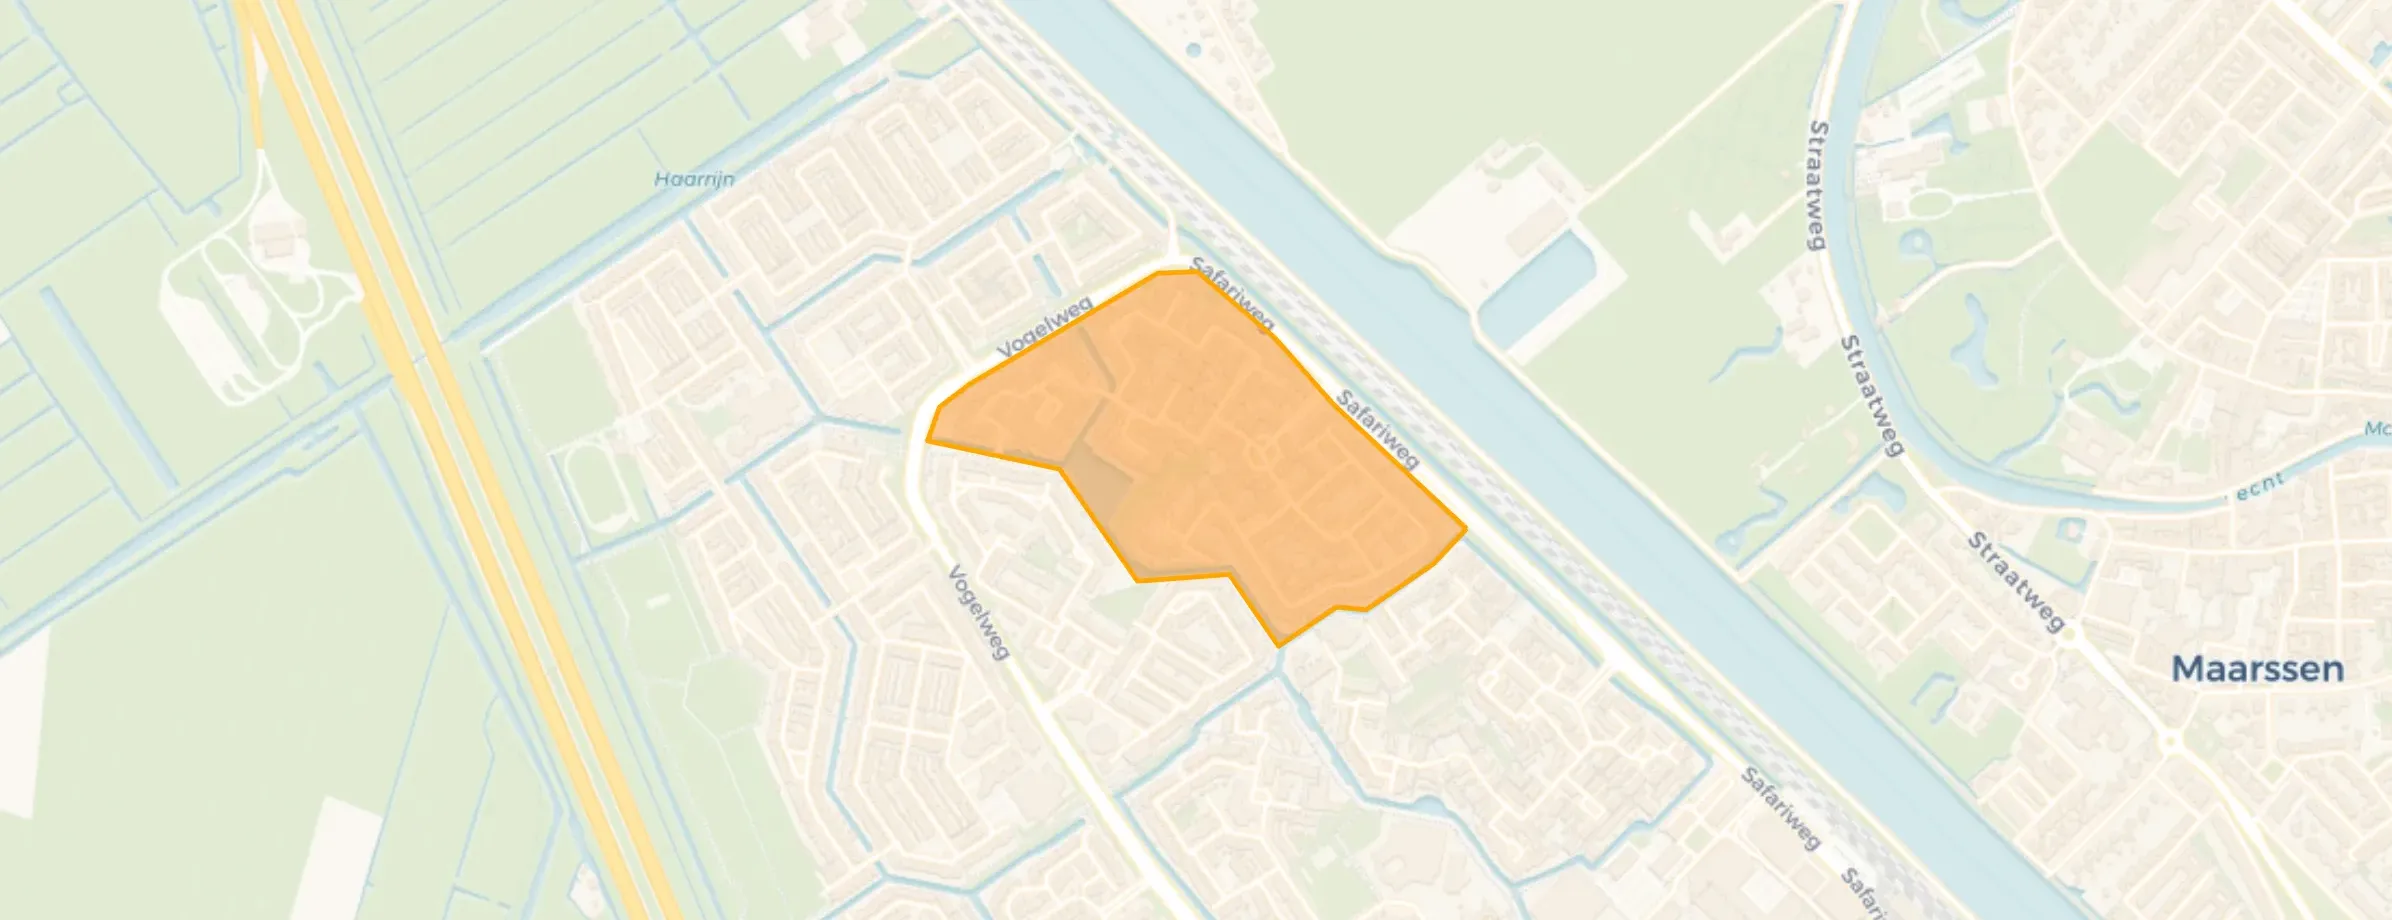
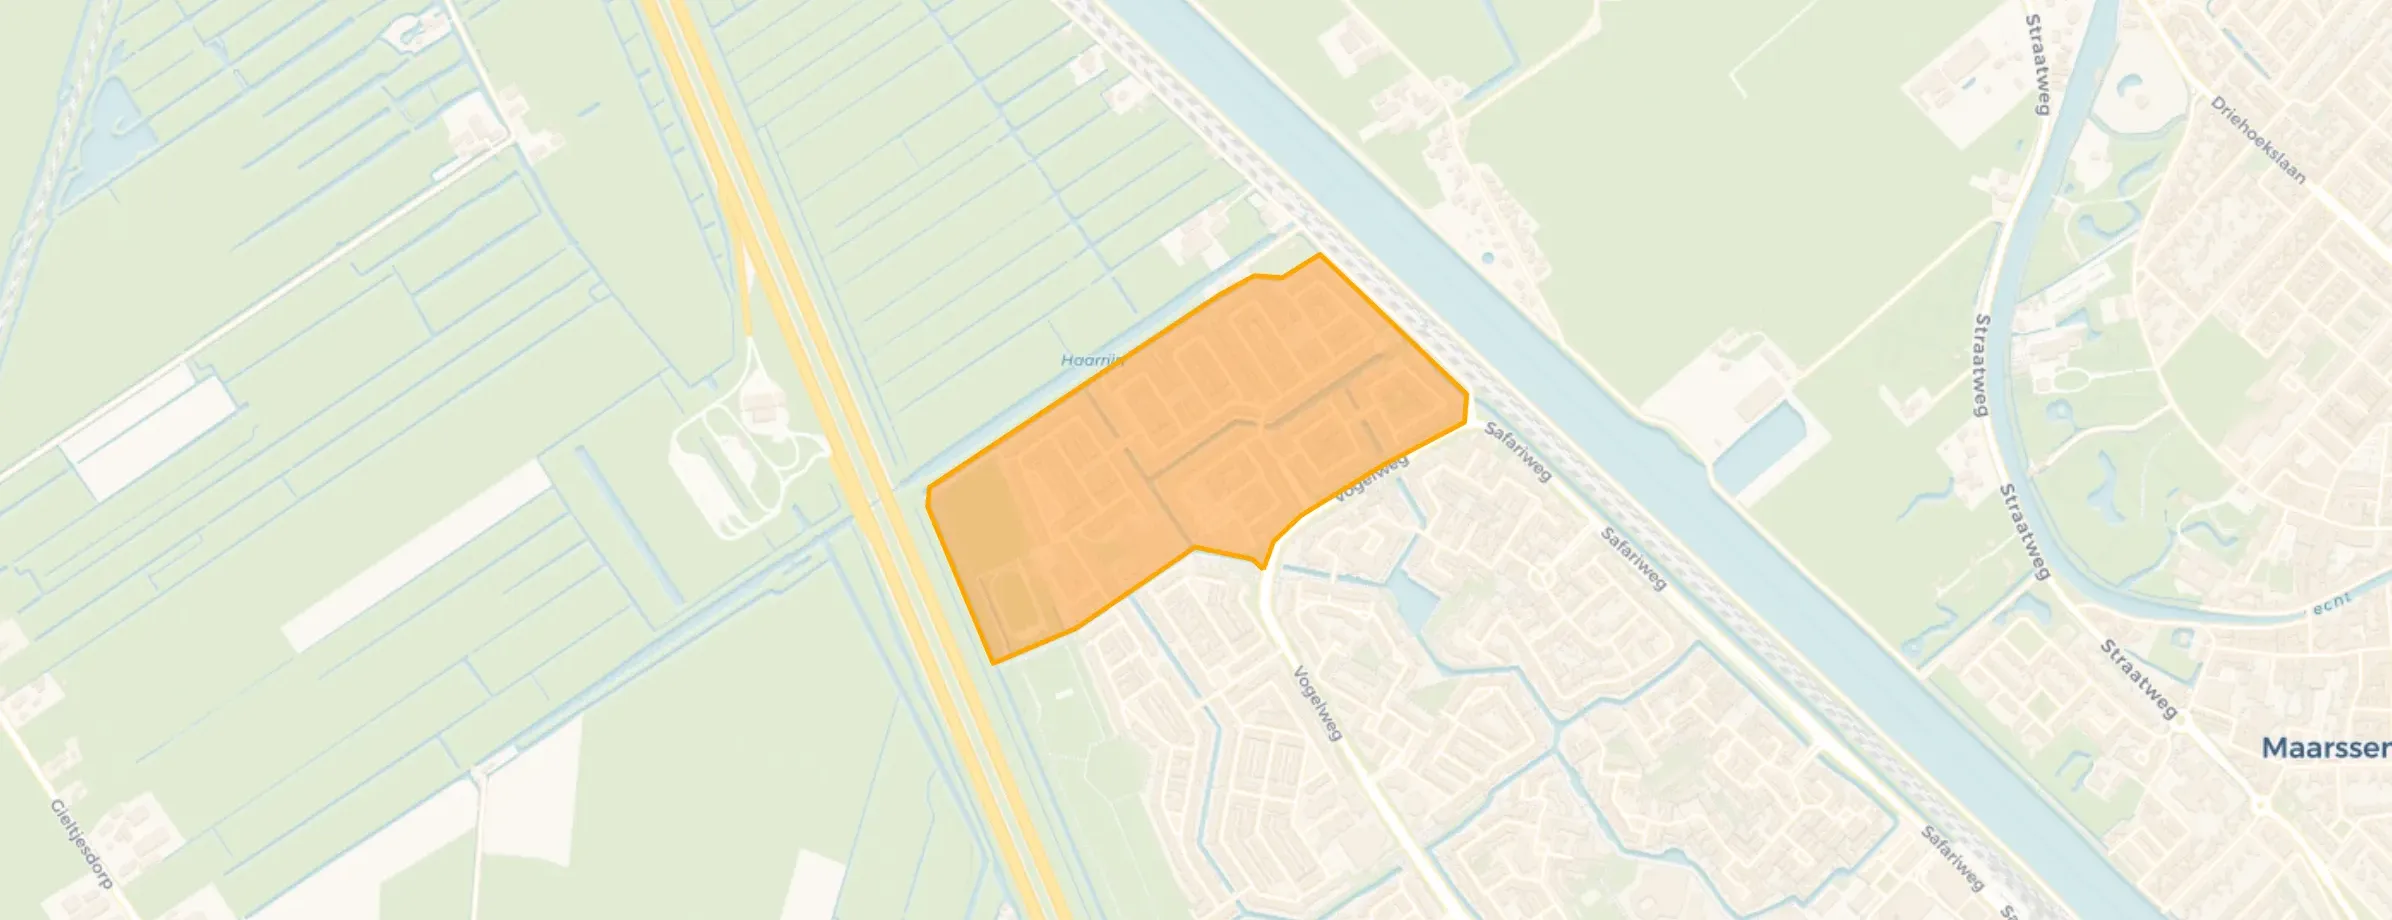
Maarssenbroek is located in the province of Utrecht, in the municipality of Stichtse Vecht The district has a total area of 499 hectares, of which 450 hectares are land and 48 hectares are water. The district is coded as WK190412. The postcode area is 3605BD-3608XN.
Maarssenbroek has 23.635 residents. Of these, 49,3% are men and 50,7% are women. Most residents are 25 to 45 years (28,2%). The other age groups are 24,4% for '45 to 65 years', 20,0% for '65 years or older', 17,1% for '0 to 15 years' and 10,3% for '15 to 25 years'. Of the residents, 48,1% is unmarried, 40,2% is married, 7,8% is divorced and 3,9% is widowed. 16.215 residents originate from the Netherlands, 1.955 come from Europe and 5.465 come from countries outside Europe.
There are 10.440 households in Maarssenbroek. 33,7% of these are single-person households, 28,3% households without children and 38,0% households with children. The average household size is 2,3 persons. The national average is 2,1 persons.
In Maarssenbroek there are 19.100 income recipients. The average income per income recipient is €41.100, which is €1.100 (3%) lower than the national average of €42.200. Per resident, the average income is €33.500, which is €1.400 (4%) lower than the national average of €34.900. Most residents of Maarssenbroek are educated to an intermediate level. 43,8% have an intermediate education (HAVO, VWO or MBO 2-4), 29,2% have a university or higher professional education (HBO/WO) and 27,0% have a lower education (VMBO or MBO 1).
Of the 23.635 residents, around 73% are in paid employment, which amounts to 17.254 people. This is 1% higher than the national average of 72%. The majority of workers are in salaried employment (87%), while 13% are self-employed. In Maarssenbroek, 24% of residents receive a benefit. The largest group is those receiving a state pension (AOW). 4.230 people receive this benefit.
In Maarssenbroek there are 10.197 homes with an average assessed value (WOZ) of €396.000. Of these, around 98% are occupied and 2% unoccupied. Most homes are owner-occupied. This amounts to 37% rental homes and 63% owner-occupied homes. Of the homes, 63% privately owned, 22% owned by housing associations and 15% owned by other landlords. The most common construction periods in Maarssenbroek are 1970-1980 (47%) and 1980-1990 (42%).
There are currently no homes for sale in Maarssenbroek. The most recently listed home is Bloemstede 358 by Tulp Makelaars Verbinders in op Funda. No homes were sold in Maarssenbroek over the past year.
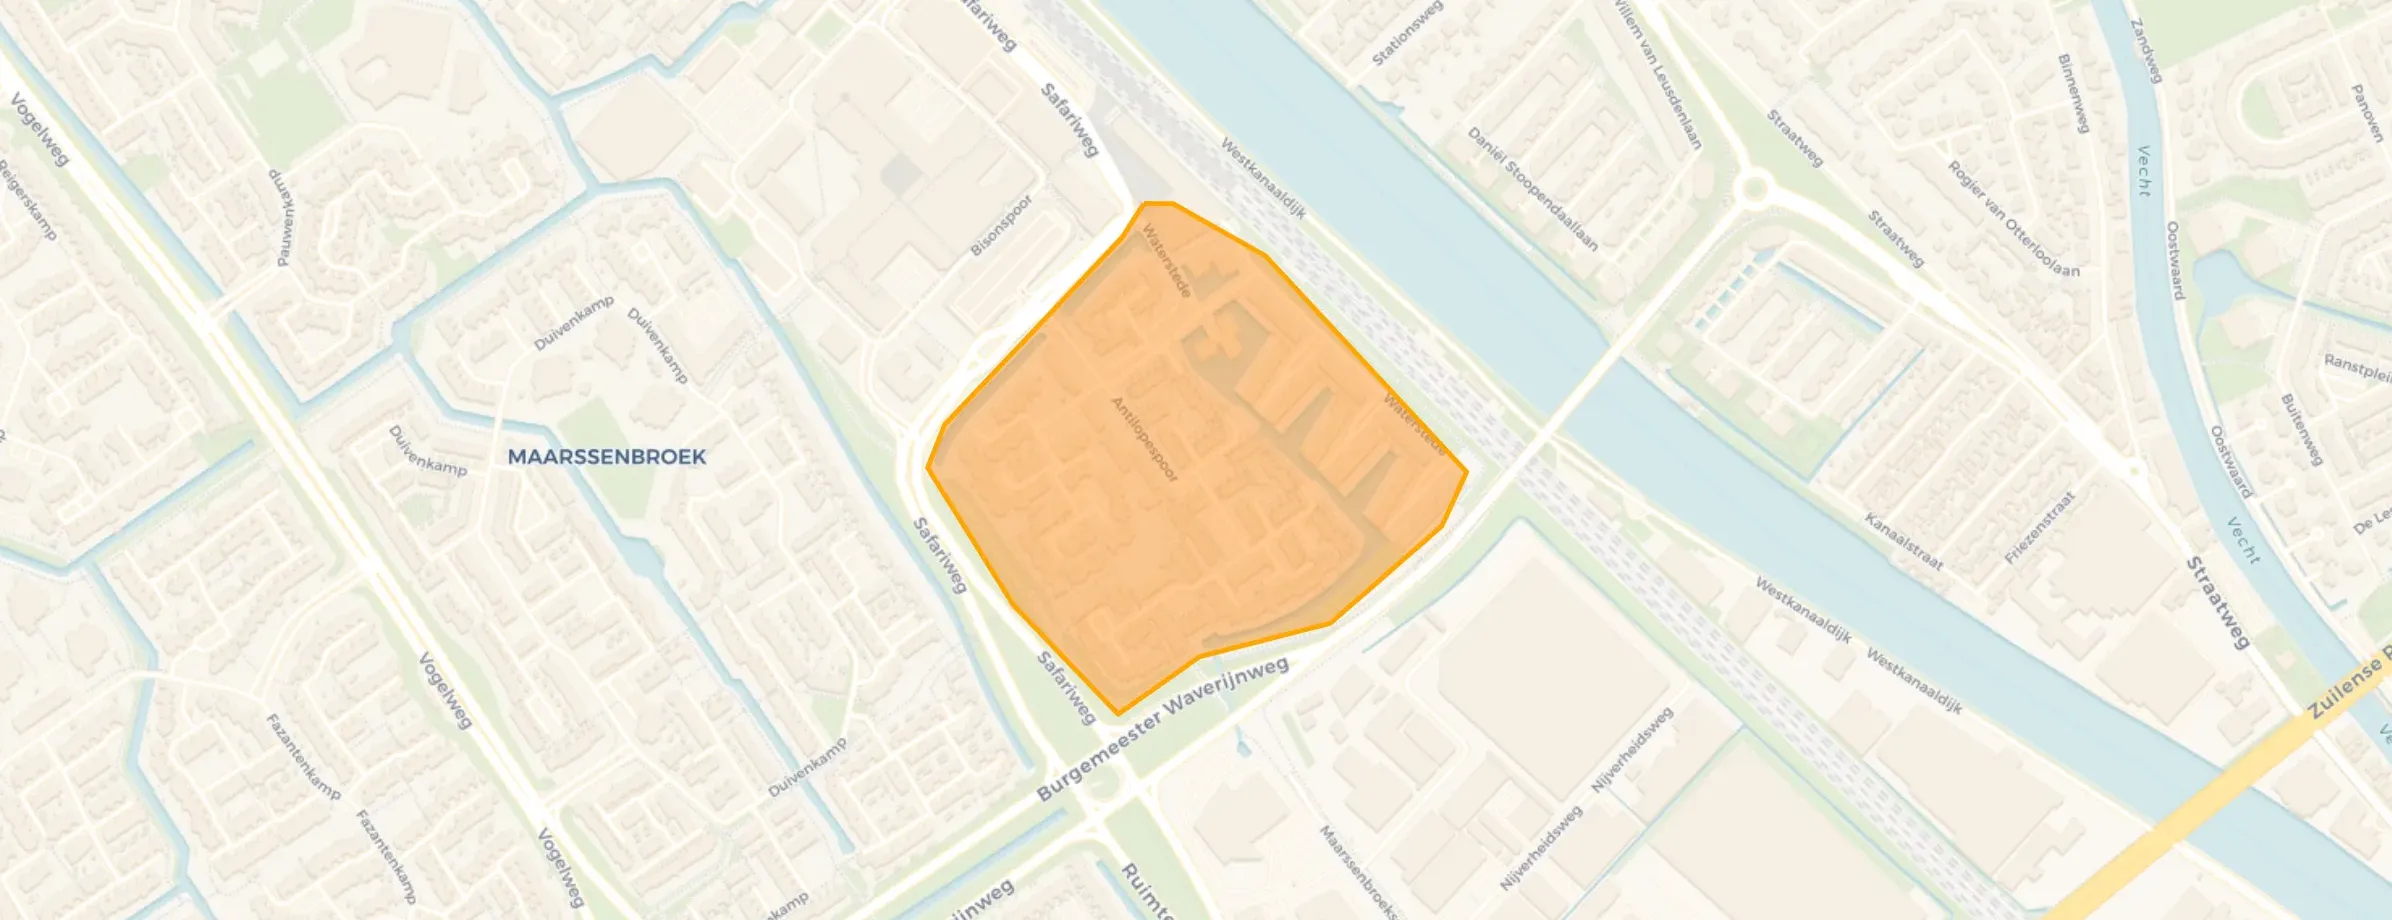
There are currently no homes for rent in Maarssenbroek. The most recent home is Waterstede 71, offered by Executive Home Rentals op Funda. No homes were let in Maarssenbroek over the past year.
No recent rental data available for Maarssenbroek.
In Maarssenbroek there are 6.456 addresses with a registered energy label. The most common labels are A (34%), C (32%) and B (24%). On average, an address in Maarssenbroek uses 2.480 kWh of electricity per year. This is 3% below the national average of 2.550 kWh. With an annual consumption of 770 m³ per address, natural gas consumption is 4% below the national average of 800 m³.
Nuisance from fatbikes
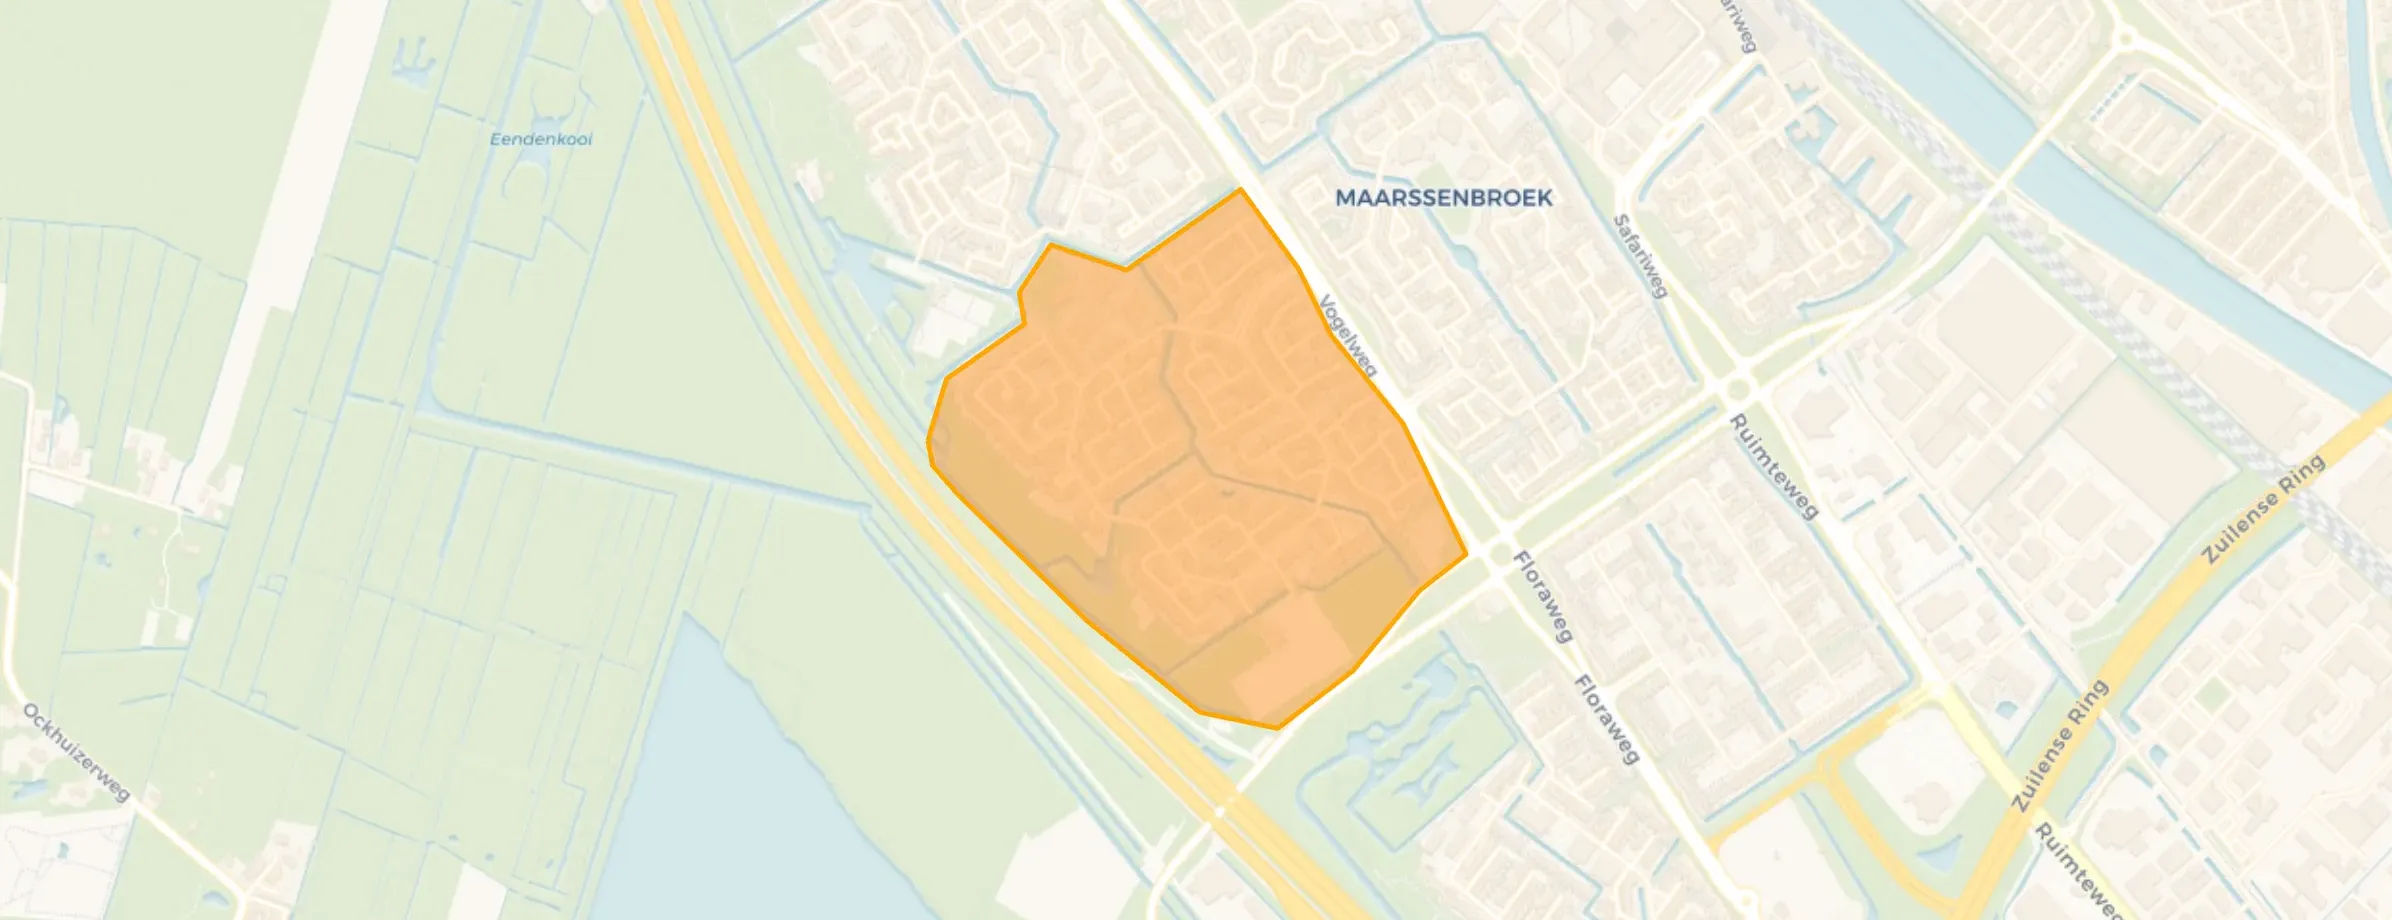
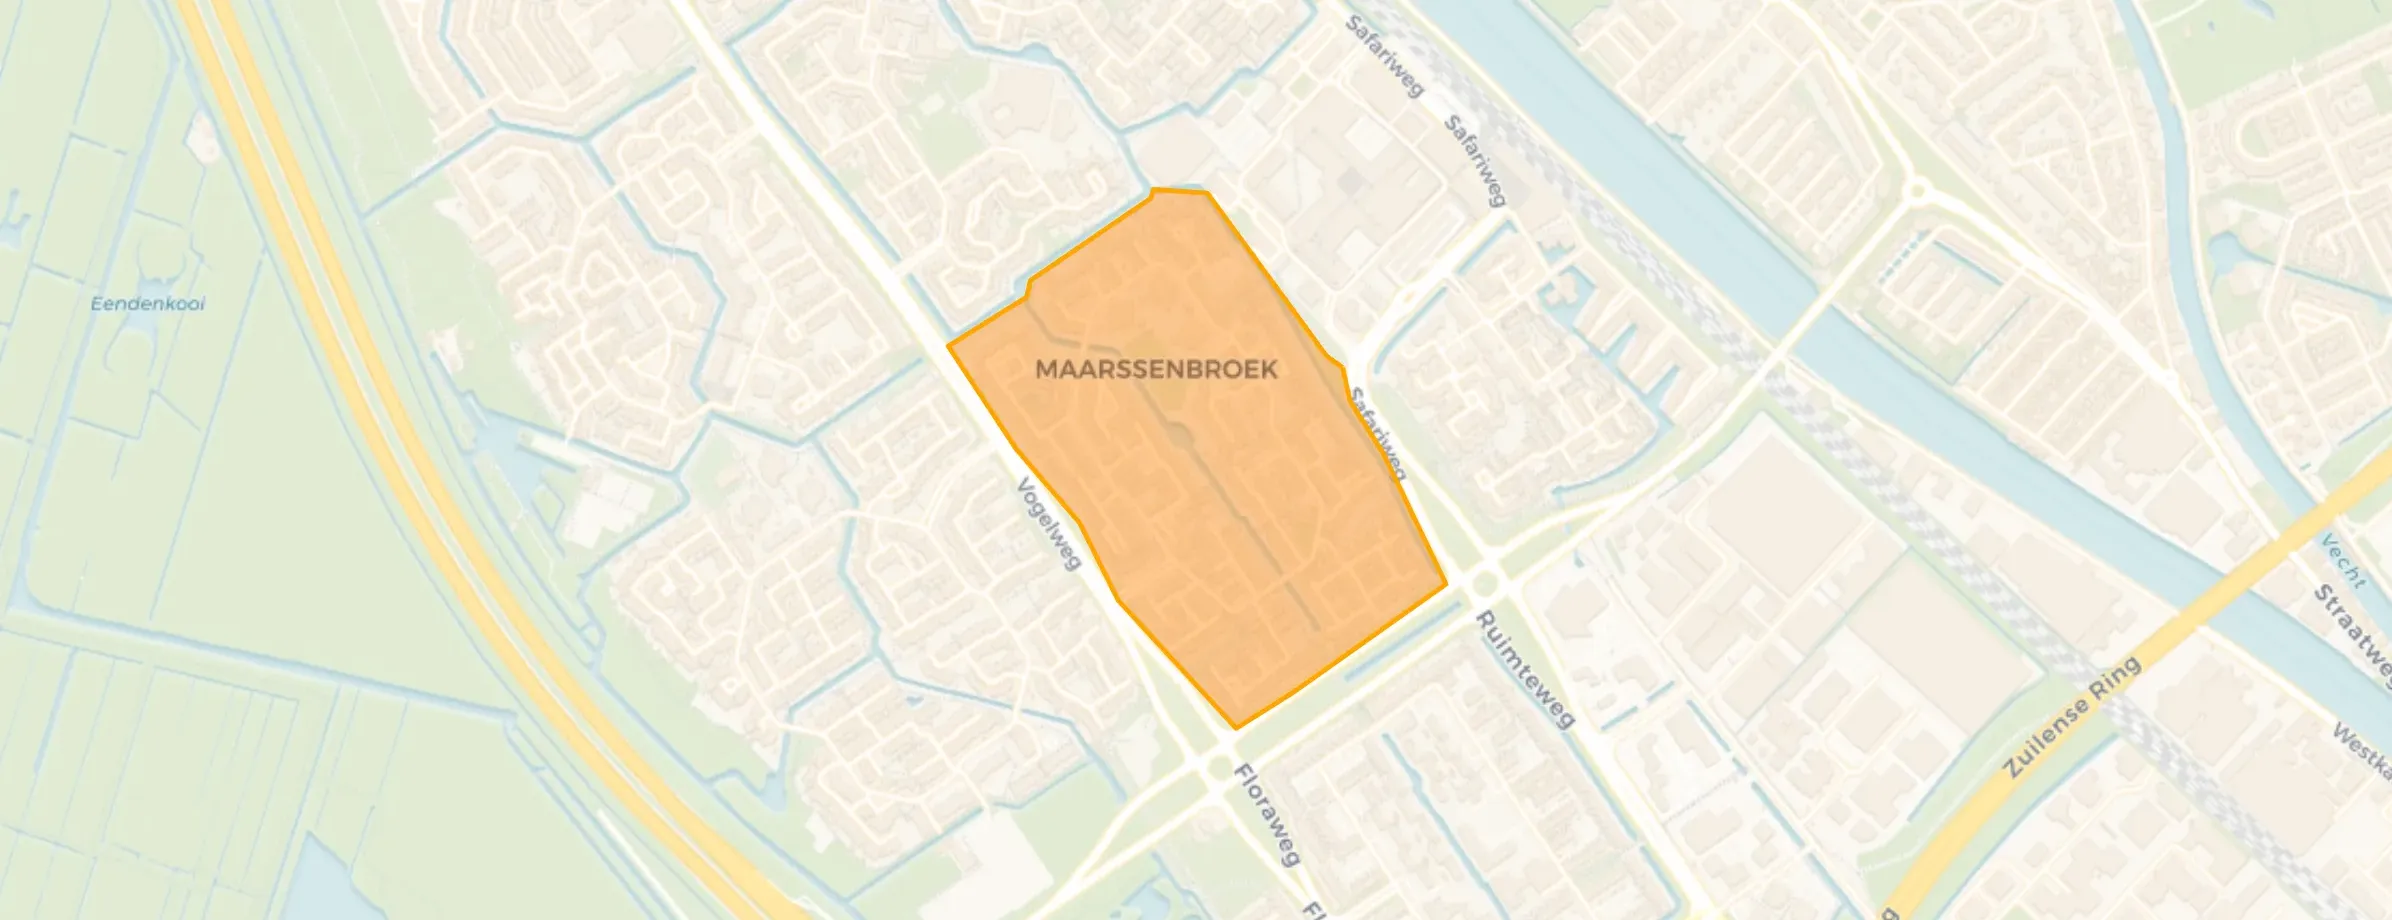
Auto-translated to English by AIKamelenspoor is generally a very nice neighbourhood to live in, especially during the day. Everyone greets each other politely and respects the norms and values of others in the area. This gives a safe and pleasant feeling. Only in the evening everything changes, because a lot of loitering youth come onto the street, causing nuisance in dark spots, making those spots feel unsafe at night. Furthermore, it's a shame that more and more rental houses are appearing in the neighbourhood; this brings different ethnicities, which can sometimes clash a bit, which is of course unfortunate. I would also like to see more nature here, because now there are a few patches of grass and some trees, so a bit more green space would be nice. The housing is fine here, it's just a shame that as soon as you step out the door you can immediately look into someone else's garden or be looked into yourself; you never really have privacy. Otherwise, it's really a nice and cosy neighbourhood.
Auto-translated to English by AINice neighbourhood to live in, many amenities in the immediate vicinity, we enjoy living here, good social control.
Auto-translated to English by AITop neighbourhood
Auto-translated to English by AIBeaten, threatened and sworn at. Burning down.
Auto-translated to English by AINice people, tidy neighbourhood, little nuisance.
Auto-translated to English by AILots of police in the neighbourhood. Residents who think it's normal to have a paddling pool, barbecue in the middle of the through path, so you can't even walk past normally. Neighbours who keep an eye on everything all day. Luckily I'm happy with both neighbours.
Auto-translated to English by AIWhere I live it's quiet, except the neighbour upstairs often throws things down. AT our place they removed almost all children's playground equipment.
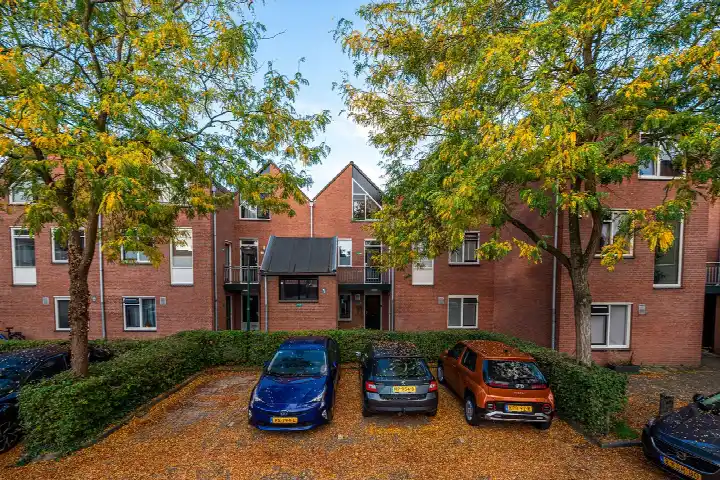
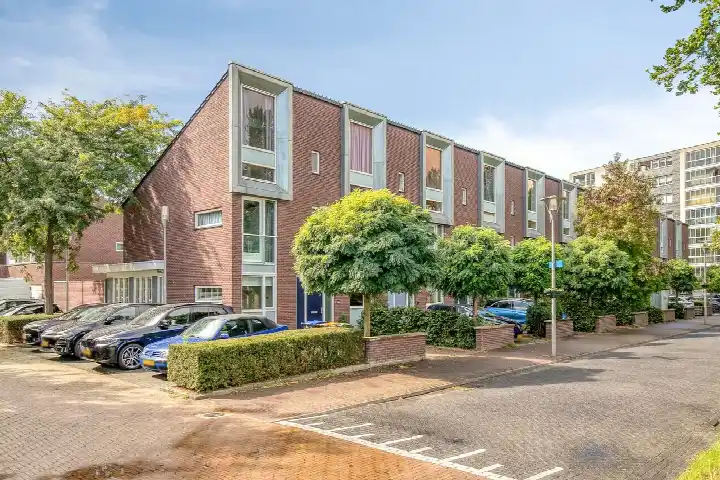
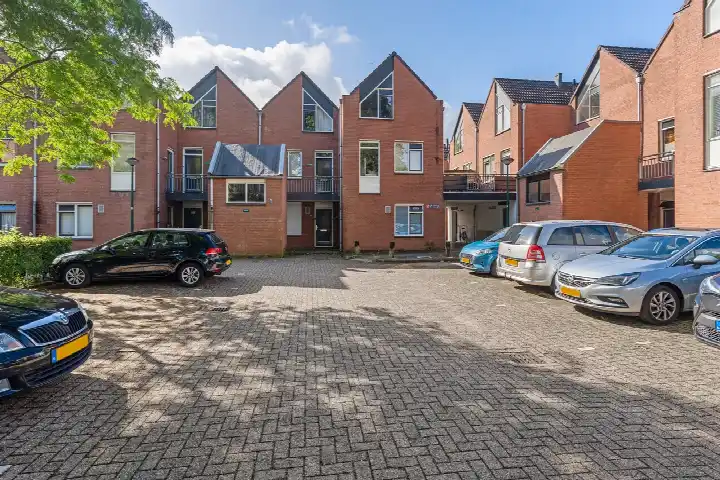
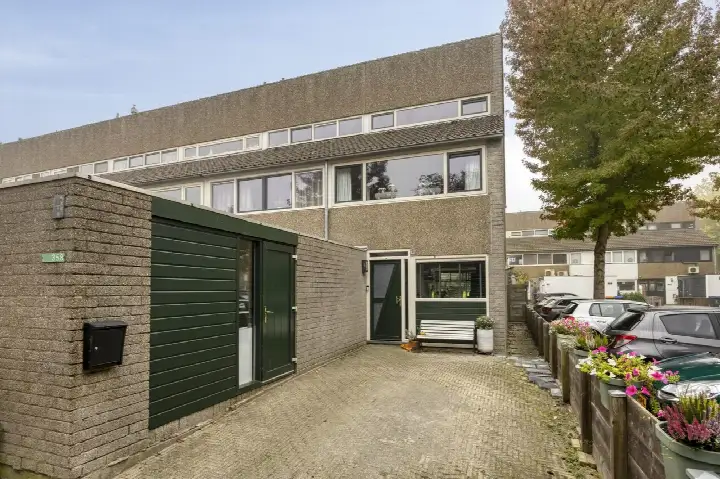
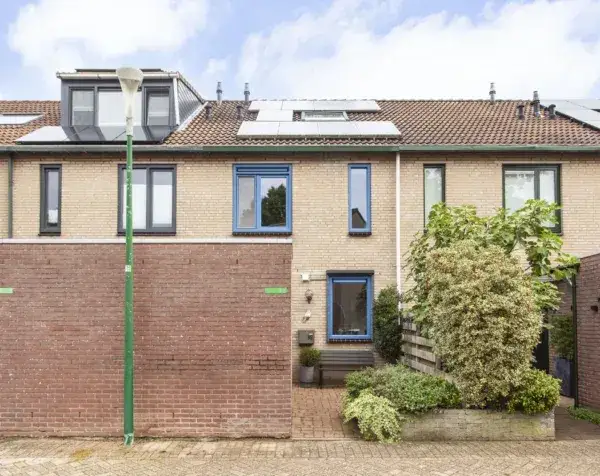
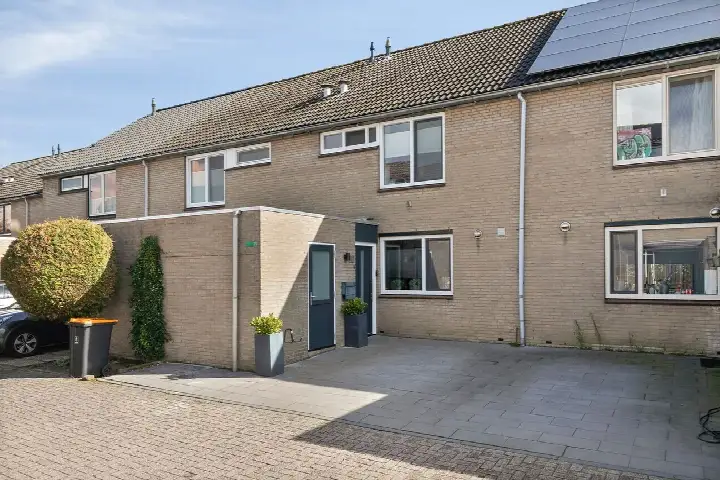
Auto-translated to English by AIThe housing stock is mainly post-war — 91% was built between 1945 and 1990. In addition, the most common type is terraced houses (46%).
Over the past year a home for sale in Maarssenbroek was listed for an average of €466,015 (€4,458 per m²). That is 12% below the Dutch national average.
A rental home in Maarssenbroek cost an average of €1,872 per month (€18 per m²). That is 13% below the national average.
Residents give Maarssenbroek a 7.0 out of 10 based on 9 reviews. The strongest score is for accessibility (7.9), the weakest for cleanliness (6.0).
Wijk Maarssenbroek has 23,635 residents. Many families: 38% of the households have children.
The housing supply in Maarssenbroek is remarkably efficient: 55% has an A, A+ or B label. The average natural gas consumption per household is 770 m³ per year.
From Maarssenbroek you can on average reach a supermarket at 1.2 km, a GP at 0.9 km, a railway station at 1.9 km, a primary school at 1.0 km (as the crow flies, source: CBS).
Right now you will find 86 homes for sale and 10 homes for rent in Maarssenbroek.