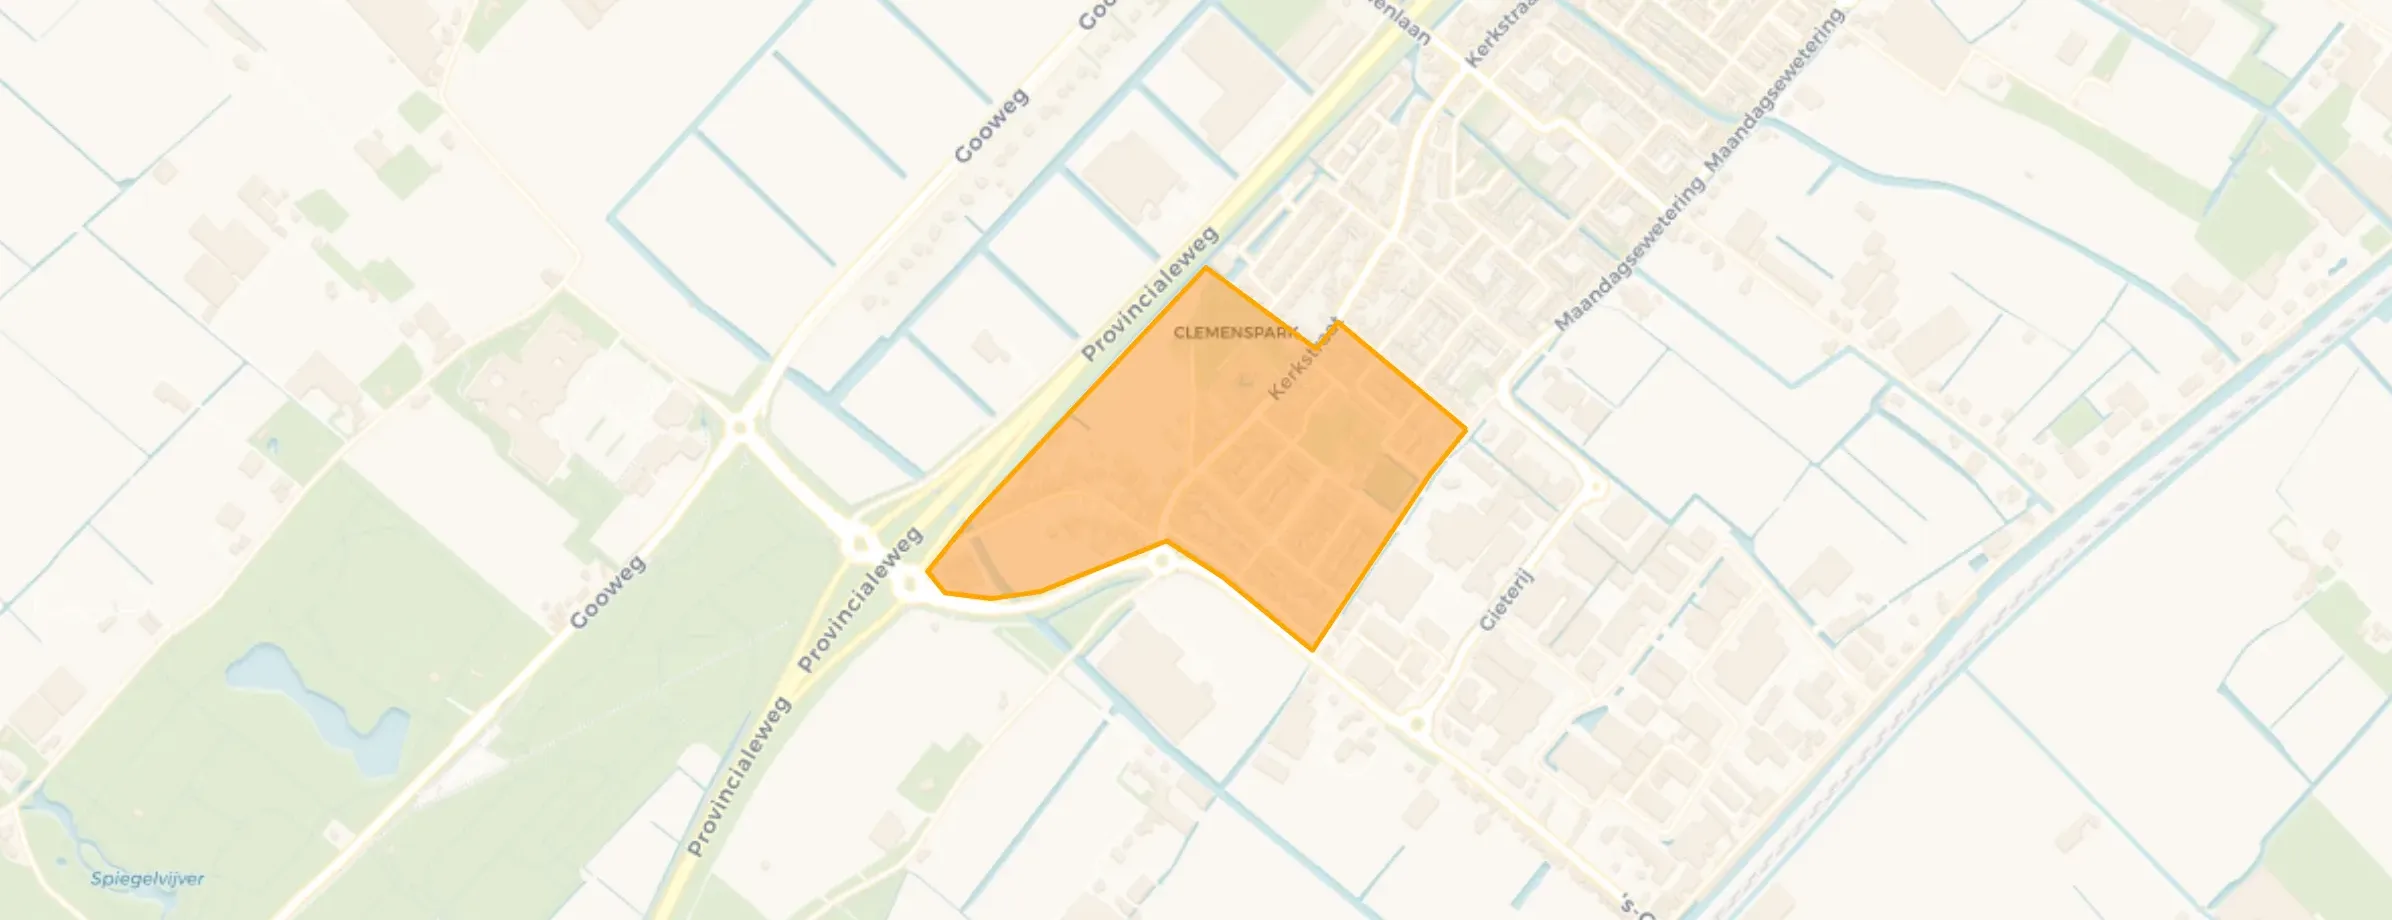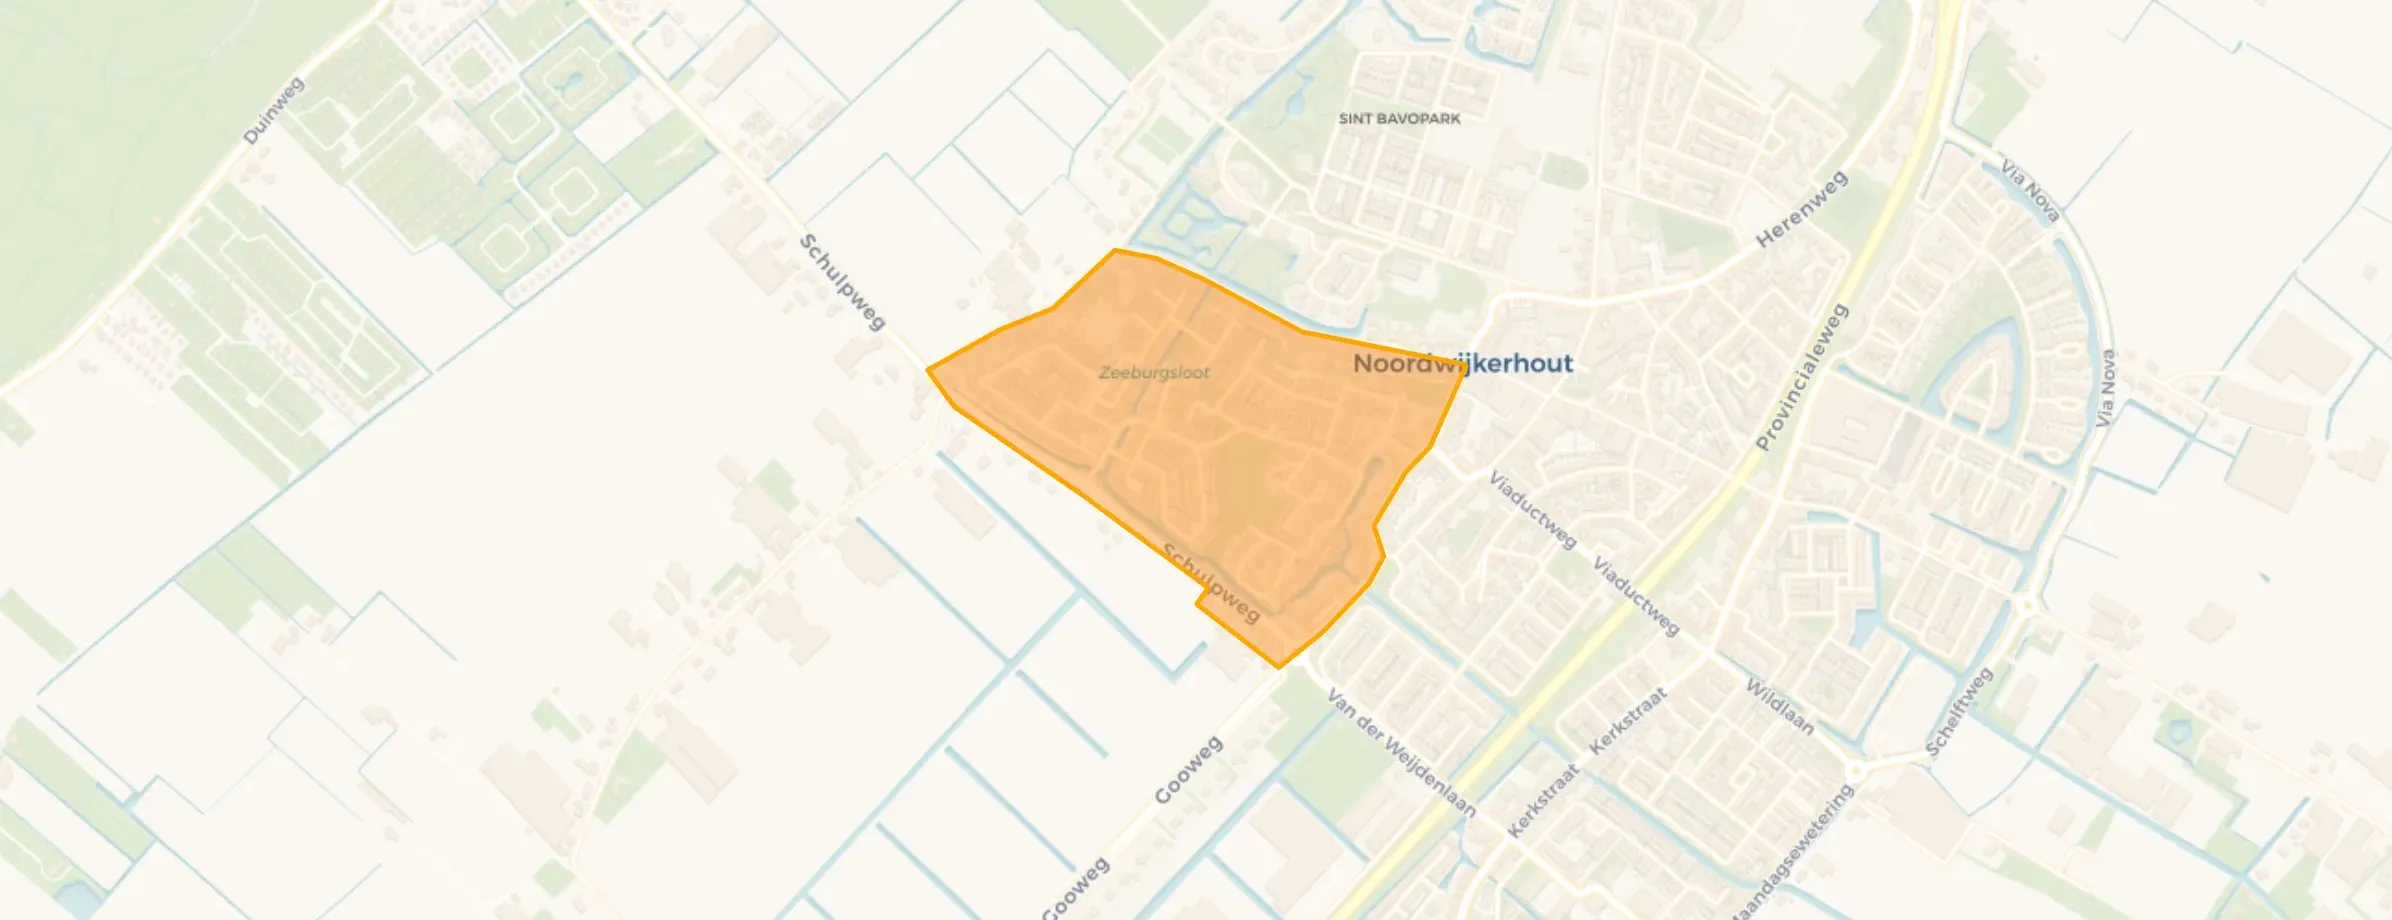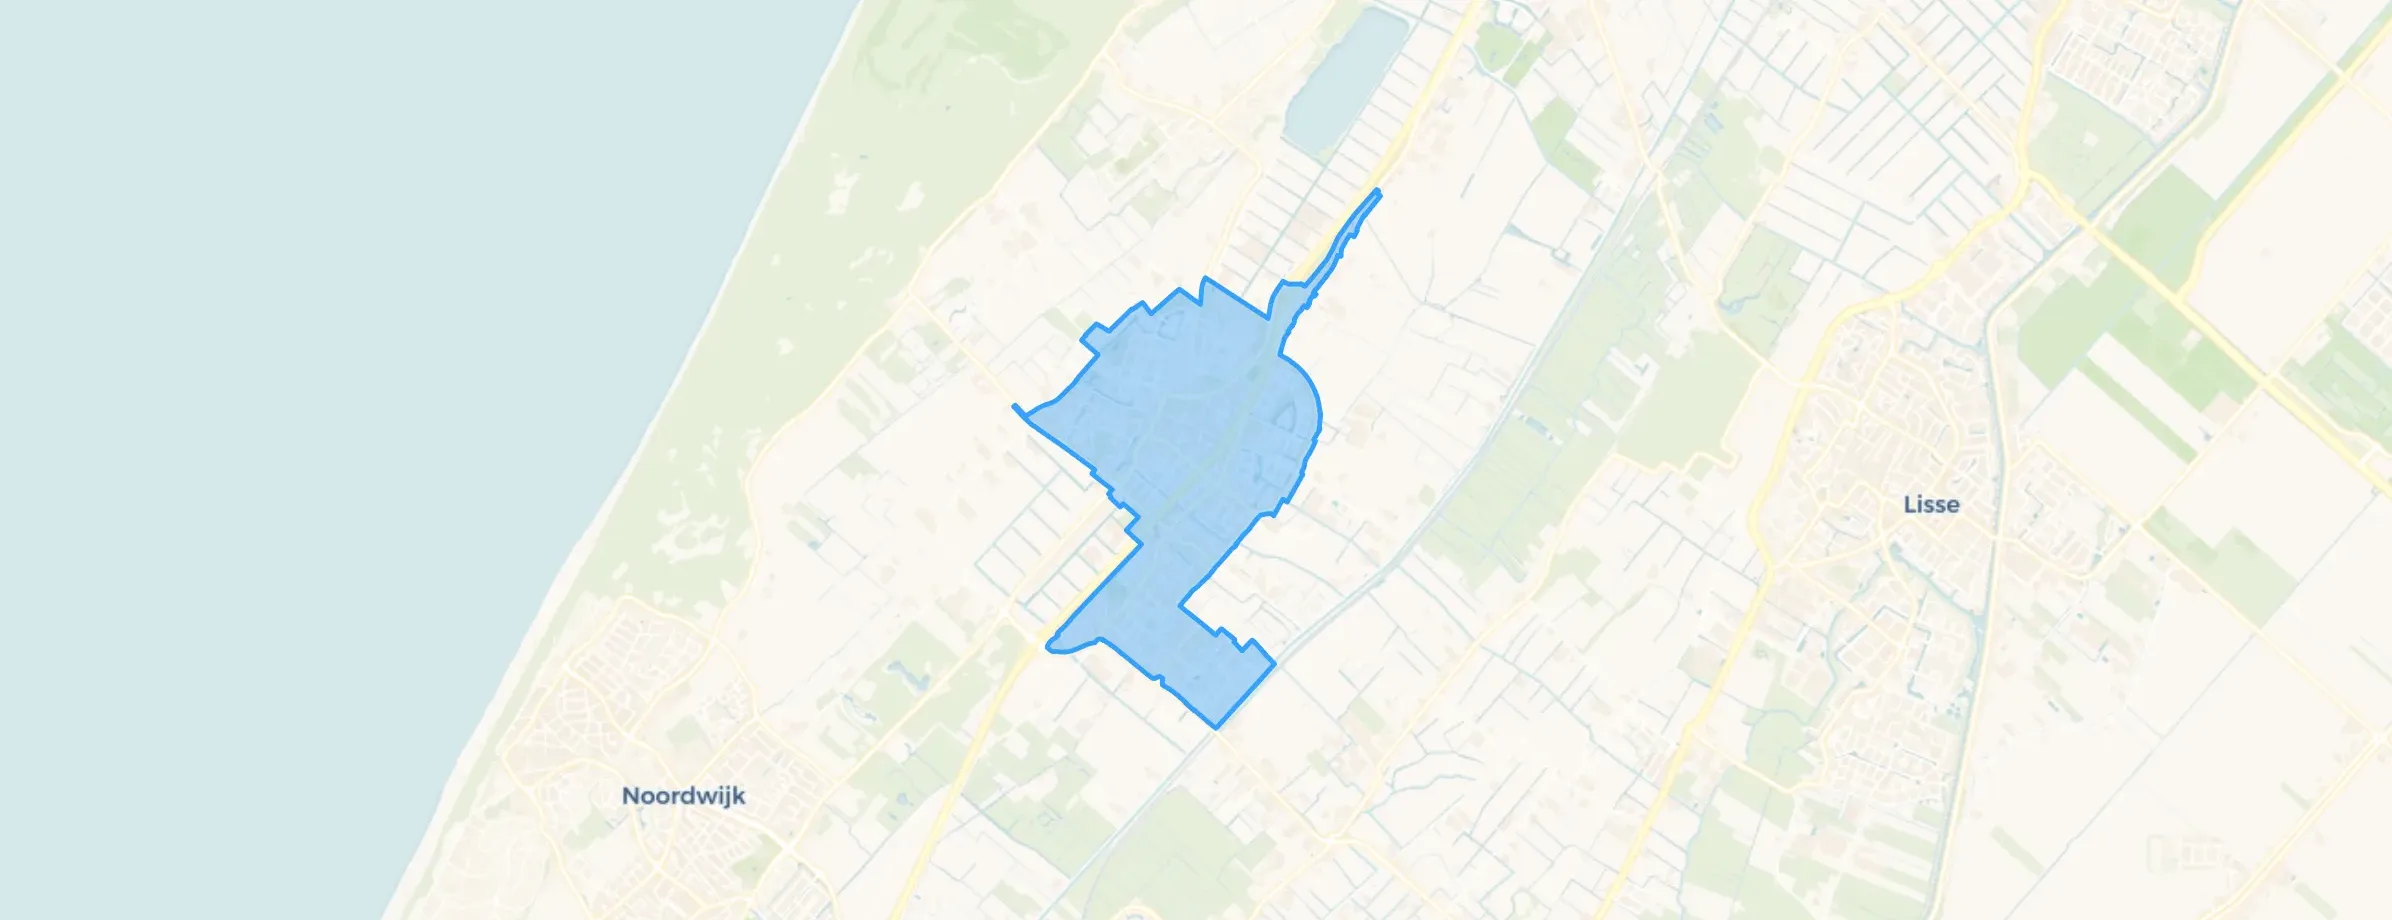
District in Noordwijk
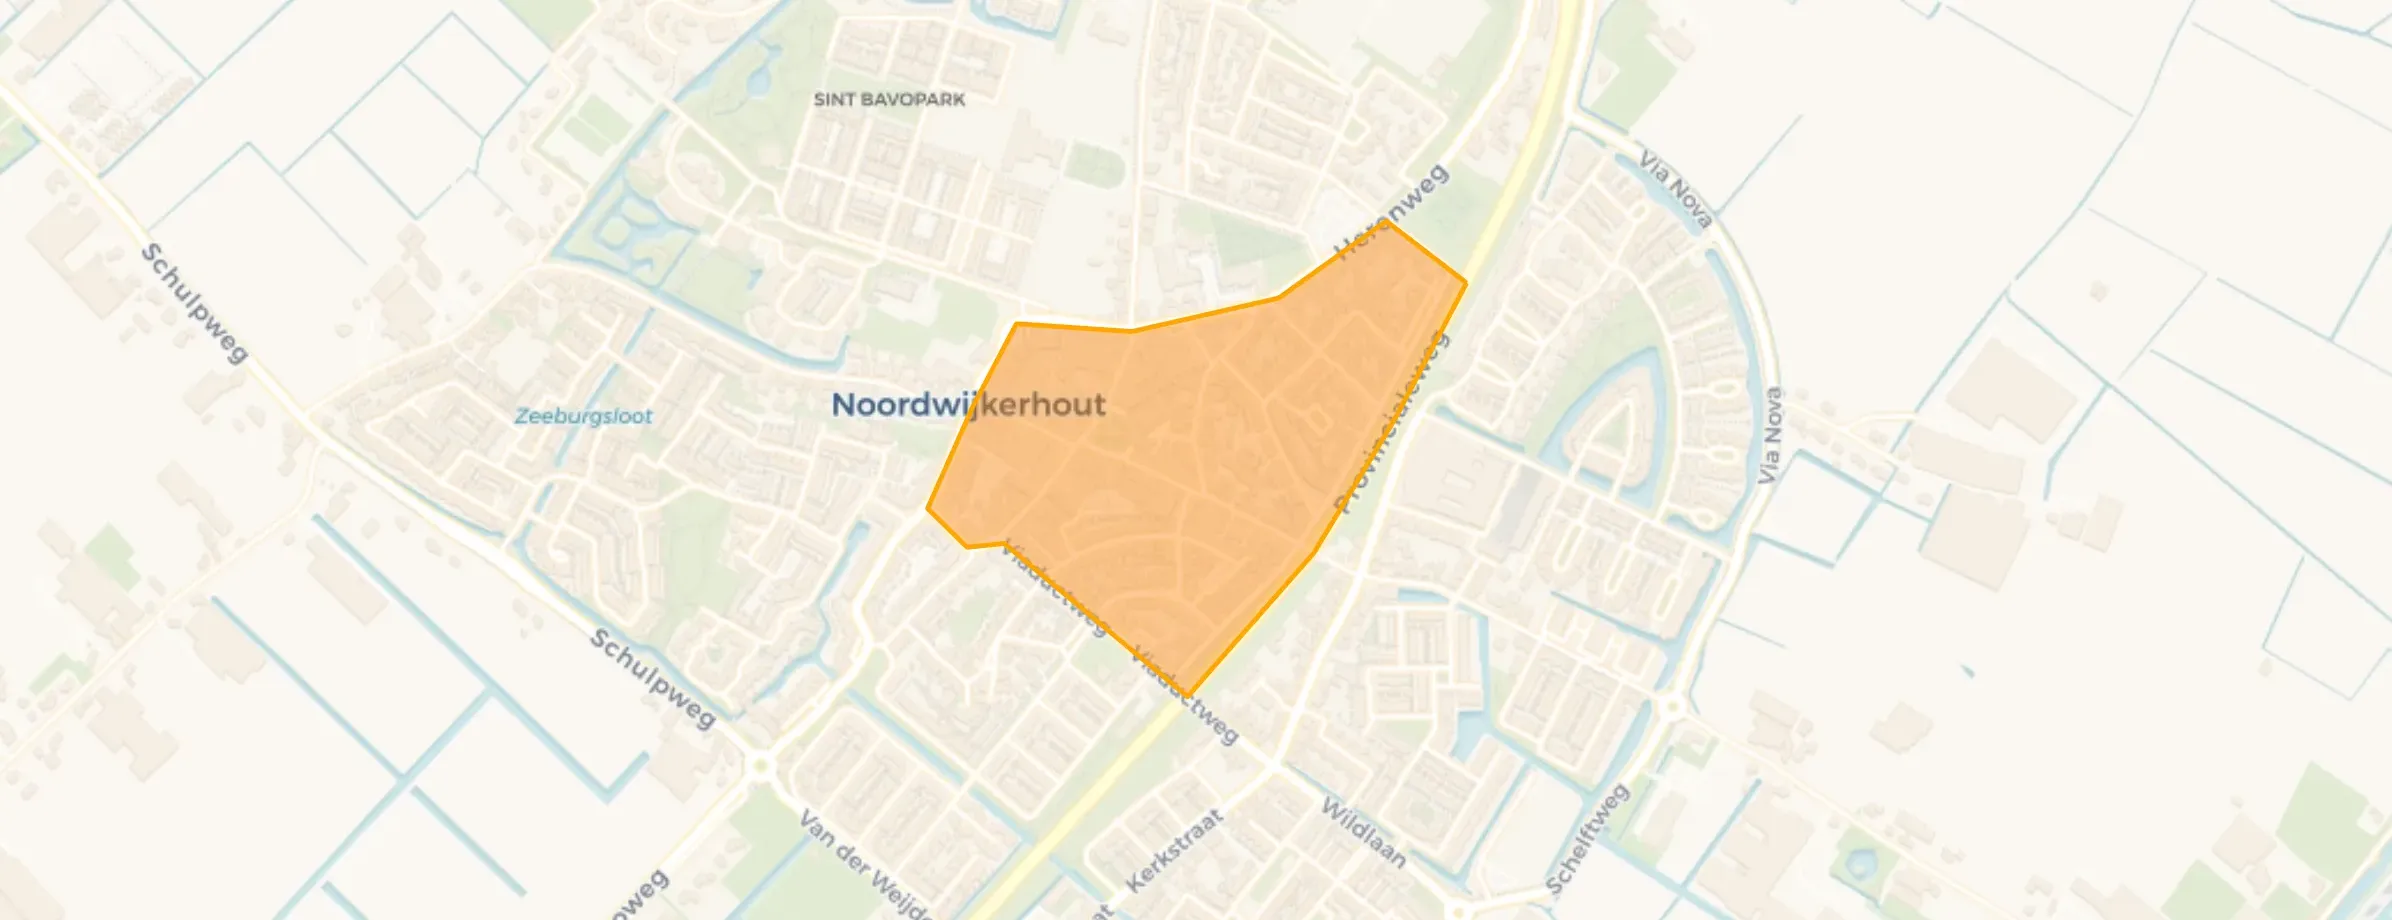
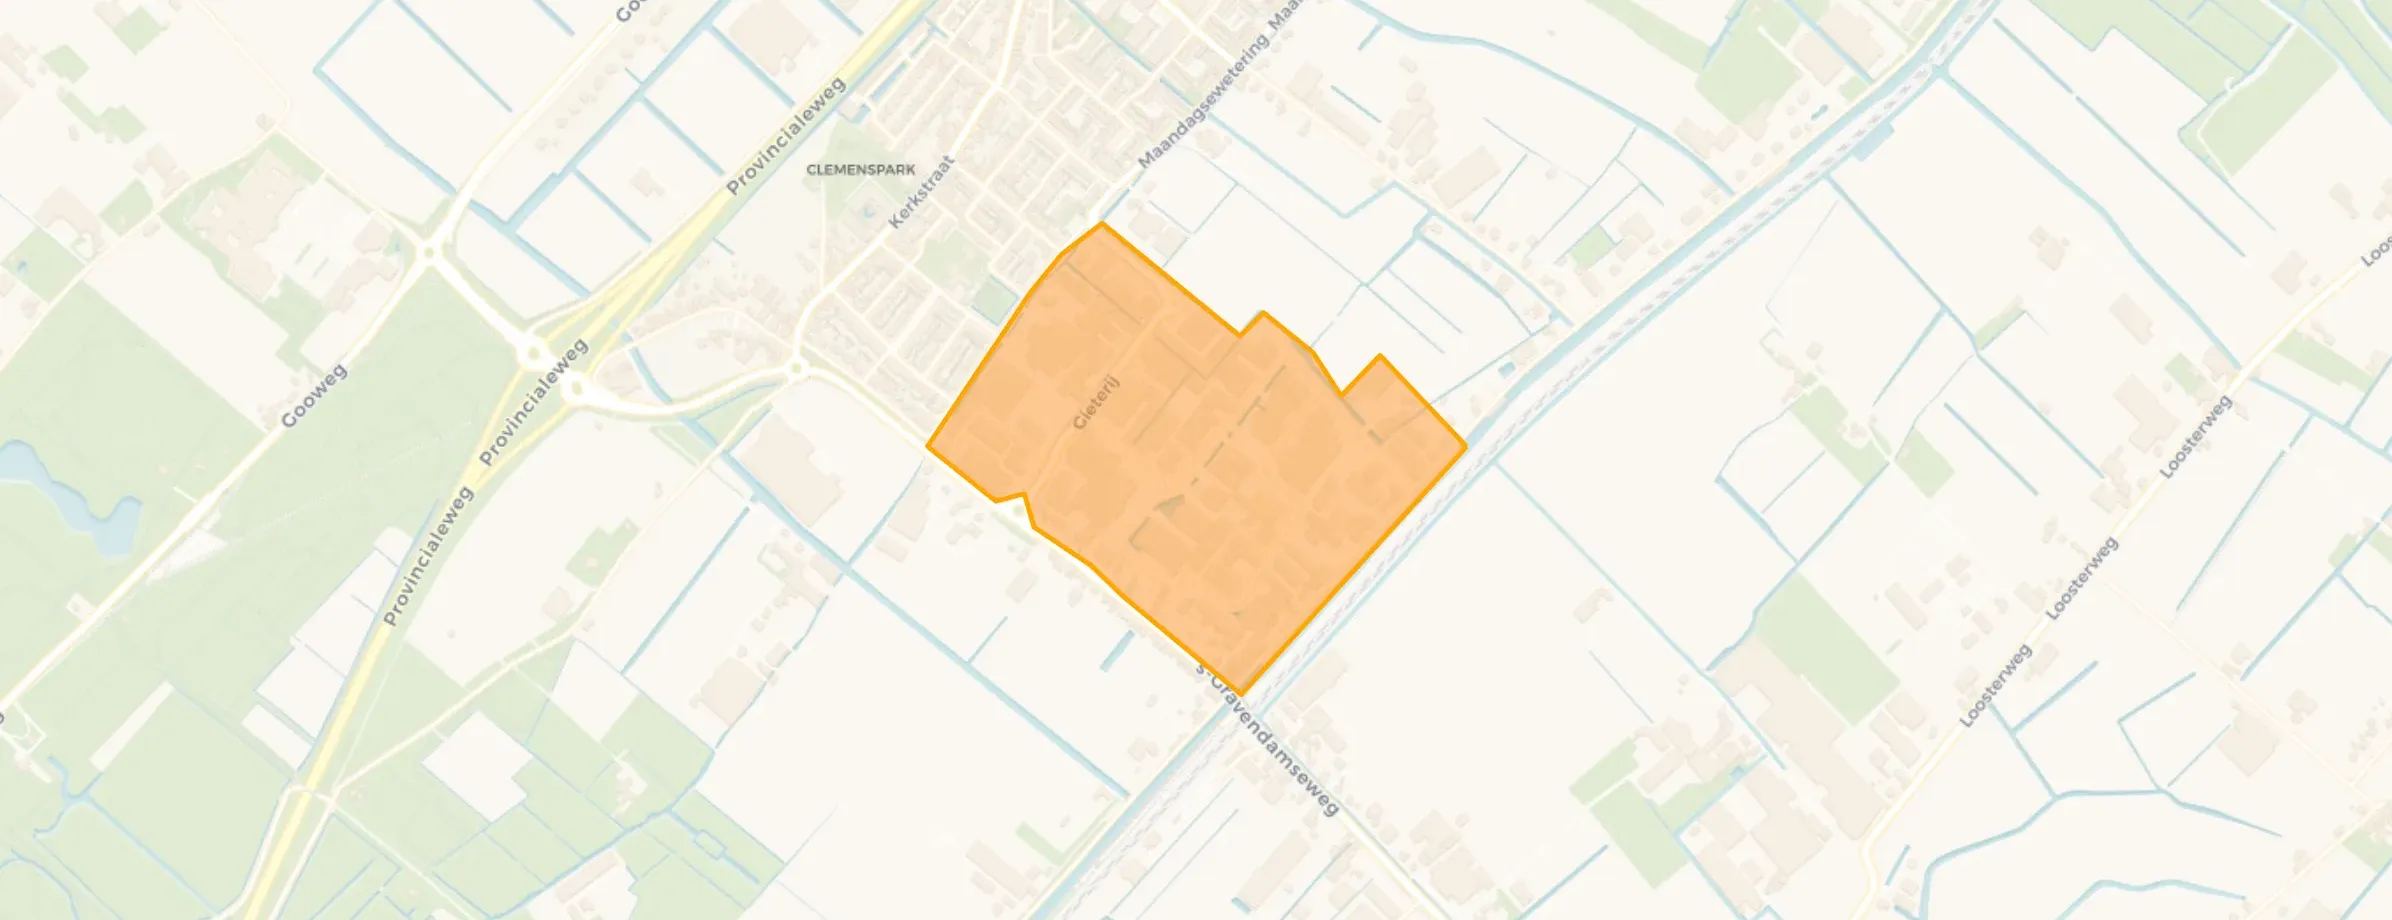
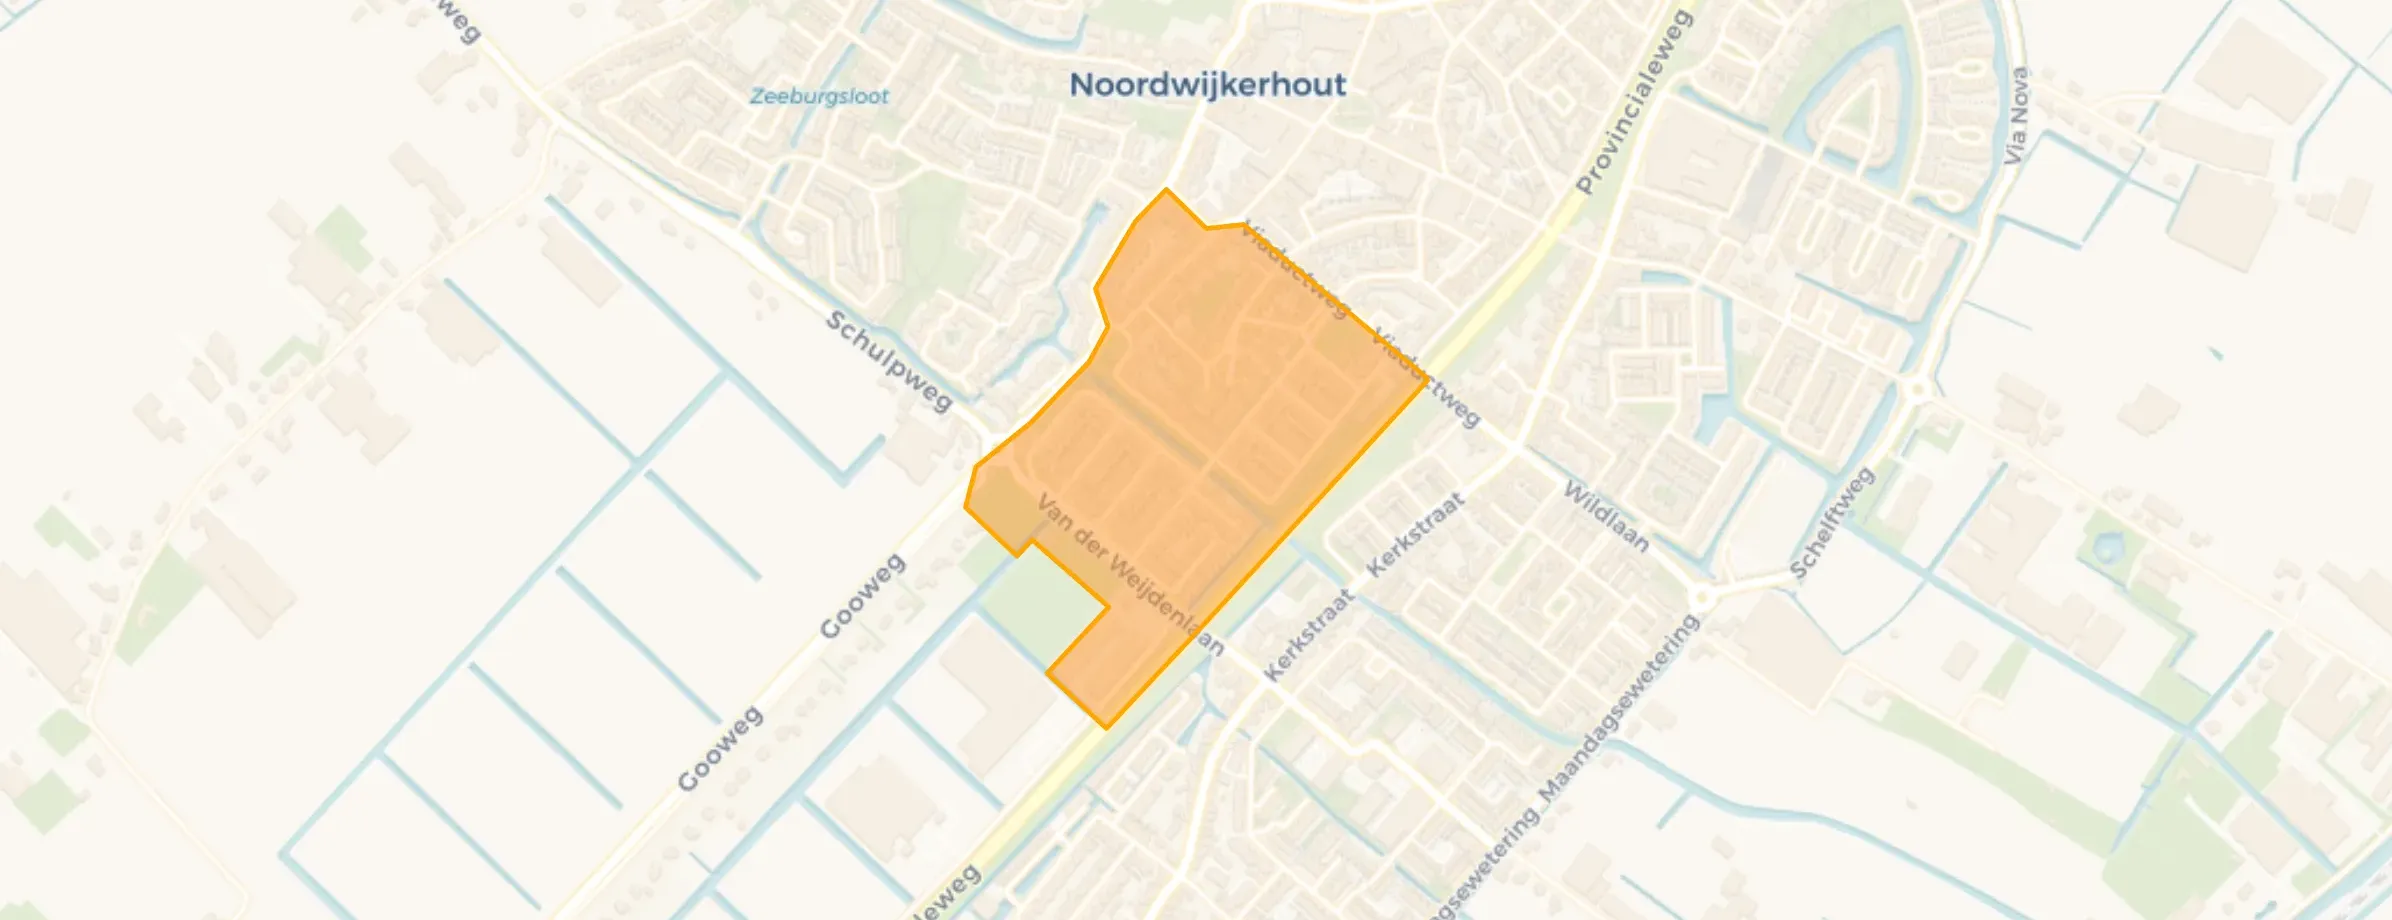
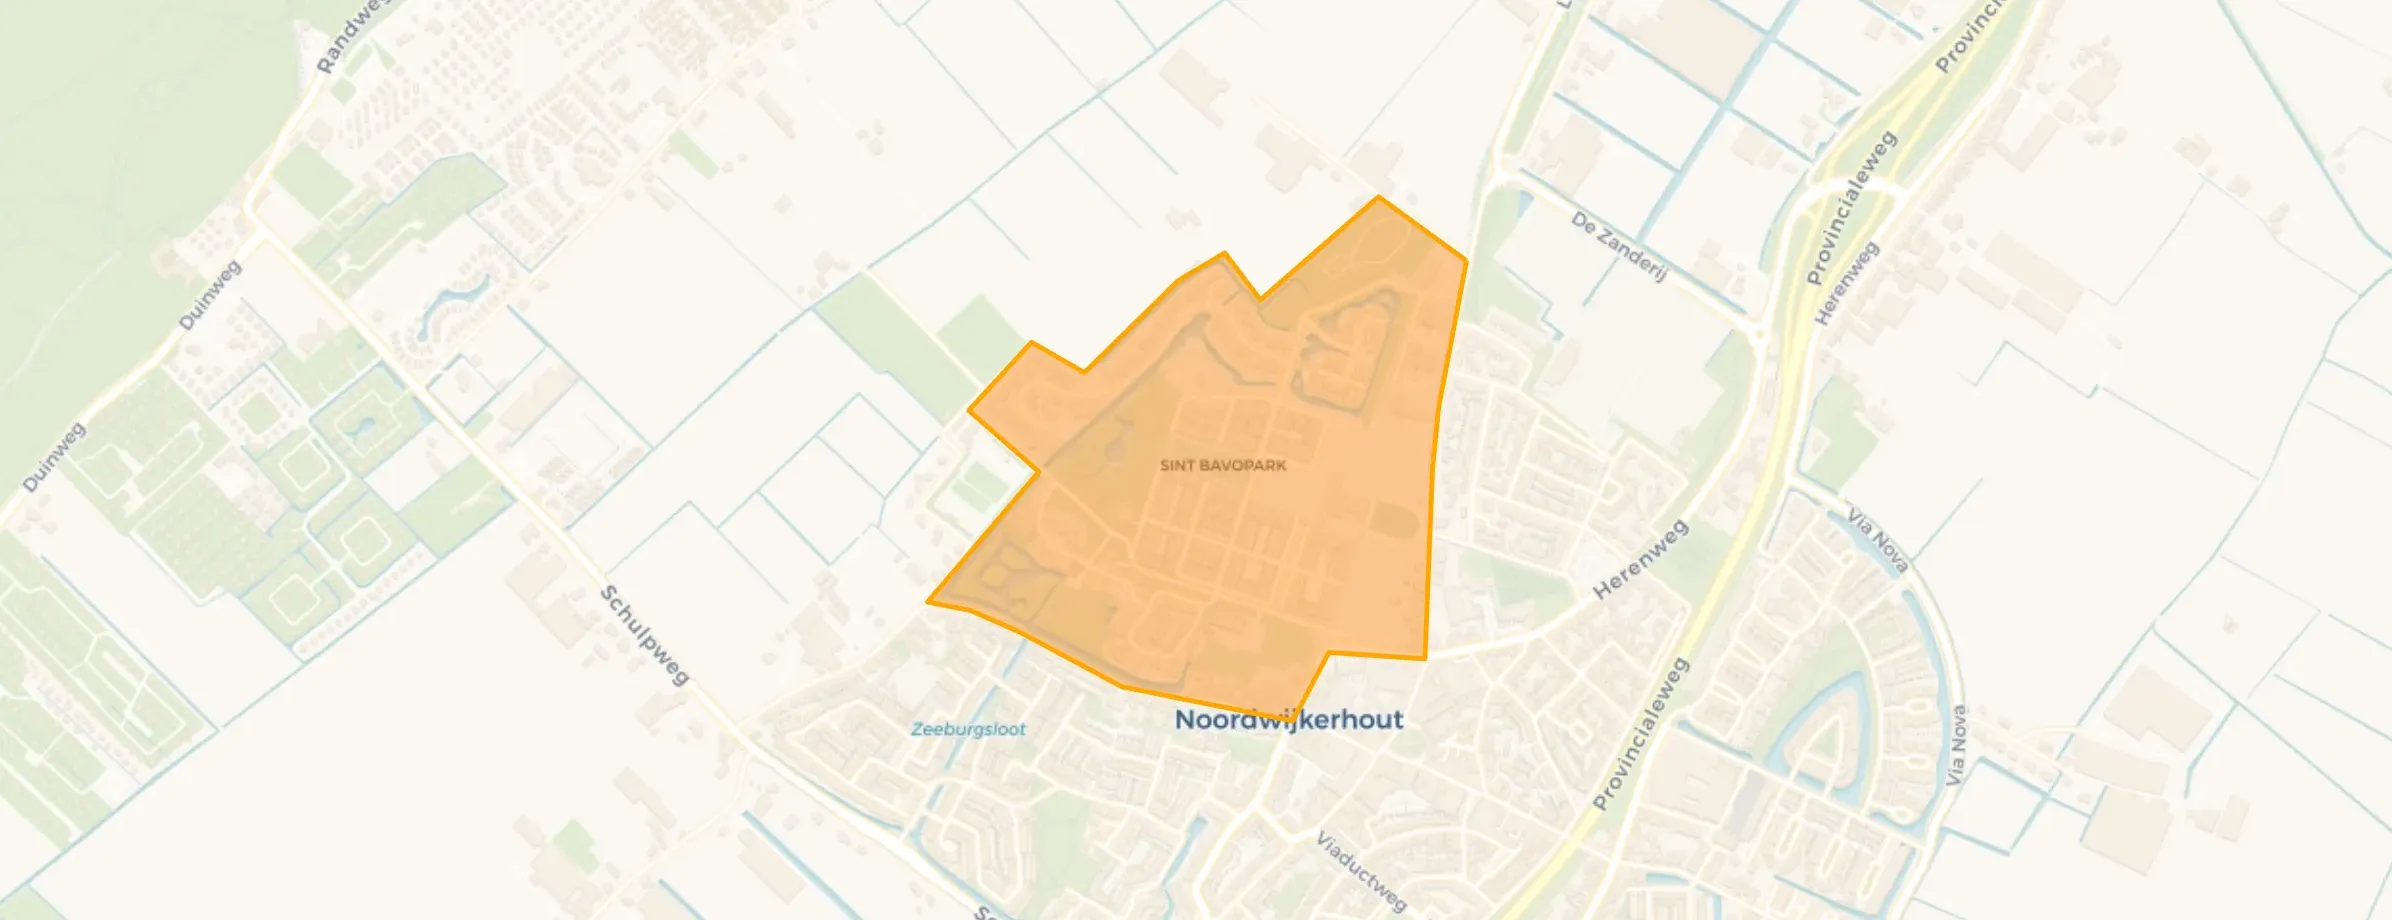
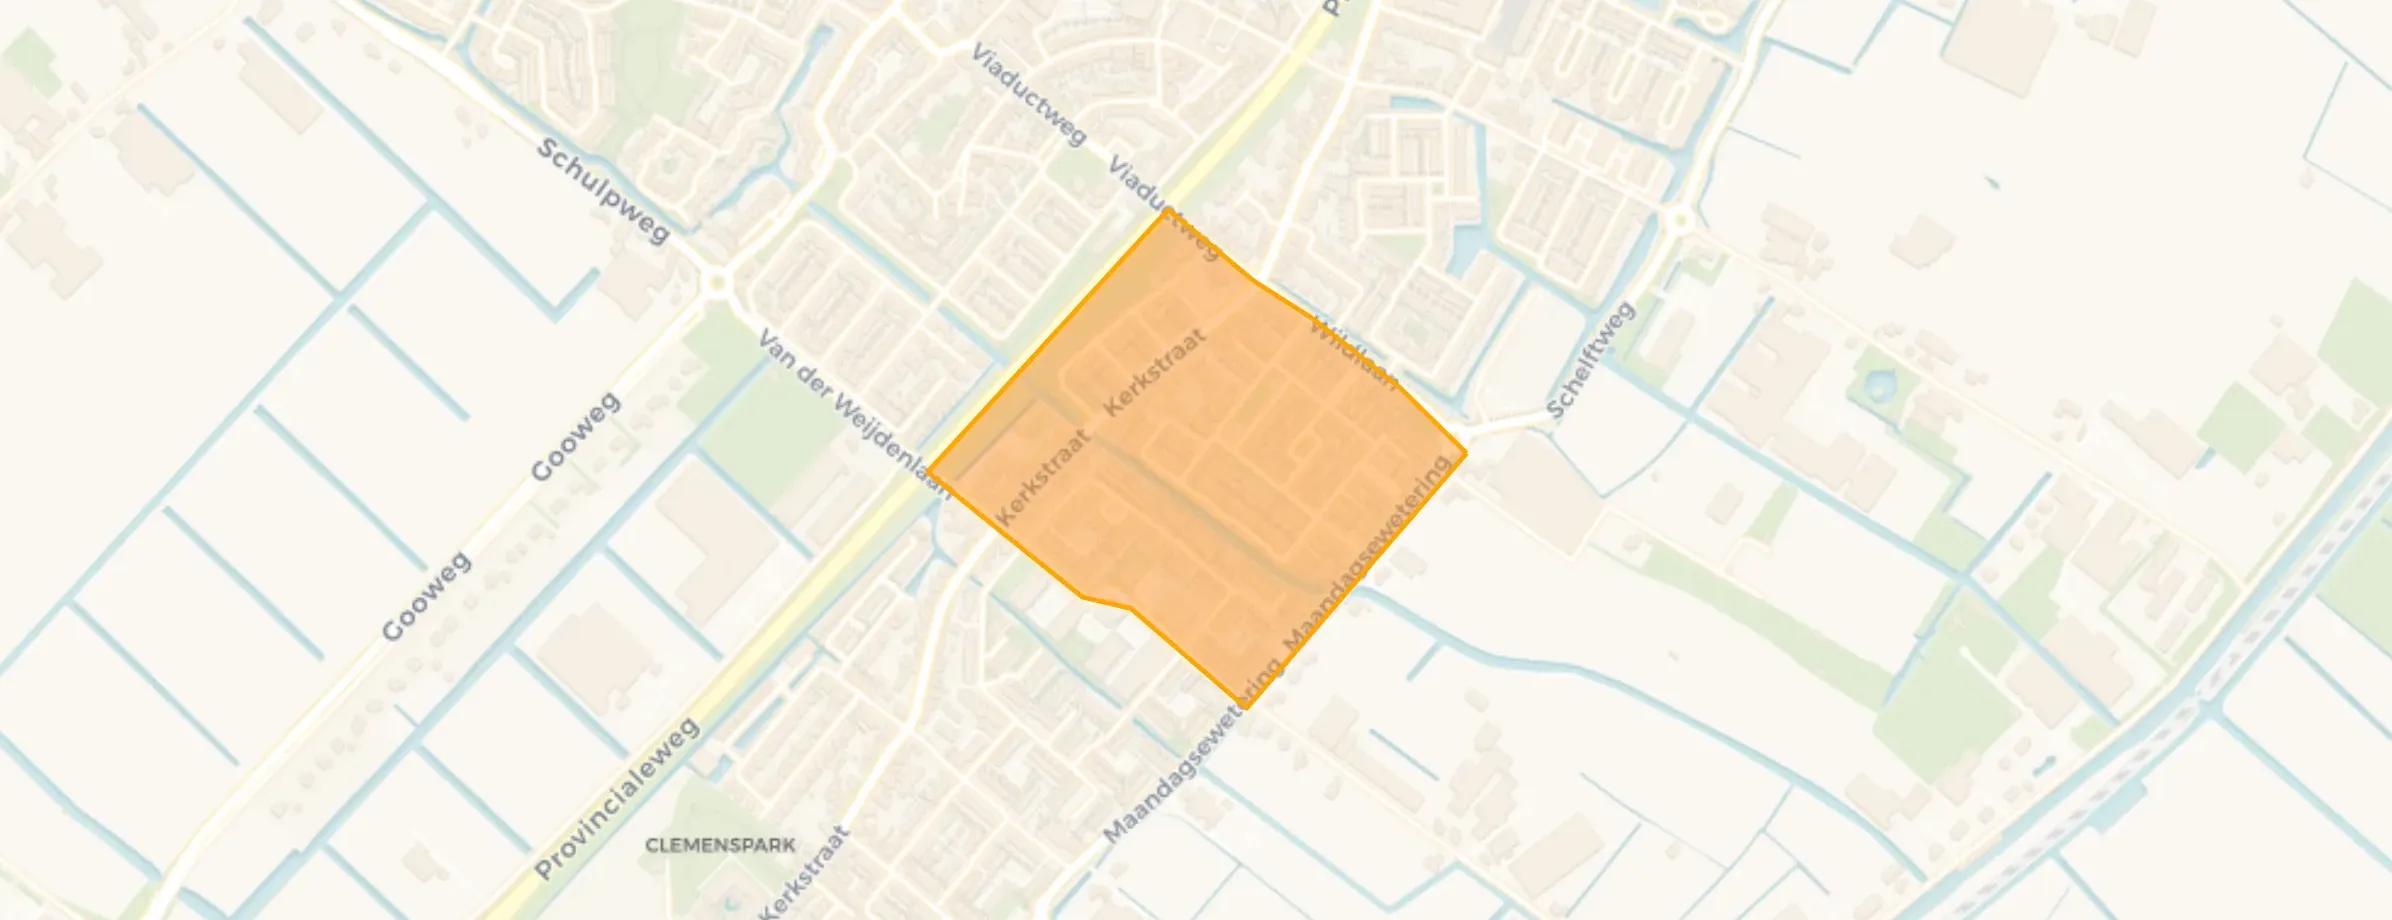
Noordwijkerhout is located in the province of Zuid-Holland, in the municipality of Noordwijk The district has a total area of 287 hectares, of which 282 hectares are land and 5 hectares are water. The district is coded as WK057503. The postcode area is 2211AA-2212WB.
Noordwijkerhout has 13.845 residents. Of these, 49,9% are men and 50,0% are women. Most residents are 25 to 45 years (25,8%). The other age groups are 25,7% for '45 to 65 years', 22,4% for '65 years or older', 15,7% for '0 to 15 years' and 10,3% for '15 to 25 years'. Of the residents, 48,1% is unmarried, 38,9% is married, 8,1% is divorced and 4,9% is widowed. 11.095 residents originate from the Netherlands, 1.530 come from Europe and 1.220 come from countries outside Europe.
There are 6.200 households in Noordwijkerhout. 36,1% of these are single-person households, 29,5% households without children and 34,4% households with children. The average household size is 2,2 persons. The national average is 2,1 persons.
In Noordwijkerhout there are 11.100 income recipients. The average income per income recipient is €41.900, which is €300 (1%) lower than the national average of €42.200. Per resident, the average income is €35.000, which is €100 (0%) higher than the national average of €34.900. Most residents of Noordwijkerhout are educated to an intermediate level. 43,2% have an intermediate education (HAVO, VWO or MBO 2-4), 29,5% have a university or higher professional education (HBO/WO) and 27,3% have a lower education (VMBO or MBO 1).
Of the 13.845 residents, around 76% are in paid employment, which amounts to 10.522 people. This is 4% higher than the national average of 72%. The majority of workers are in salaried employment (83%), while 17% are self-employed. In Noordwijkerhout, 26% of residents receive a benefit. The largest group is those receiving a state pension (AOW). 2.800 people receive this benefit.
In Noordwijkerhout there are 6.159 homes with an average assessed value (WOZ) of €438.000. Of these, around 97% are occupied and 3% unoccupied. Most homes are owner-occupied. This amounts to 40% rental homes and 60% owner-occupied homes. Of the homes, 61% privately owned, 29% owned by housing associations and 10% owned by other landlords. The most common construction periods in Noordwijkerhout are 1950-1970 (16%) and 1980-1990 (14%).
There are currently no homes for sale in Noordwijkerhout. The most recently listed home is Wildlaan 1 by Heemskerk Makelaardij-Hypotheken-Verzekeringen op Funda. No homes were sold in Noordwijkerhout over the past year.
There are currently no homes for rent in Noordwijkerhout. The most recent home is Sint Antoniusstraat 10A15, offered by www.hureninhollandrijnland.nl. No homes were let in Noordwijkerhout over the past year.
No recent rental data available for Noordwijkerhout.
In Noordwijkerhout there are 4.694 addresses with a registered energy label. The most common labels are A (35%), C (19%) and B (14%). On average, an address in Noordwijkerhout uses 2.530 kWh of electricity per year. This is 1% below the national average of 2.550 kWh. With an annual consumption of 740 m³ per address, natural gas consumption is 8% below the national average of 800 m³.
Clean, beautiful and cosy, close to the village, supermarkets and playgrounds! Great for parents and children. There is plenty to do and everything is within walking distance! Even the bus stop is very close! Just perfect!
Auto-translated to English by AINoordwijkerhout is a safe and quiet village with a strong community. The surroundings are clean and green, with good amenities such as shops and schools. Moreover, you can be in the dunes and at the seaside within a short time, ideal for relaxation and nature. A lovely place to live where you quickly feel at home!!!
Auto-translated to English by AII think if you live in a house where you have 8 dogs and now a nest of puppies, and you also occupy 5 parking spaces, 2 of which you don't even use, I find that quite antisocial. And it's just tolerated. The housing association does nothing about it. If you email them, you get no reply, even though they claim to take action. Also, I think people drive way too fast on the Viaductweg. I've reported this before, but they do nothing about it either.
Auto-translated to English by AIAlways people who want to help you
Auto-translated to English by AIMost people know each other, greet each other, social control neighbourhood app a cosy and lively neighbourhood green through parks trees playground 3 streets nice gardens
Auto-translated to English by AIOver the past year a home for sale in Noordwijkerhout was listed for an average of €565,234 (€5,046 per m²). Last quarter prices fell by 15%.
A rental home in Noordwijkerhout cost an average of €1,856 per month (€19 per m²).
Residents give Noordwijkerhout a 8.6 out of 10 based on 5 reviews. The strongest score is for education (9.0), the weakest for nature and greenery (7.8).
The housing supply in Noordwijkerhout is remarkably efficient: 58% has an A, A+ or B label. The average natural gas consumption per household is 740 m³ per year.
From Noordwijkerhout you can on average reach a supermarket at 0.6 km, a GP at 0.8 km, a railway station at 6.0 km, a primary school at 0.7 km (as the crow flies, source: CBS).
Right now you will find 56 homes for sale and 3 homes for rent in Noordwijkerhout.