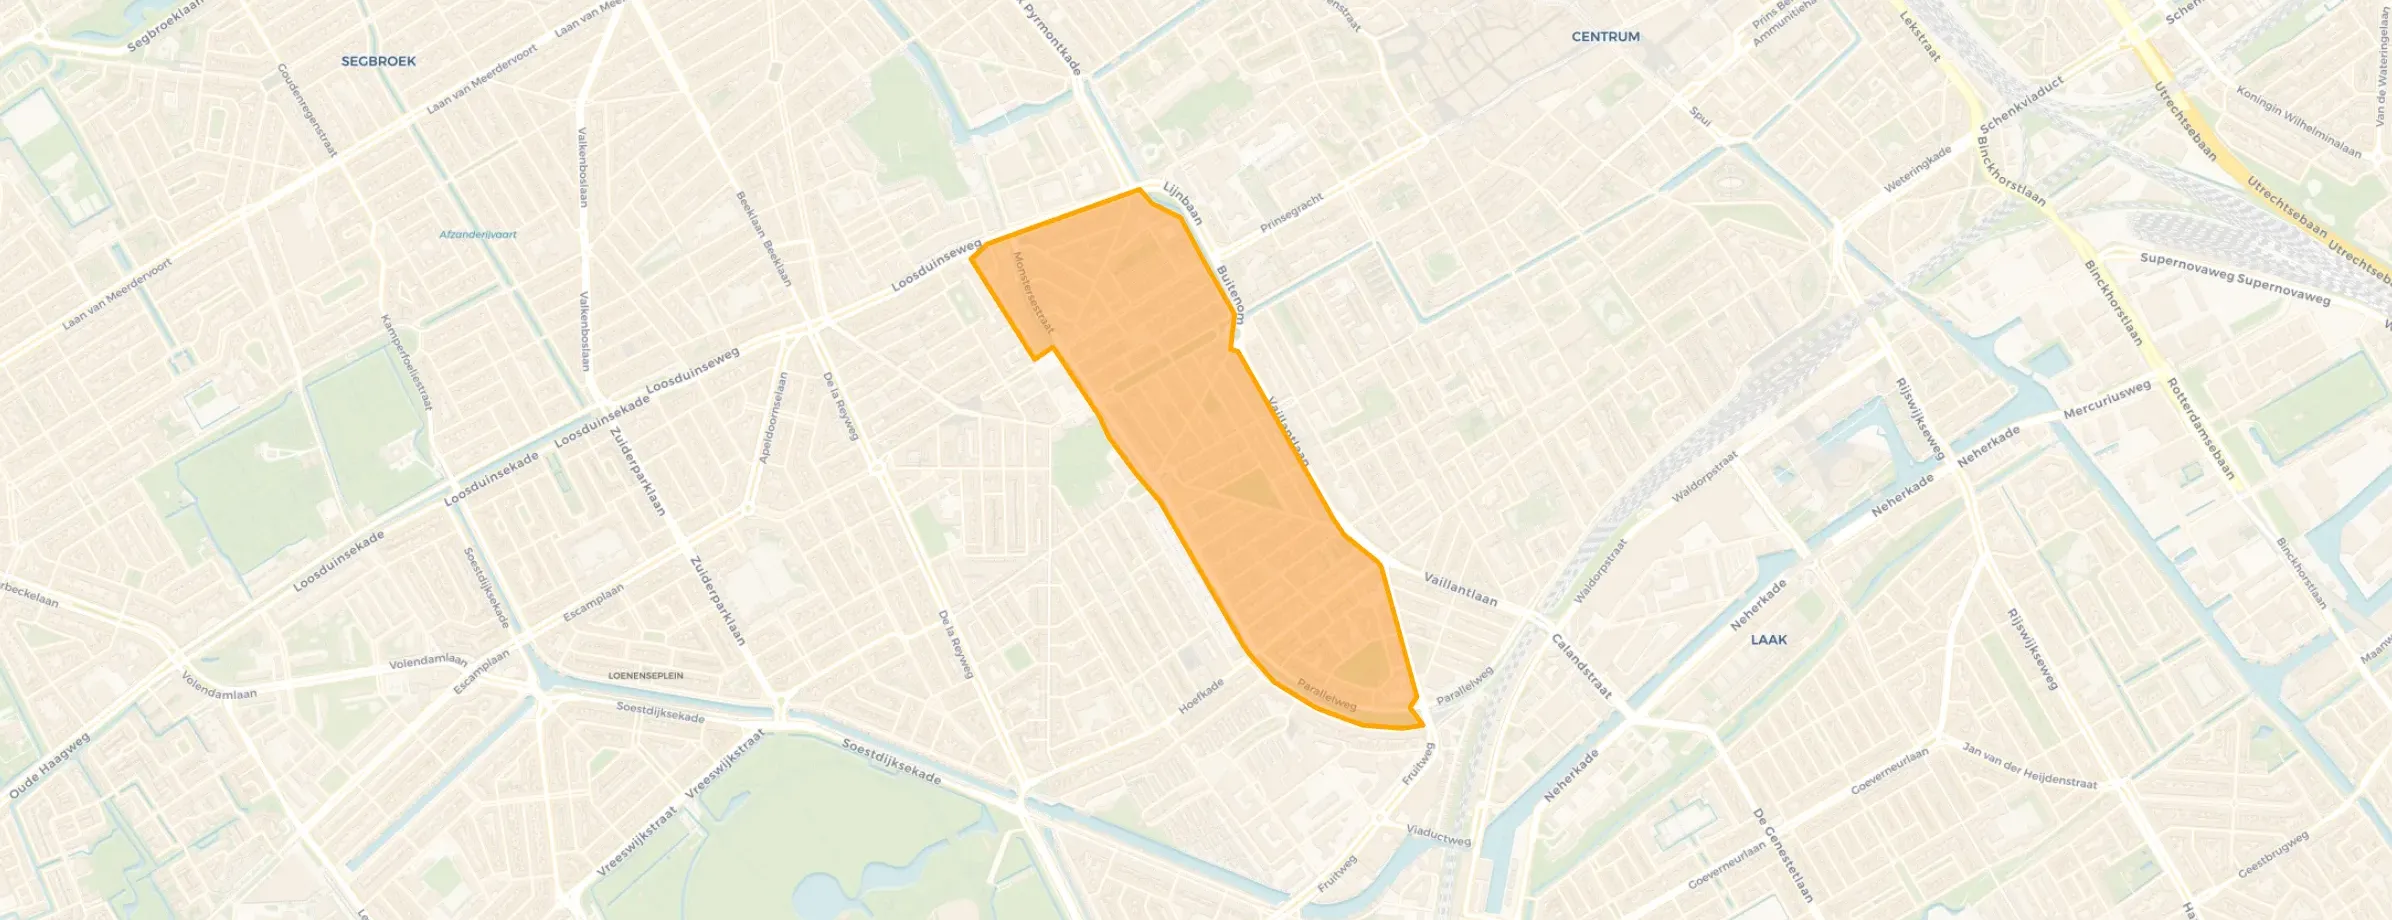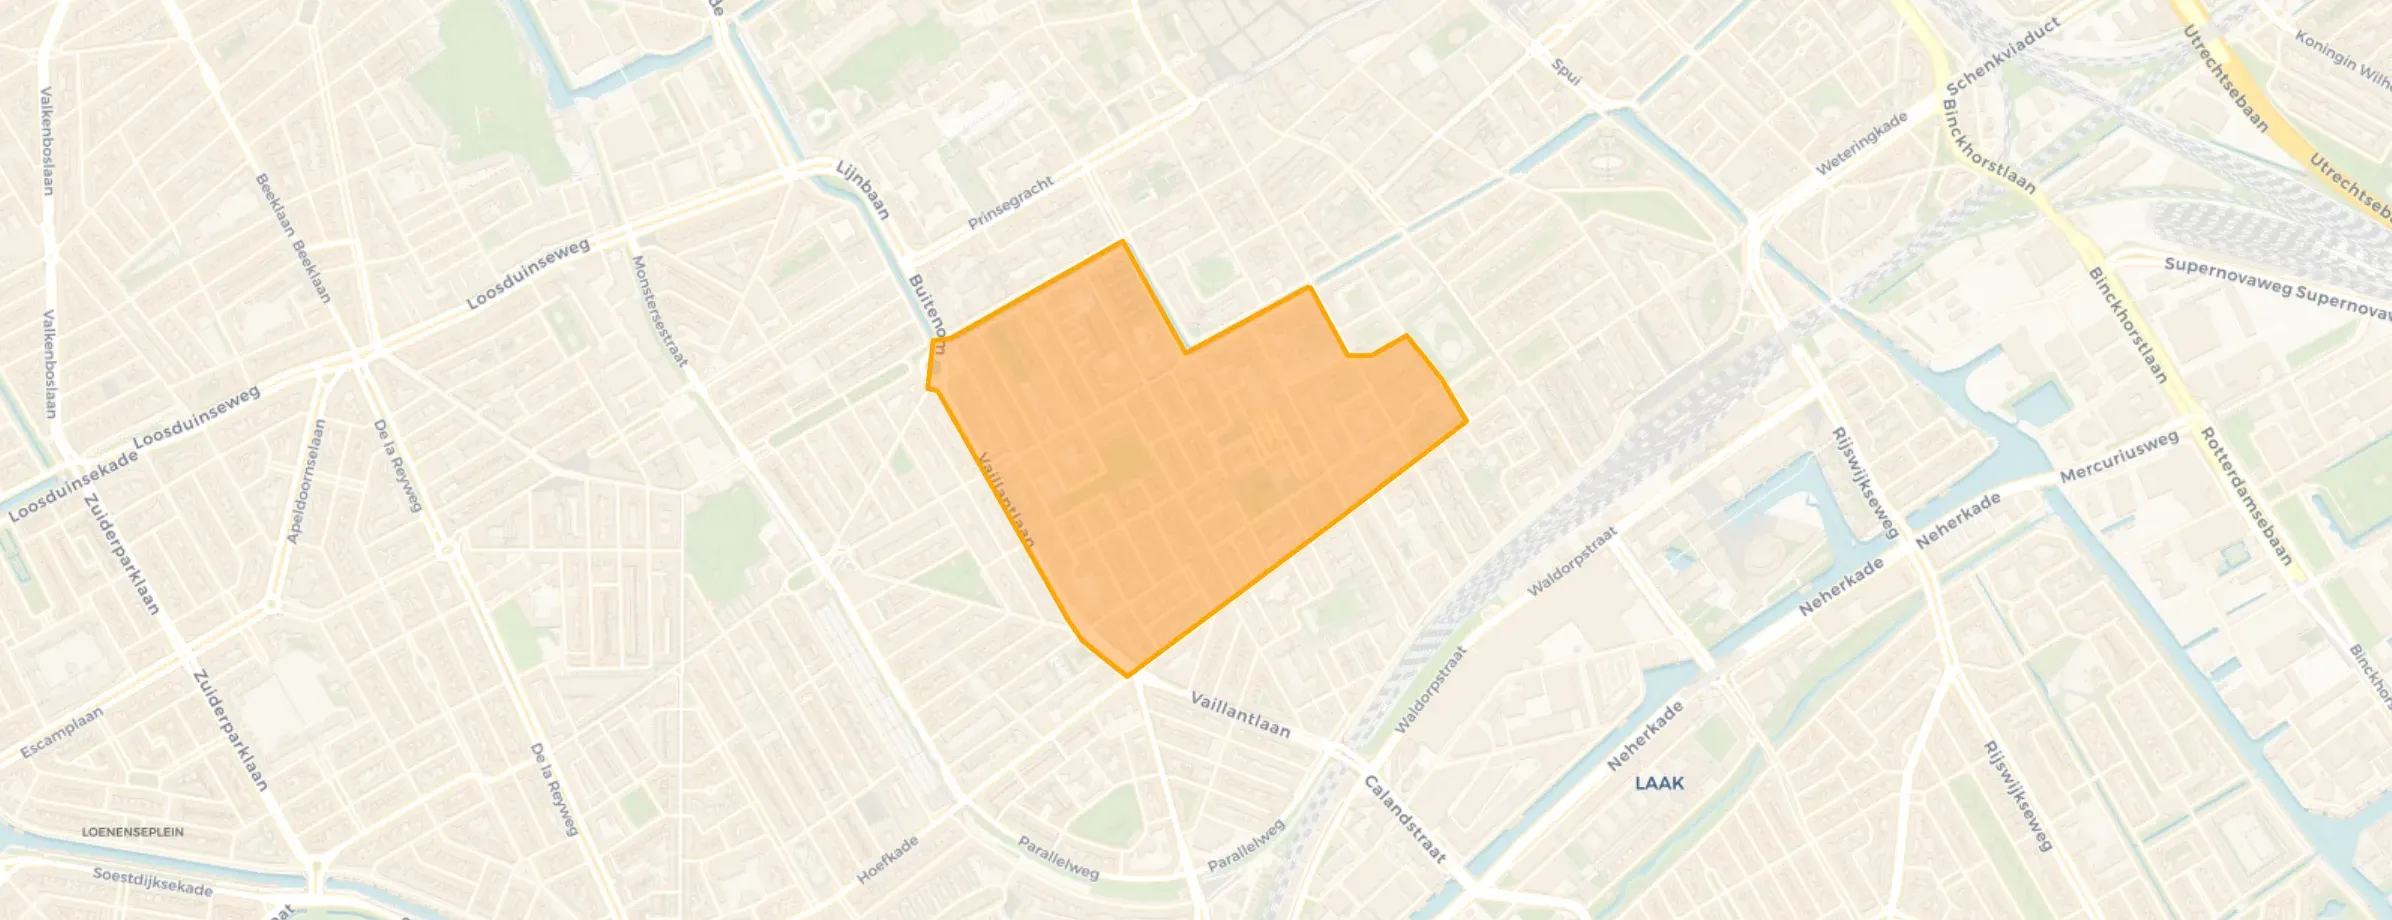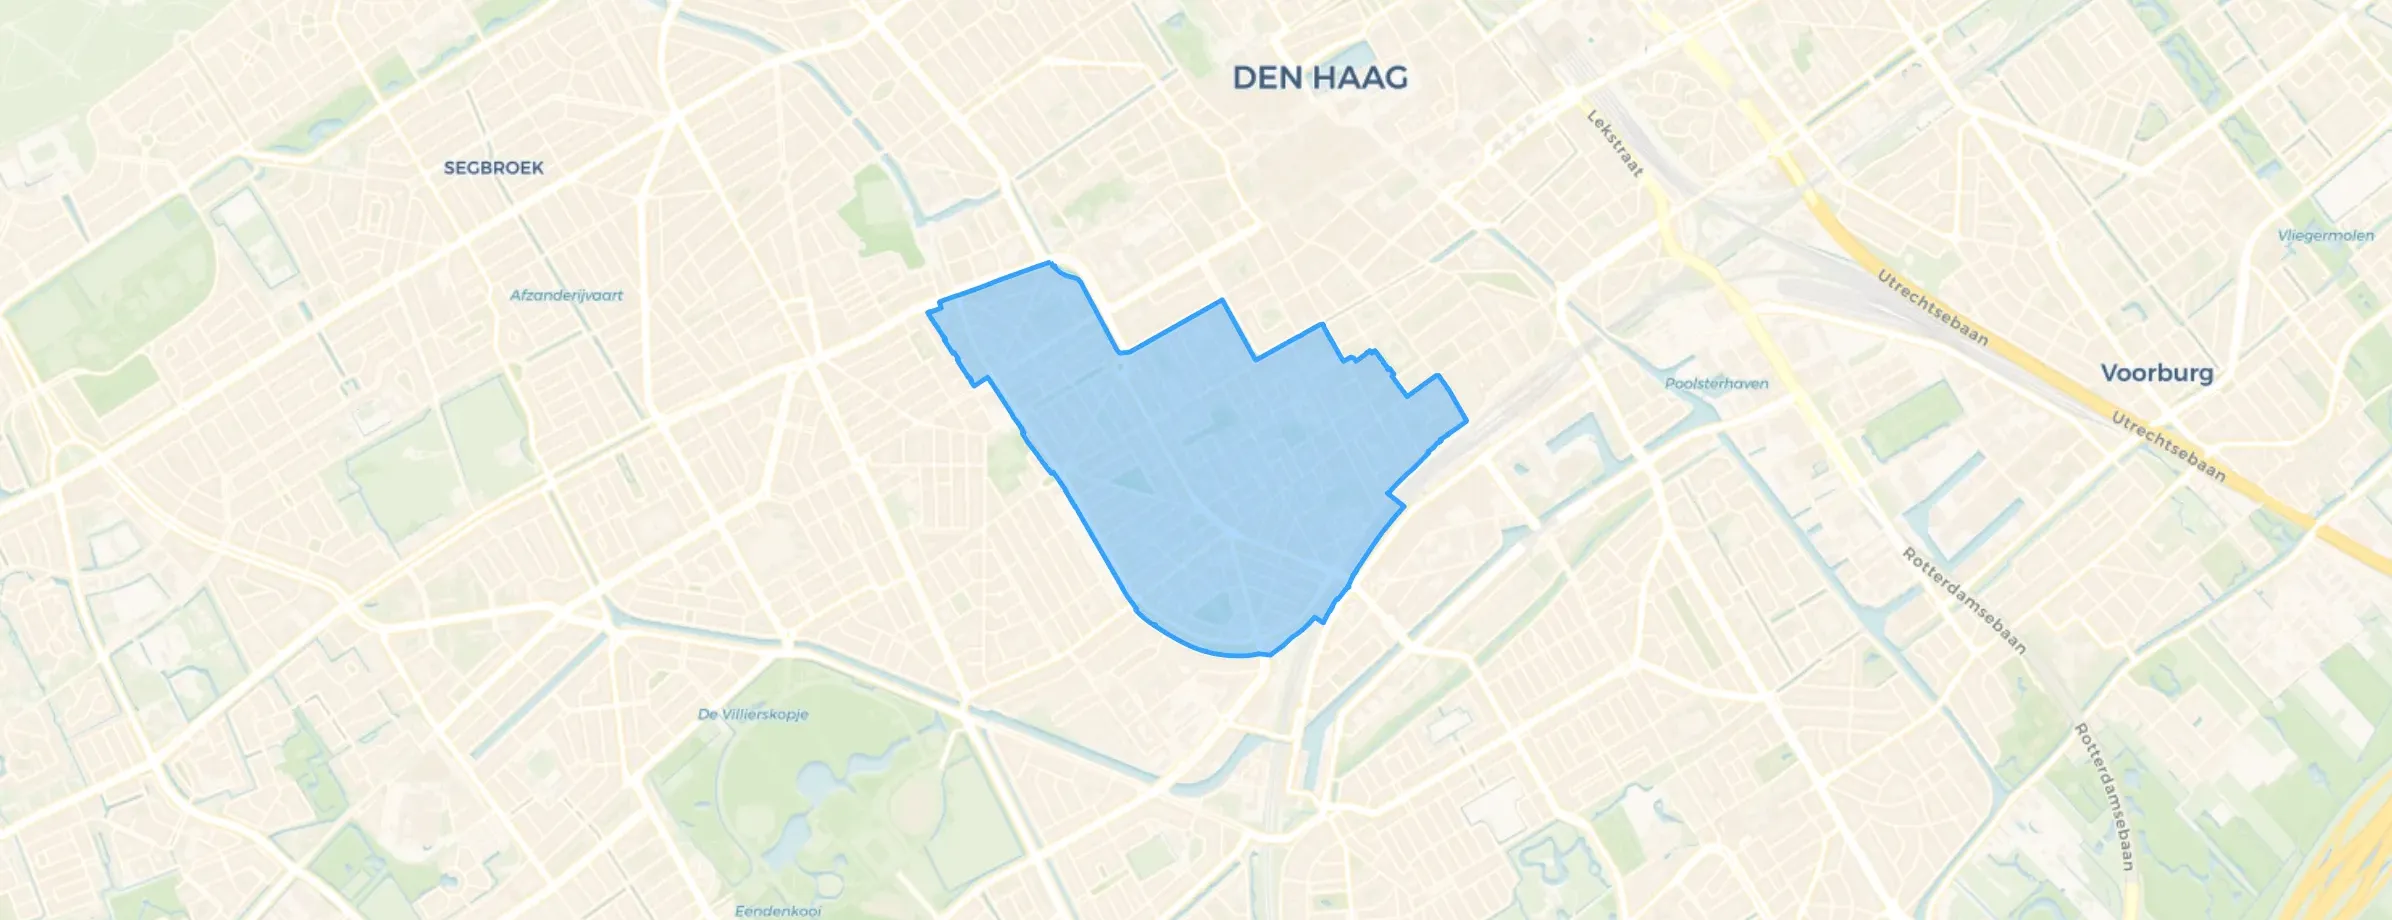
District in Den Haag
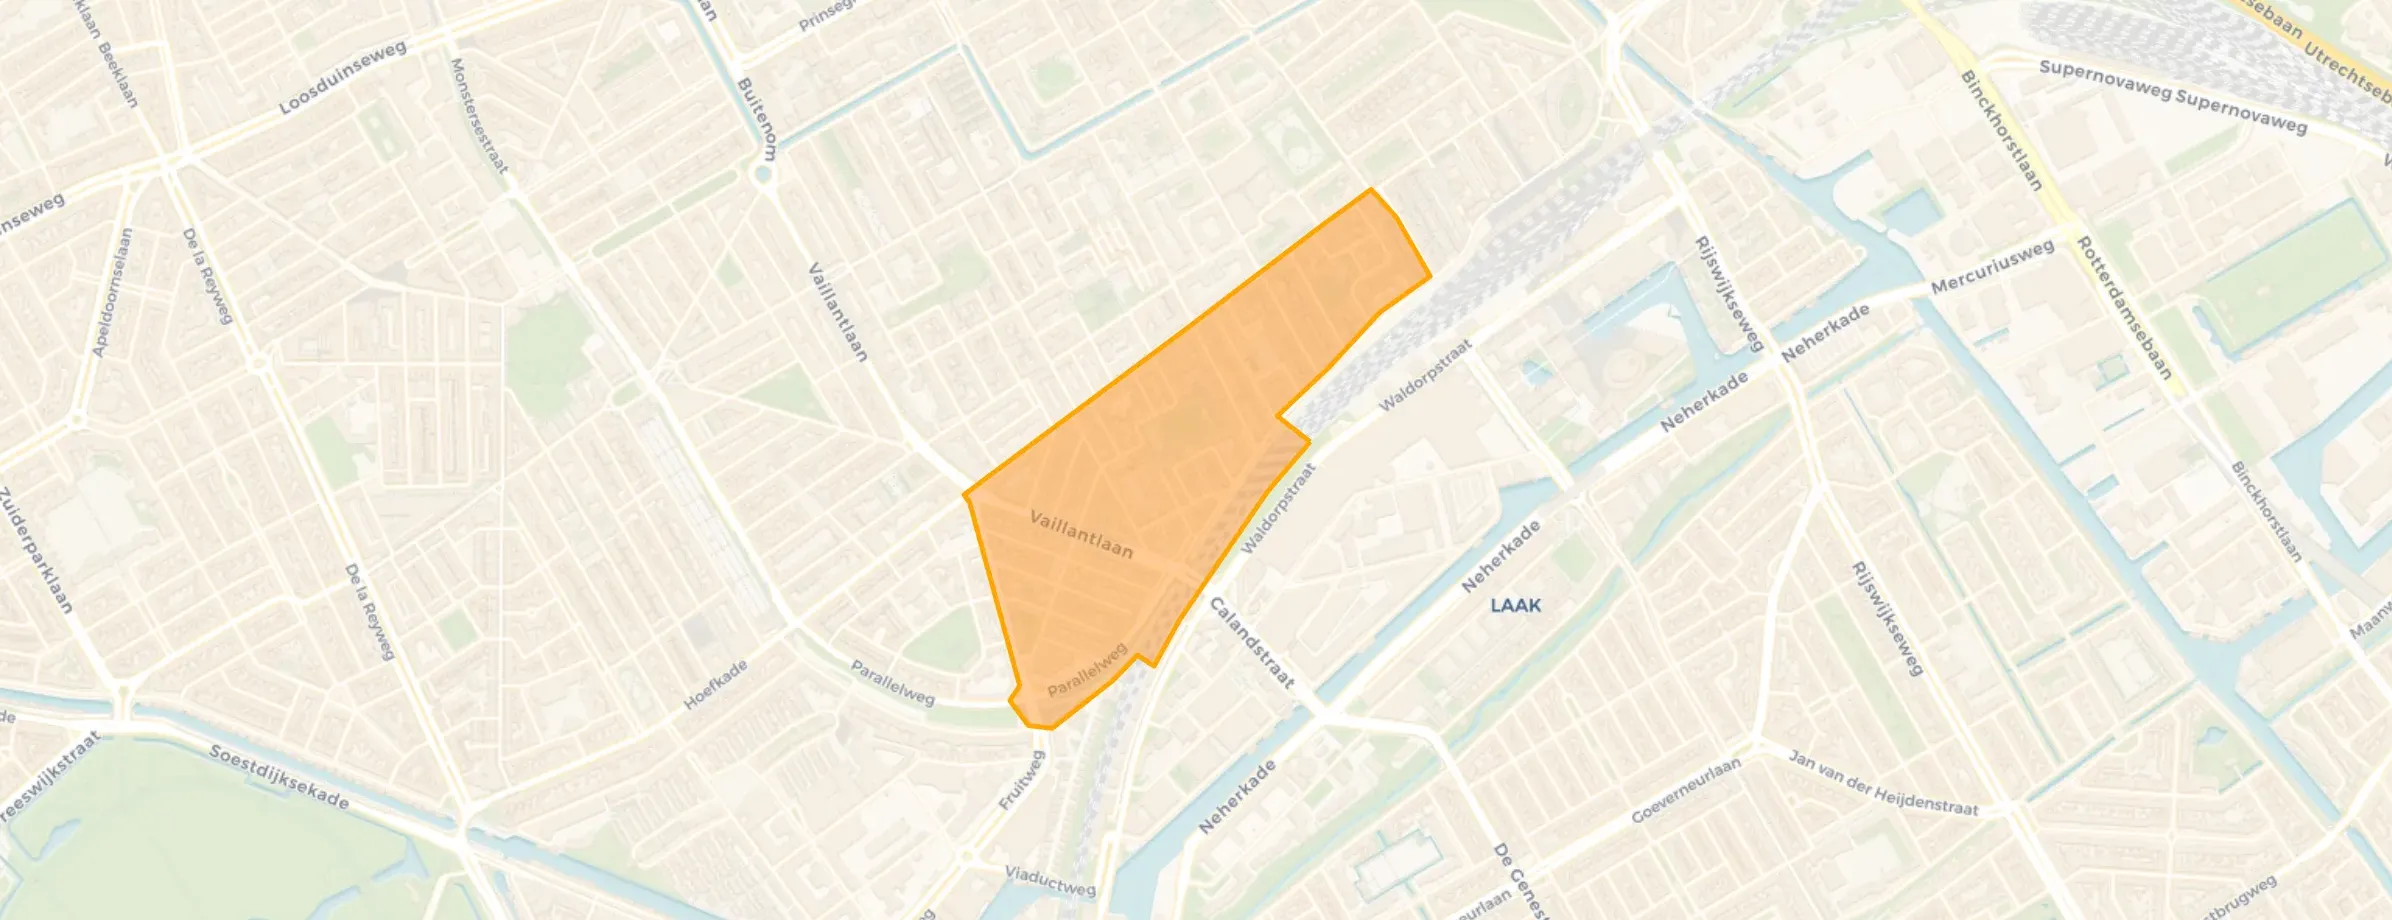
Schildersbuurt is located in the province of Zuid-Holland, in the municipality of Den Haag The district has a total area of 146 hectares, of which 146 hectares are land and 1 hectares are water. The district is coded as WK051829. The postcode area is 2512HL-2571VV.
Schildersbuurt has 30.330 residents. Of these, 49,9% are men and 50,1% are women. Most residents are 25 to 45 years (27,8%). The other age groups are 26,6% for '45 to 65 years', 17,4% for '0 to 15 years', 14,8% for '15 to 25 years' and 13,5% for '65 years or older'. Of the residents, 56,8% is unmarried, 29,2% is married, 10,9% is divorced and 3,1% is widowed. 2.730 residents originate from the Netherlands, 3.025 come from Europe and 24.580 come from countries outside Europe.
There are 13.680 households in Schildersbuurt. 46,5% of these are single-person households, 16,1% households without children and 37,4% households with children. The average household size is 2,2 persons. The national average is 2,1 persons.
In Schildersbuurt there are 23.200 income recipients. The average income per income recipient is €28.100, which is €14.100 (33%) lower than the national average of €42.200. Per resident, the average income is €21.600, which is €13.300 (38%) lower than the national average of €34.900. Most residents of Schildersbuurt are educated to a lower level. 54,5% have a lower education (VMBO or MBO 1), 31,6% have an intermediate education (HAVO, VWO or MBO 2-4) and 13,9% have a university or higher professional education (HBO/WO).
Of the 30.330 residents, around 53% are in paid employment, which amounts to 16.075 people. This is 19% lower than the national average of 72%. The majority of workers are in salaried employment (73%), while 27% are self-employed. In Schildersbuurt, 30% of residents receive a benefit. The largest group is those receiving a state pension (AOW). 3.510 people receive this benefit.
In Schildersbuurt there are 12.740 homes with an average assessed value (WOZ) of €269.000. Of these, around 96% are occupied and 4% unoccupied. Most homes are rental properties. This amounts to 81% rental homes and 19% owner-occupied homes. Of the homes, 19% privately owned, 66% owned by housing associations and 15% owned by other landlords. The most common construction periods in Schildersbuurt are 1990-2000 (37%) and 1980-1990 (20%).
There are currently no homes for sale in Schildersbuurt. The most recently listed home is Loosduinsekade 41A by Van Herk Makelaars Den Haag op Funda. No homes were sold in Schildersbuurt over the past year.
There are currently no homes for rent in Schildersbuurt. The most recent home is Zoutkeetsingel 102, offered by www.woonnet-haaglanden.nl. No homes were let in Schildersbuurt over the past year.
No recent rental data available for Schildersbuurt.
In Schildersbuurt there are 10.763 addresses with a registered energy label. The most common labels are A (32%), B (28%) and C (21%). On average, an address in Schildersbuurt uses 1.980 kWh of electricity per year. This is 22% below the national average of 2.550 kWh. With an annual consumption of 730 m³ per address, natural gas consumption is 9% below the national average of 800 m³.
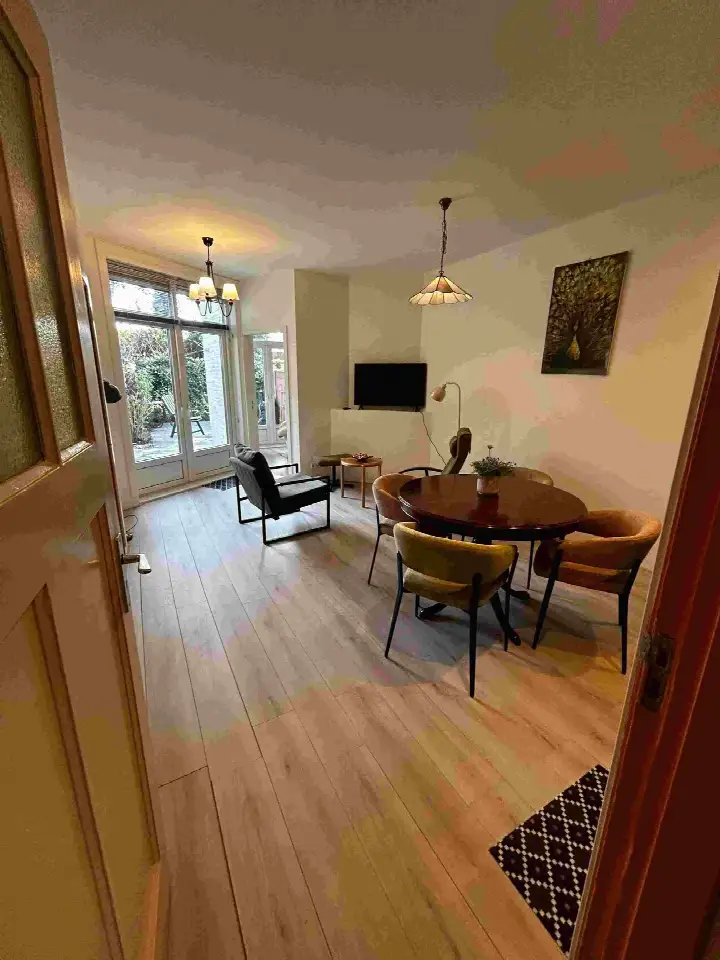
It's a very pleasant neighbourhood, but all sorts of things happen here. Fortunately, there are also nice people here who sometimes want to talk to you.
Auto-translated to English by AIAlways had my way in this neighbourhood except for the traffic
Auto-translated to English by AIThe neighbourhood has always been nice, but there is still a lot of room for improvement. There are many schools nearby, making it easy and quick for children to access education. There isn't much greenery in this neighbourhood apart from one or two small parks where not much happens anyway.
Auto-translated to English by AISchilderswijk is not the prettiest neighbourhood, lots of rubbish and robberies, but plenty of diversity in terms of culture, and that is nice.
Auto-translated to English by AIIs a nice and cosy neighbourhood. You see many people coming together to eat or have a conversation with each other. Everything is well organised, many things are within reach and I think this place is great.
Auto-translated to English by AIMy neighbourhood is super cosy. Everyone knows each other and nobody has any problems with each other. We see each other as a family, brother and sister. I feel safe here.
Auto-translated to English by AIThere are really nice people living in the neighbourhood, they interact nicely with each other. One big family.
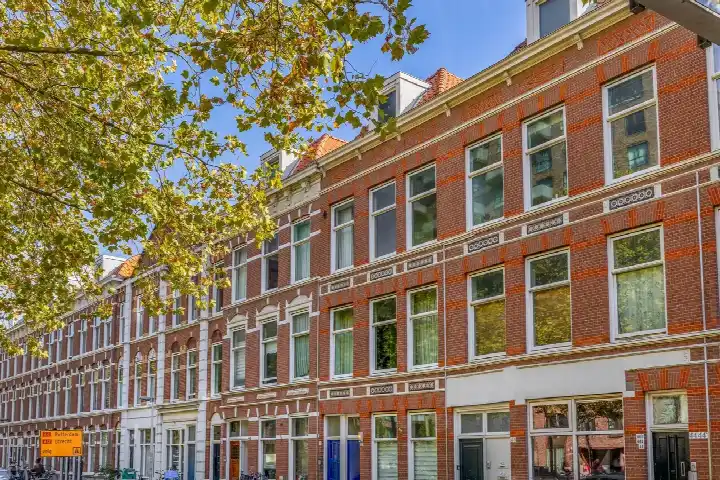
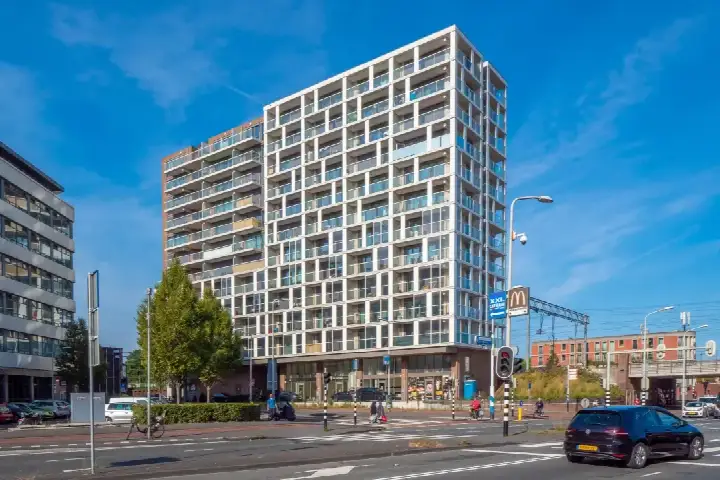
Auto-translated to English by AIThe most common type is flats (86%).
Over the past year a home for sale in Schildersbuurt was listed for an average of €367,500 (€4,501 per m²). That is 30% below the Dutch national average. Last quarter prices rose by 10%.
A rental home in Schildersbuurt cost an average of €1,367 per month (€27 per m²). That is 37% below the national average.
Residents give Schildersbuurt a 6.9 out of 10 based on 7 reviews. The strongest score is for accessibility (8.0), the weakest for nature and greenery (5.4).
Wijk Schildersbuurt has 30,330 residents. Many families: 37% of the households have children.
The housing supply in Schildersbuurt is remarkably efficient: 58% has an A, A+ or B label. The average natural gas consumption per household is 730 m³ per year.
From Schildersbuurt you can on average reach a supermarket at 0.4 km, a GP at 0.4 km, a railway station at 1.6 km, a primary school at 0.4 km (as the crow flies, source: CBS).
Right now you will find 84 homes for sale and 15 homes for rent in Schildersbuurt.