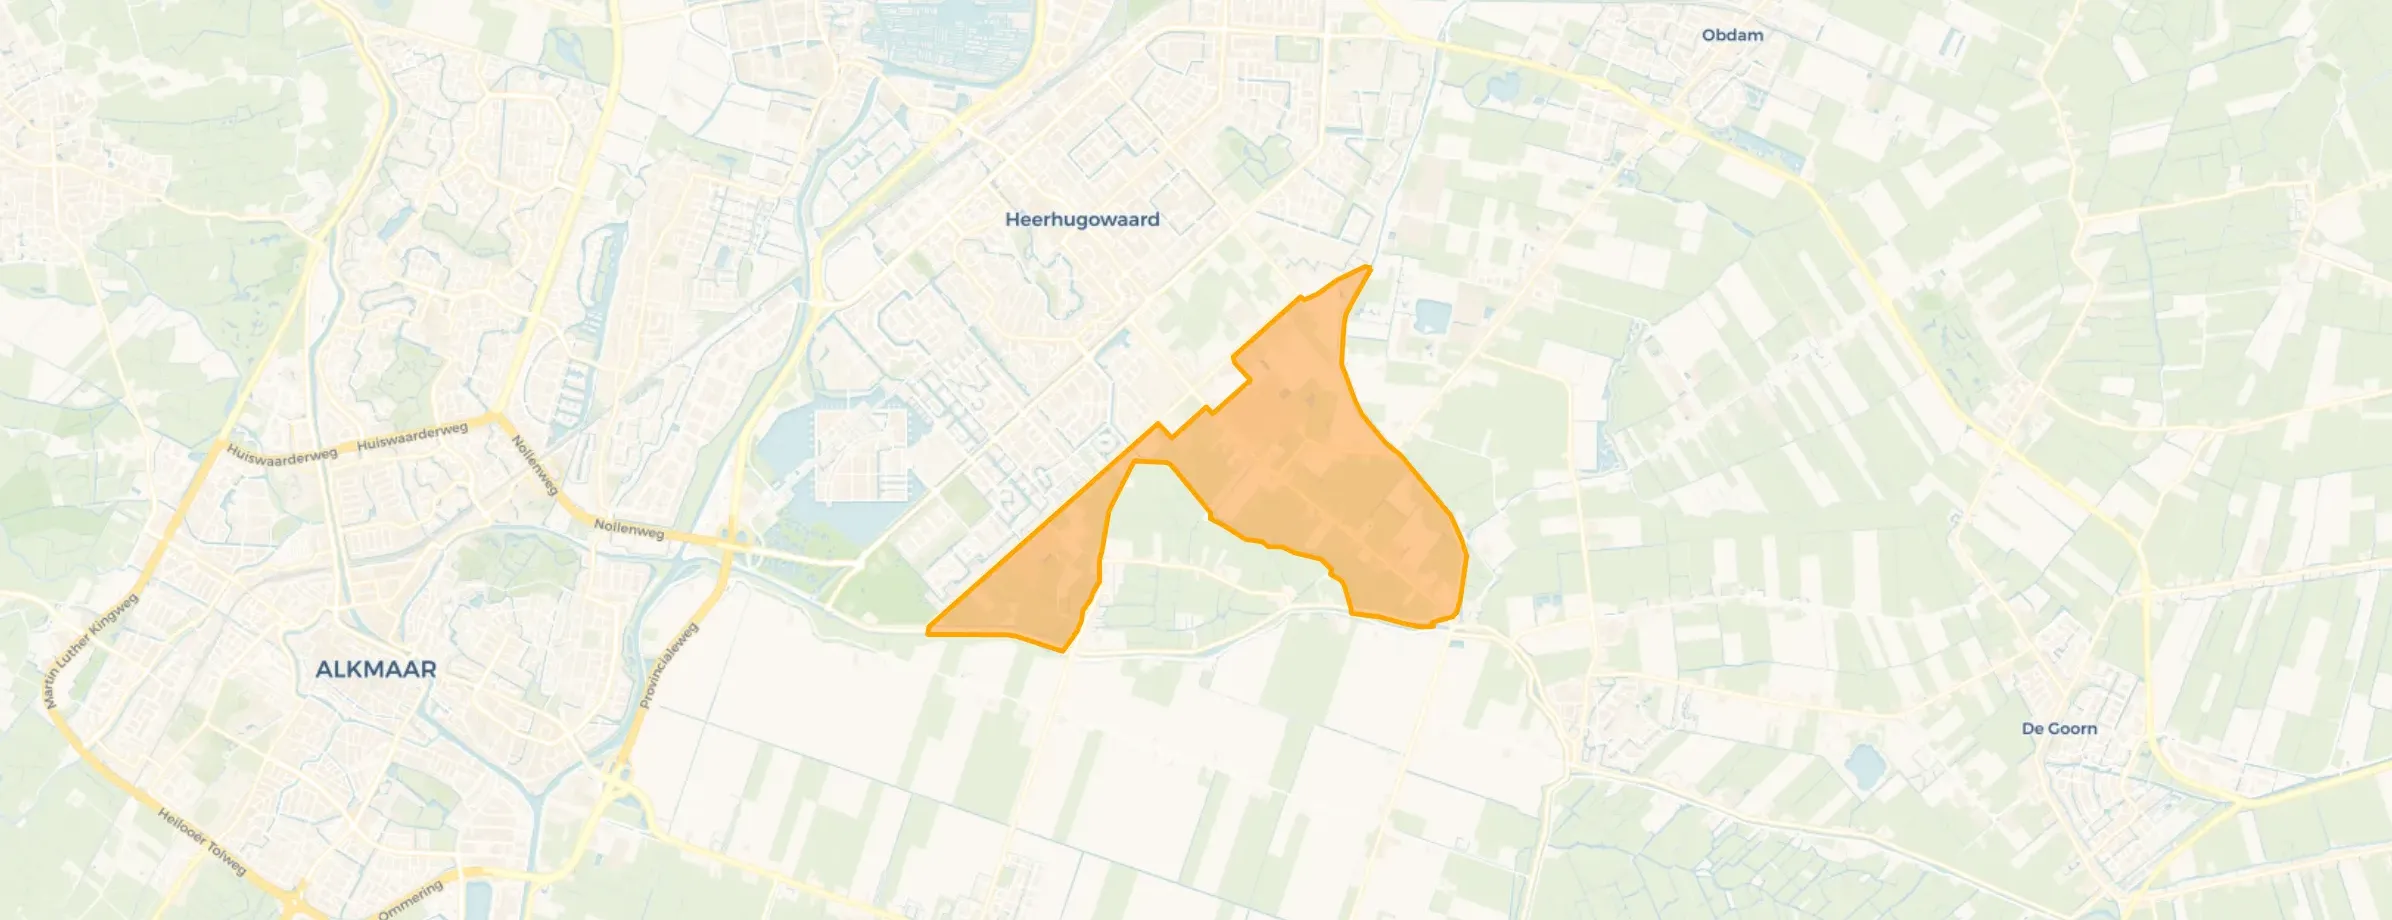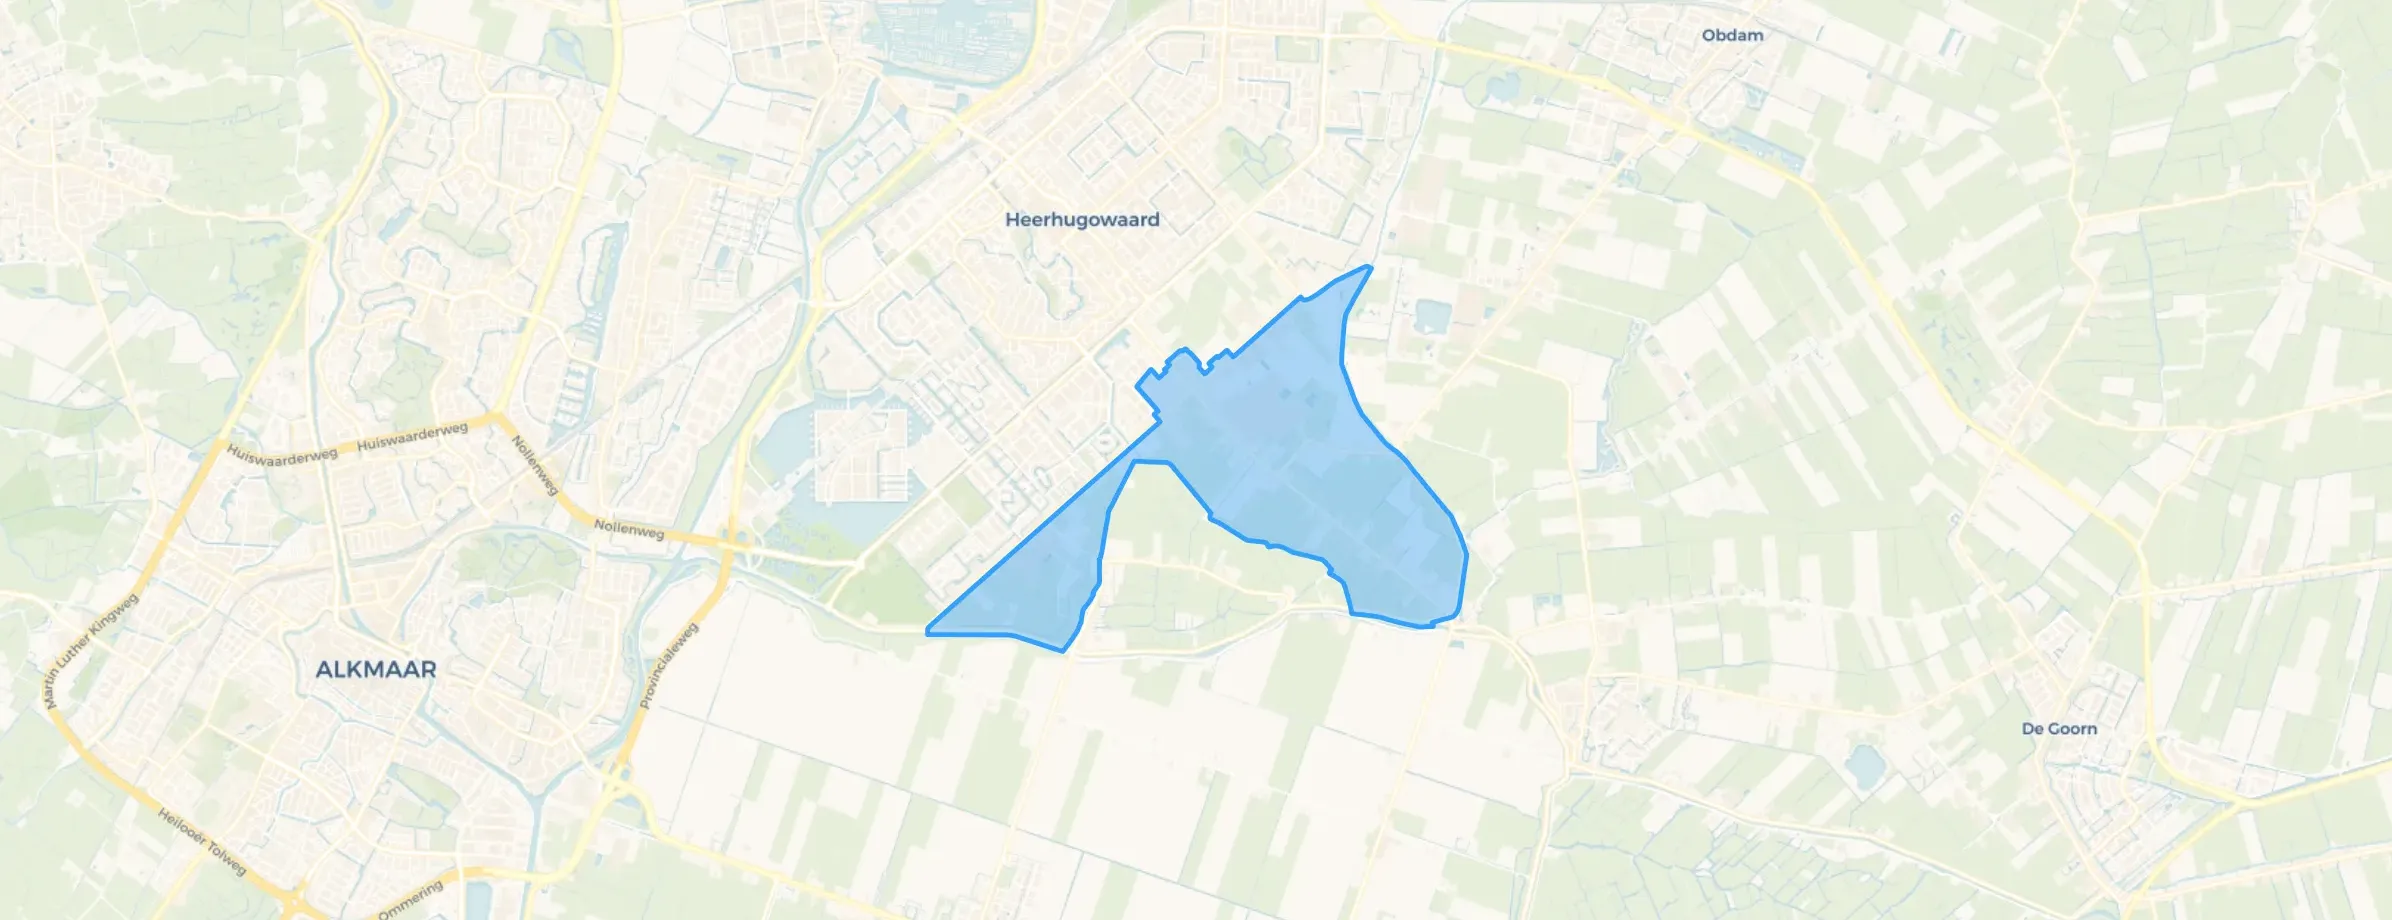
District in Dijk en Waard
’t Kruis is located in the province of Noord-Holland, in the municipality of Dijk en Waard The district has a total area of 451 hectares, of which 446 hectares are land and 6 hectares are water. The district is coded as WK198028. The postcode area is 1702NA-1703RZ.
’t Kruis has 720 residents. Of these, 52,1% are men and 47,9% are women. Most residents are 45 to 65 years (31,3%). The other age groups are 23,6% for '65 years or older', 19,4% for '25 to 45 years', 13,2% for '0 to 15 years' and 12,5% for '15 to 25 years'. Of the residents, 44,4% is unmarried, 46,5% is married, 5,6% is divorced and 3,5% is widowed. 655 residents originate from the Netherlands, 40 come from Europe and 25 come from countries outside Europe.
There are 295 households in ’t Kruis. 23,7% of these are single-person households, 39,0% households without children and 37,3% households with children. The average household size is 2,5 persons.
In ’t Kruis there are 600 income recipients. The average income per income recipient is €32.090, which is €3.710 (10%) lower than the national average of €35.800. Per resident, the average income is €32.792, which is €3.592 (12%) higher than the national average of €29.200. Most residents of ’t Kruis are educated to an intermediate level. 45,6% have an intermediate education (HAVO, VWO or MBO 2-4), 29,8% have a lower education (VMBO or MBO 1) and 24,6% have a university or higher professional education (HBO/WO).
Of the 720 residents, around 67% are in paid employment, which amounts to 482 people. This is 2% higher than the national average of 65%. The majority of workers are in salaried employment (69%), while 31% are self-employed. In ’t Kruis, 24% of residents receive a benefit. The largest group is those receiving a state pension (AOW). 140 people receive this benefit.
In ’t Kruis there are 285 homes with an average assessed value (WOZ) of €540.000. Of these, around 94% are occupied and 6% unoccupied. Most homes are owner-occupied. This amounts to 17% rental homes and 83% owner-occupied homes. Of the homes, 83% privately owned, 9% owned by housing associations and 8% owned by other landlords. The most common construction periods in ’t Kruis are 1950-1970 (19%) and 1980-1990 (19%).
There are currently no homes for sale in ’t Kruis. The most recently listed home is Rustenburgerweg 231 by Bakker Schoon Makelaardij op Pararius. No homes were sold in ’t Kruis over the past year.
There are currently no homes for rent in ’t Kruis. No homes were let in ’t Kruis over the past year.
No recent rental data available for ’t Kruis.
In ’t Kruis there are 270 addresses with a registered energy label. The most common labels are C (27%), A (18%) and G (17%). On average, an address in ’t Kruis uses 3.740 kWh of electricity per year. This is 33% above the national average of 2.810 kWh. Natural gas consumption, at 1.390 m³ per year, is 9% above the national average of 1.280 m³.
The neighbourhood is very cosy. There are many events on the Kruis that are often very enjoyable for young and old. The architecture of the houses doesn't match well. And the neighbours are all friendly and everyone knows each other a bit. We are only quite far from the station and I think there is little entertainment in the neighbourhood.
Auto-translated to English by AIThe housing stock is relatively young — 55% dates from after 1990. In addition, the most common type is detached houses (61%).
Over the past year a home for sale in ’t Kruis was listed for an average of €512,321 (€3,922 per m²).
A rental home in ’t Kruis cost an average of €1,293 per month (€16 per m²).
Wijk ’t Kruis has 720 residents. The largest age group is 45 to 65 years (31%). Many families: 37% of the households have children.
The housing supply in ’t Kruis is remarkably efficient: 73% has an A, A+ or B label. The average natural gas consumption per household is 1,390 m³ per year.
From ’t Kruis you can on average reach a supermarket at 0.7 km, a GP at 2.3 km, a railway station at 3.4 km, a primary school at 0.7 km (as the crow flies, source: CBS).