District in Den Haag
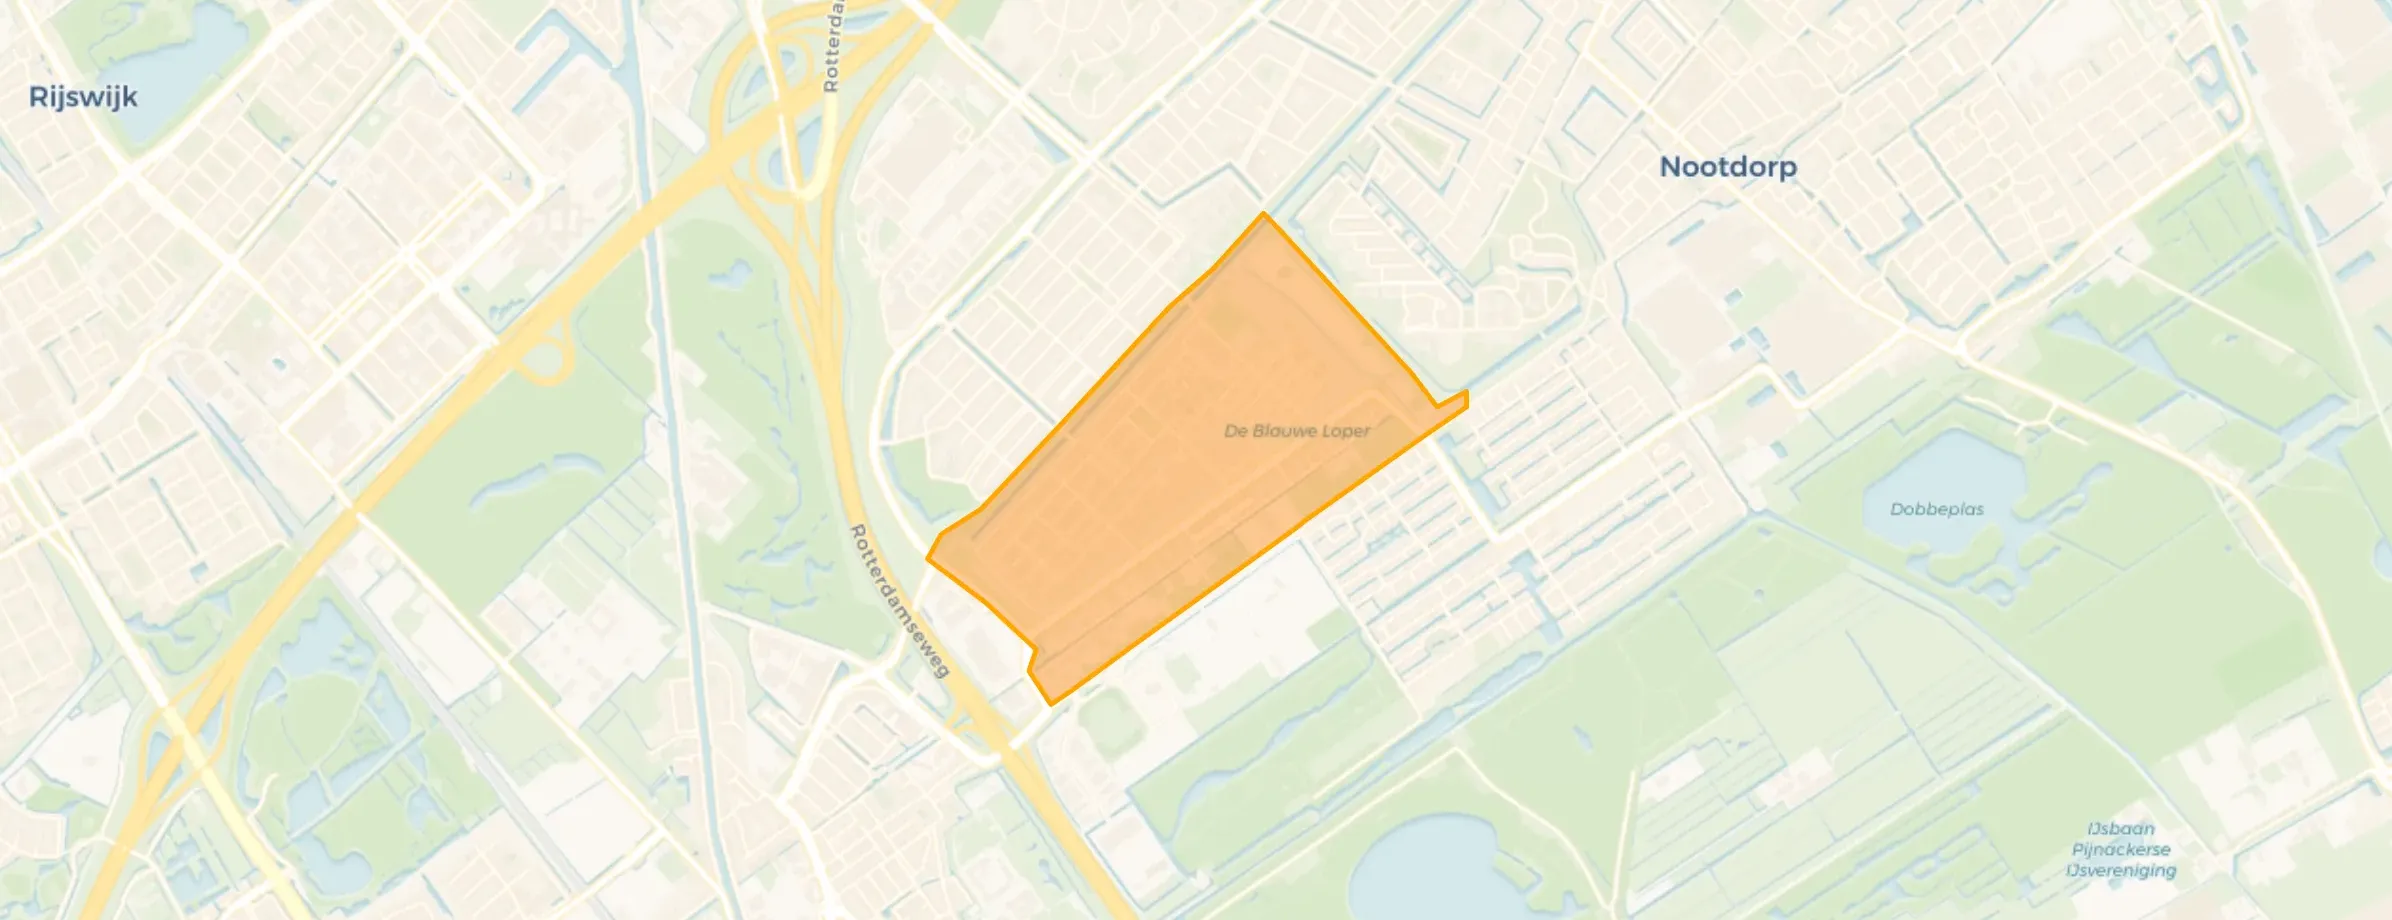
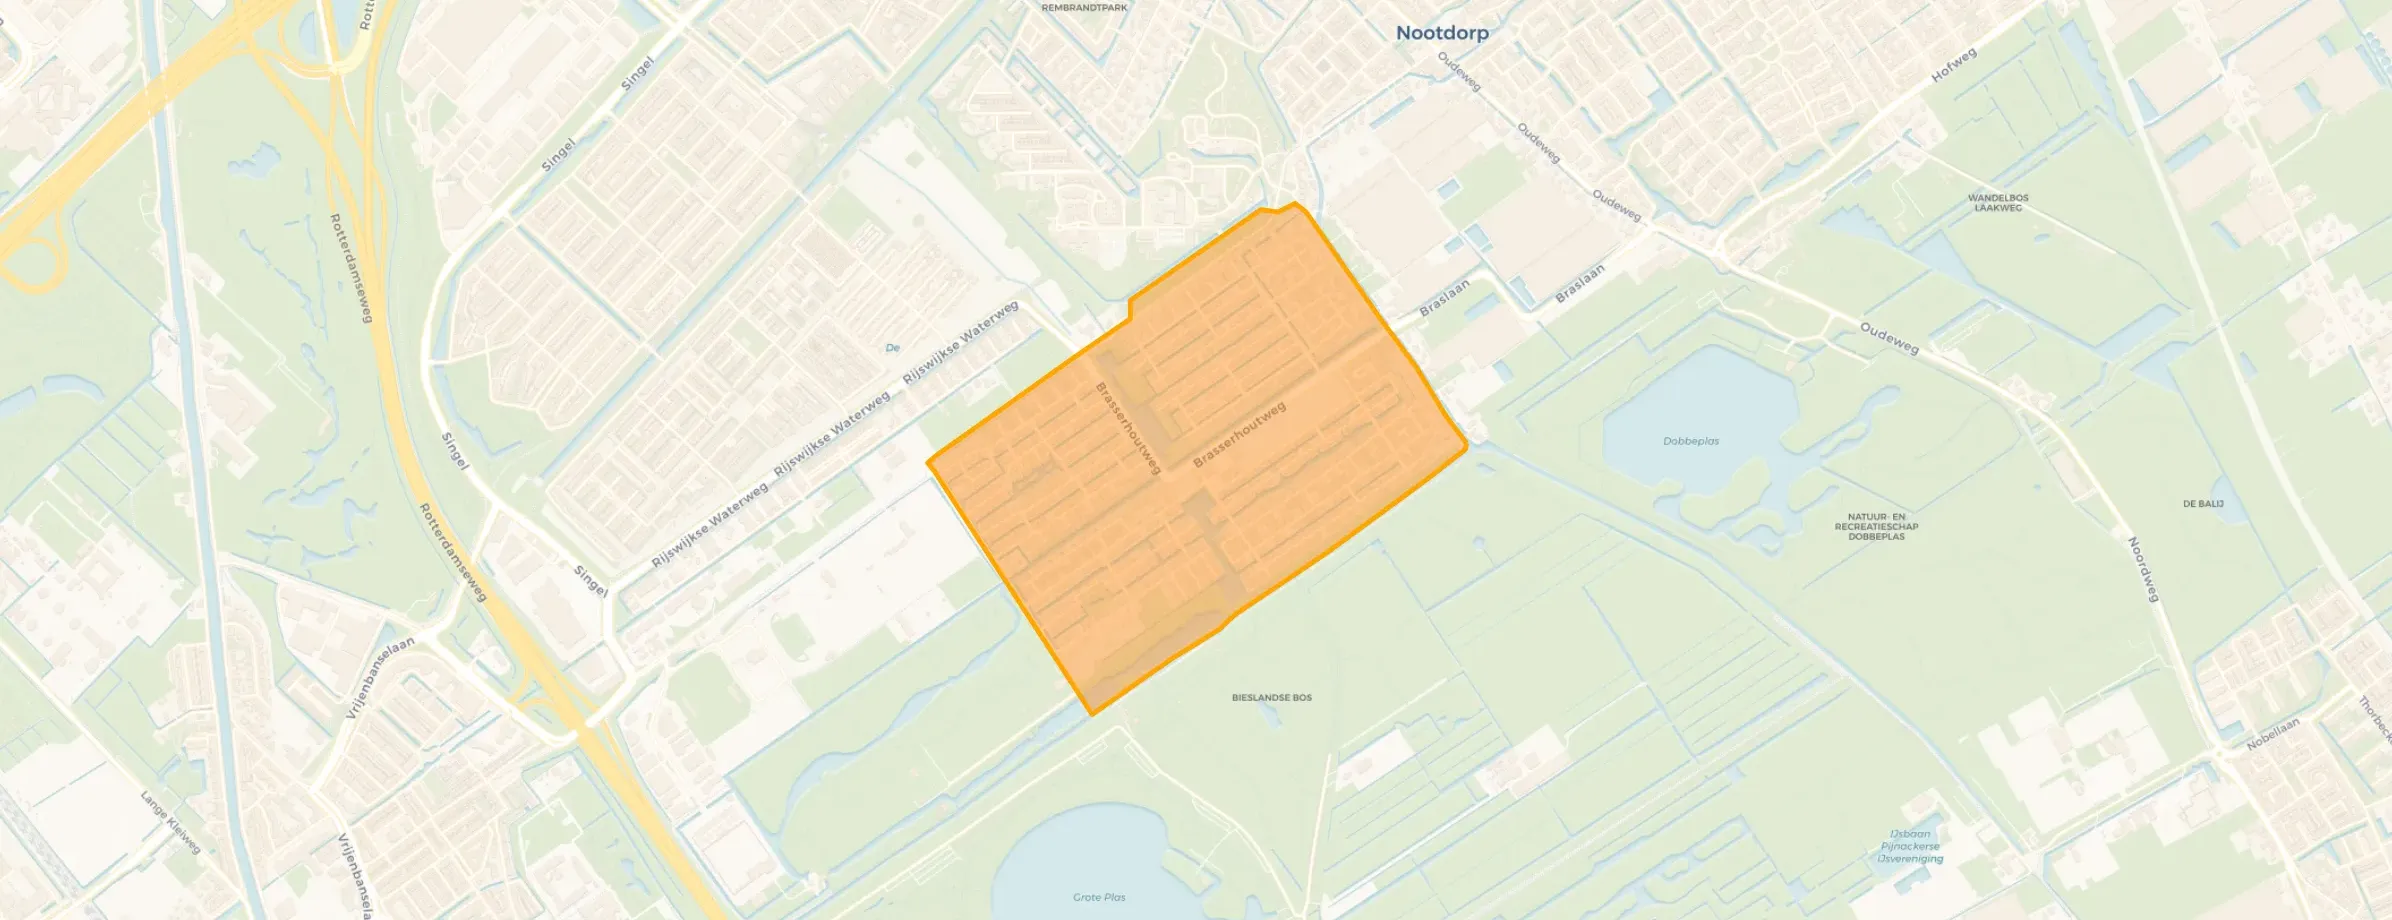
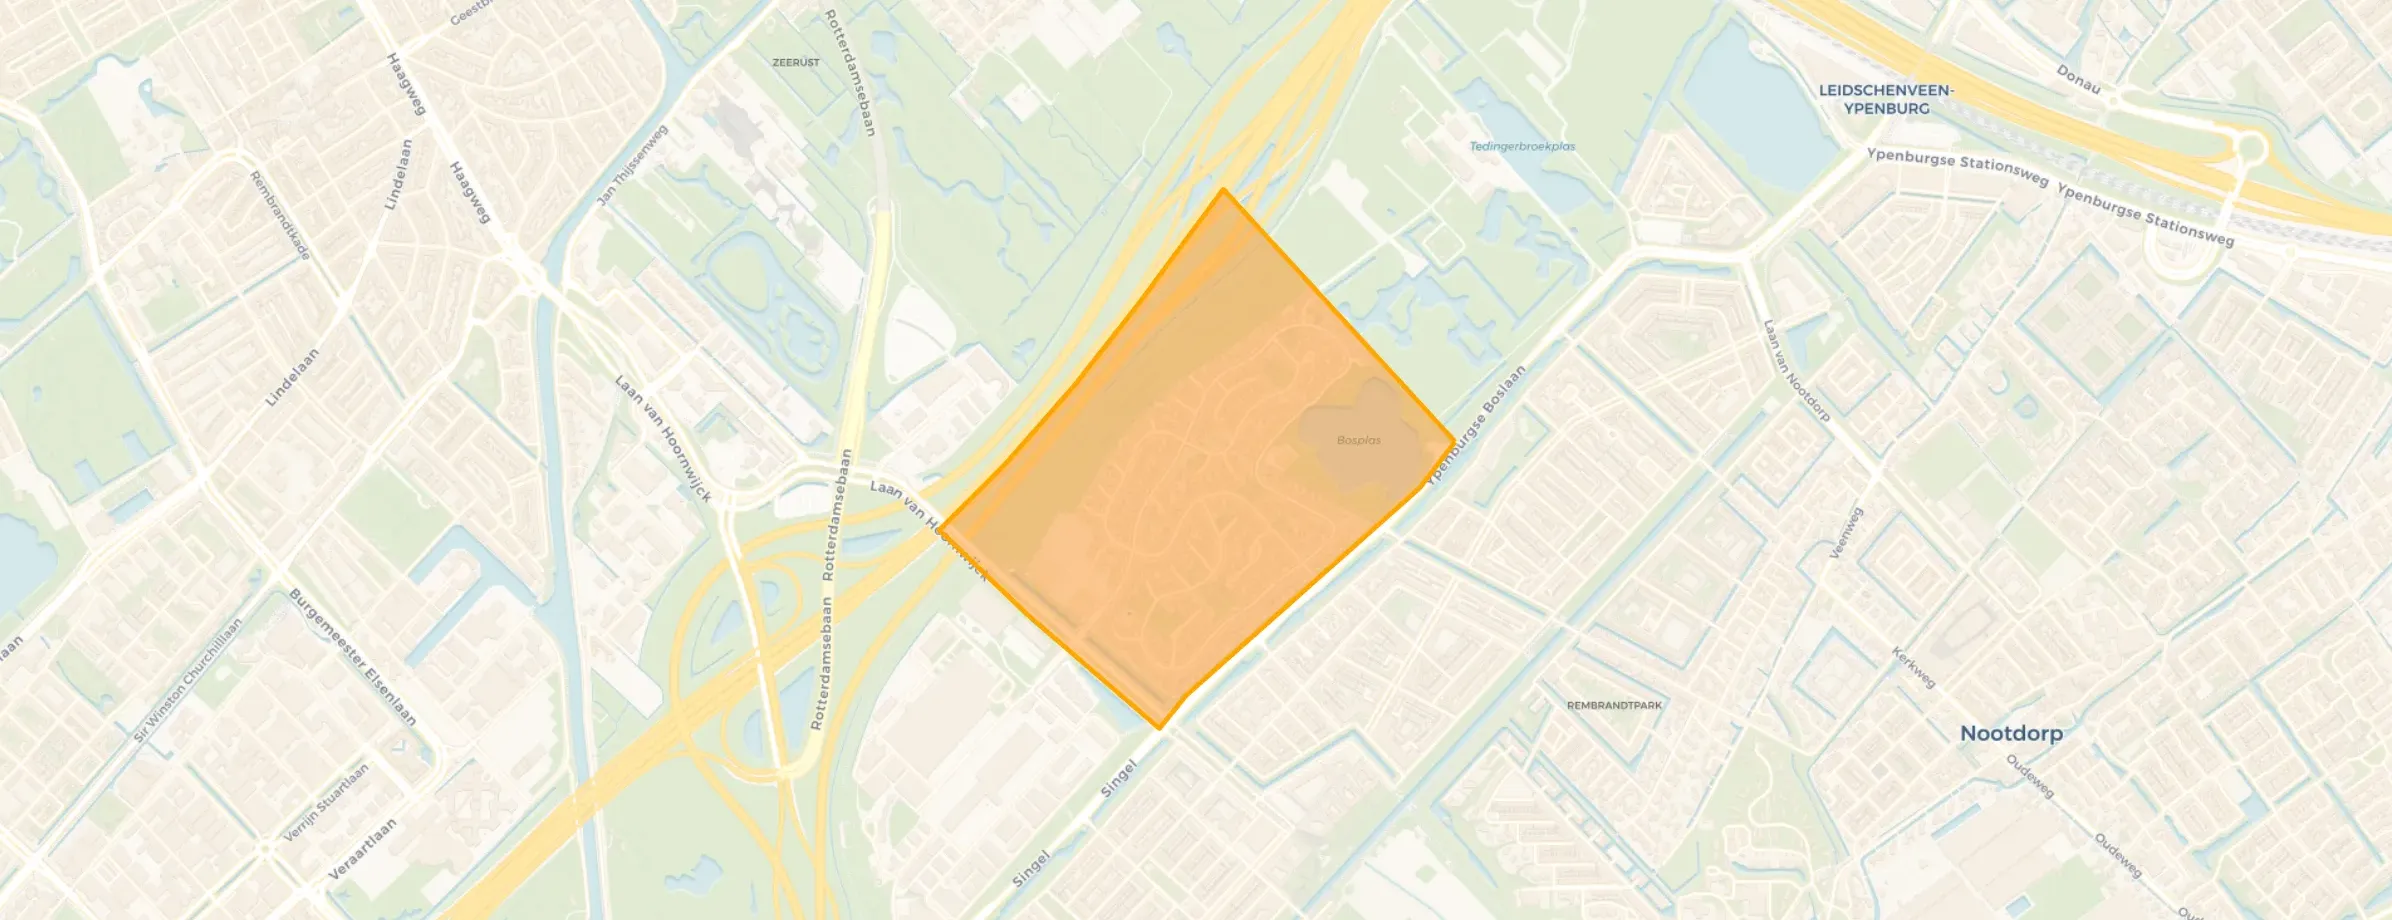
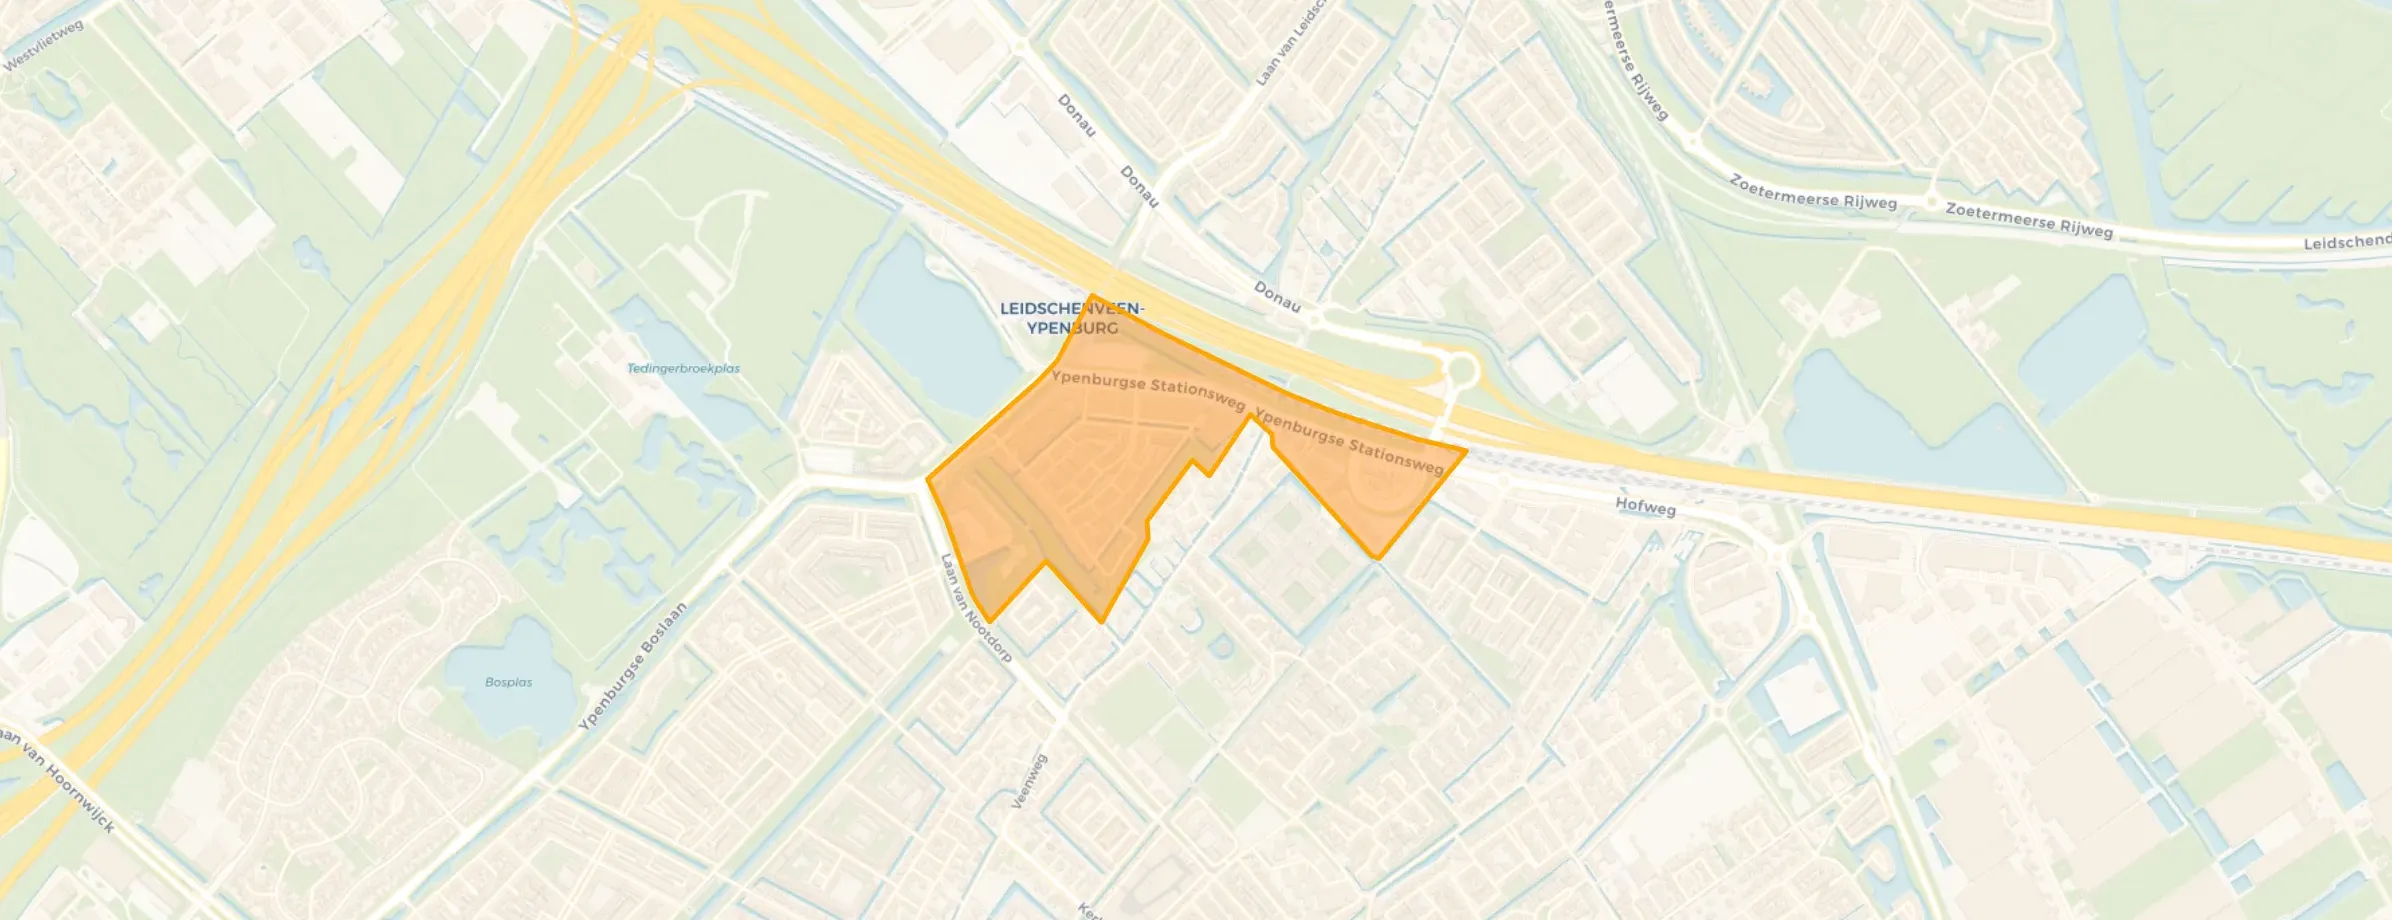
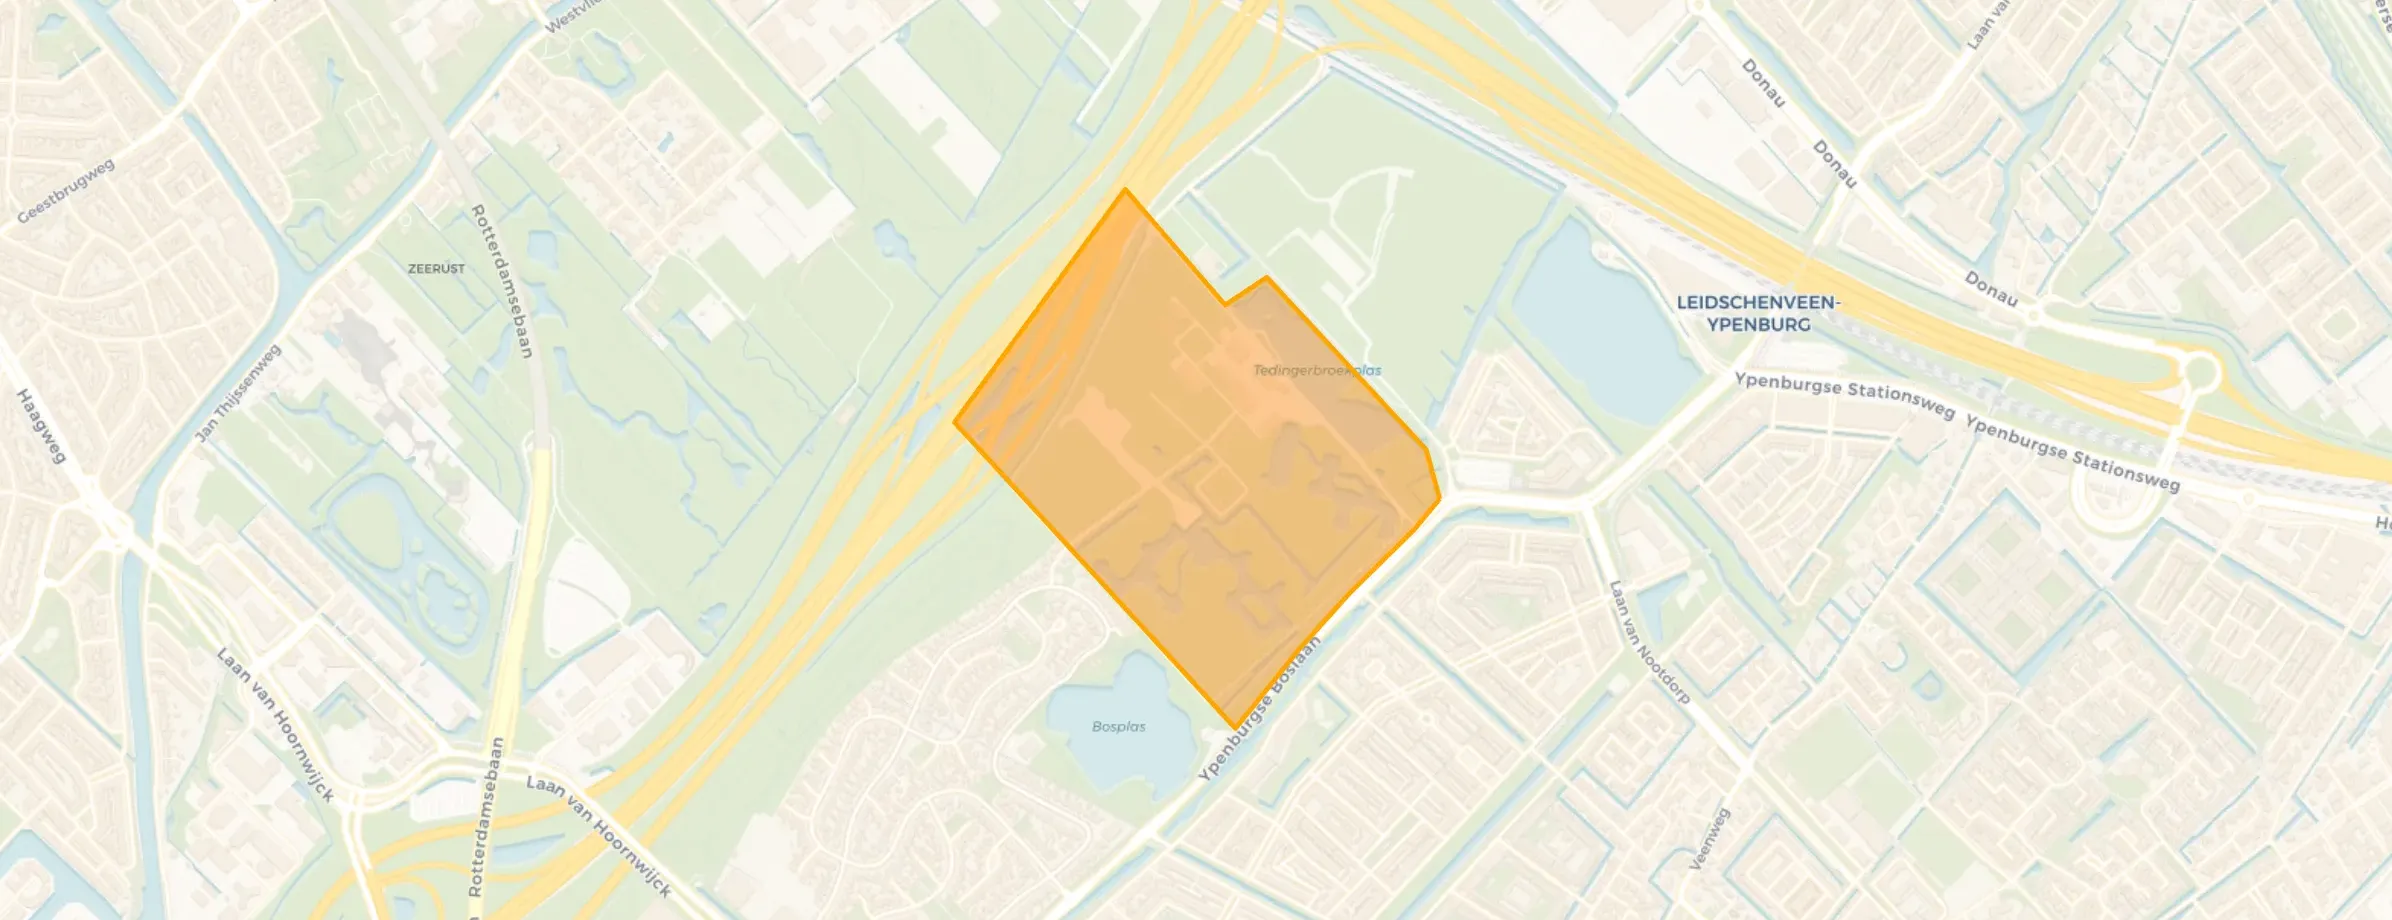
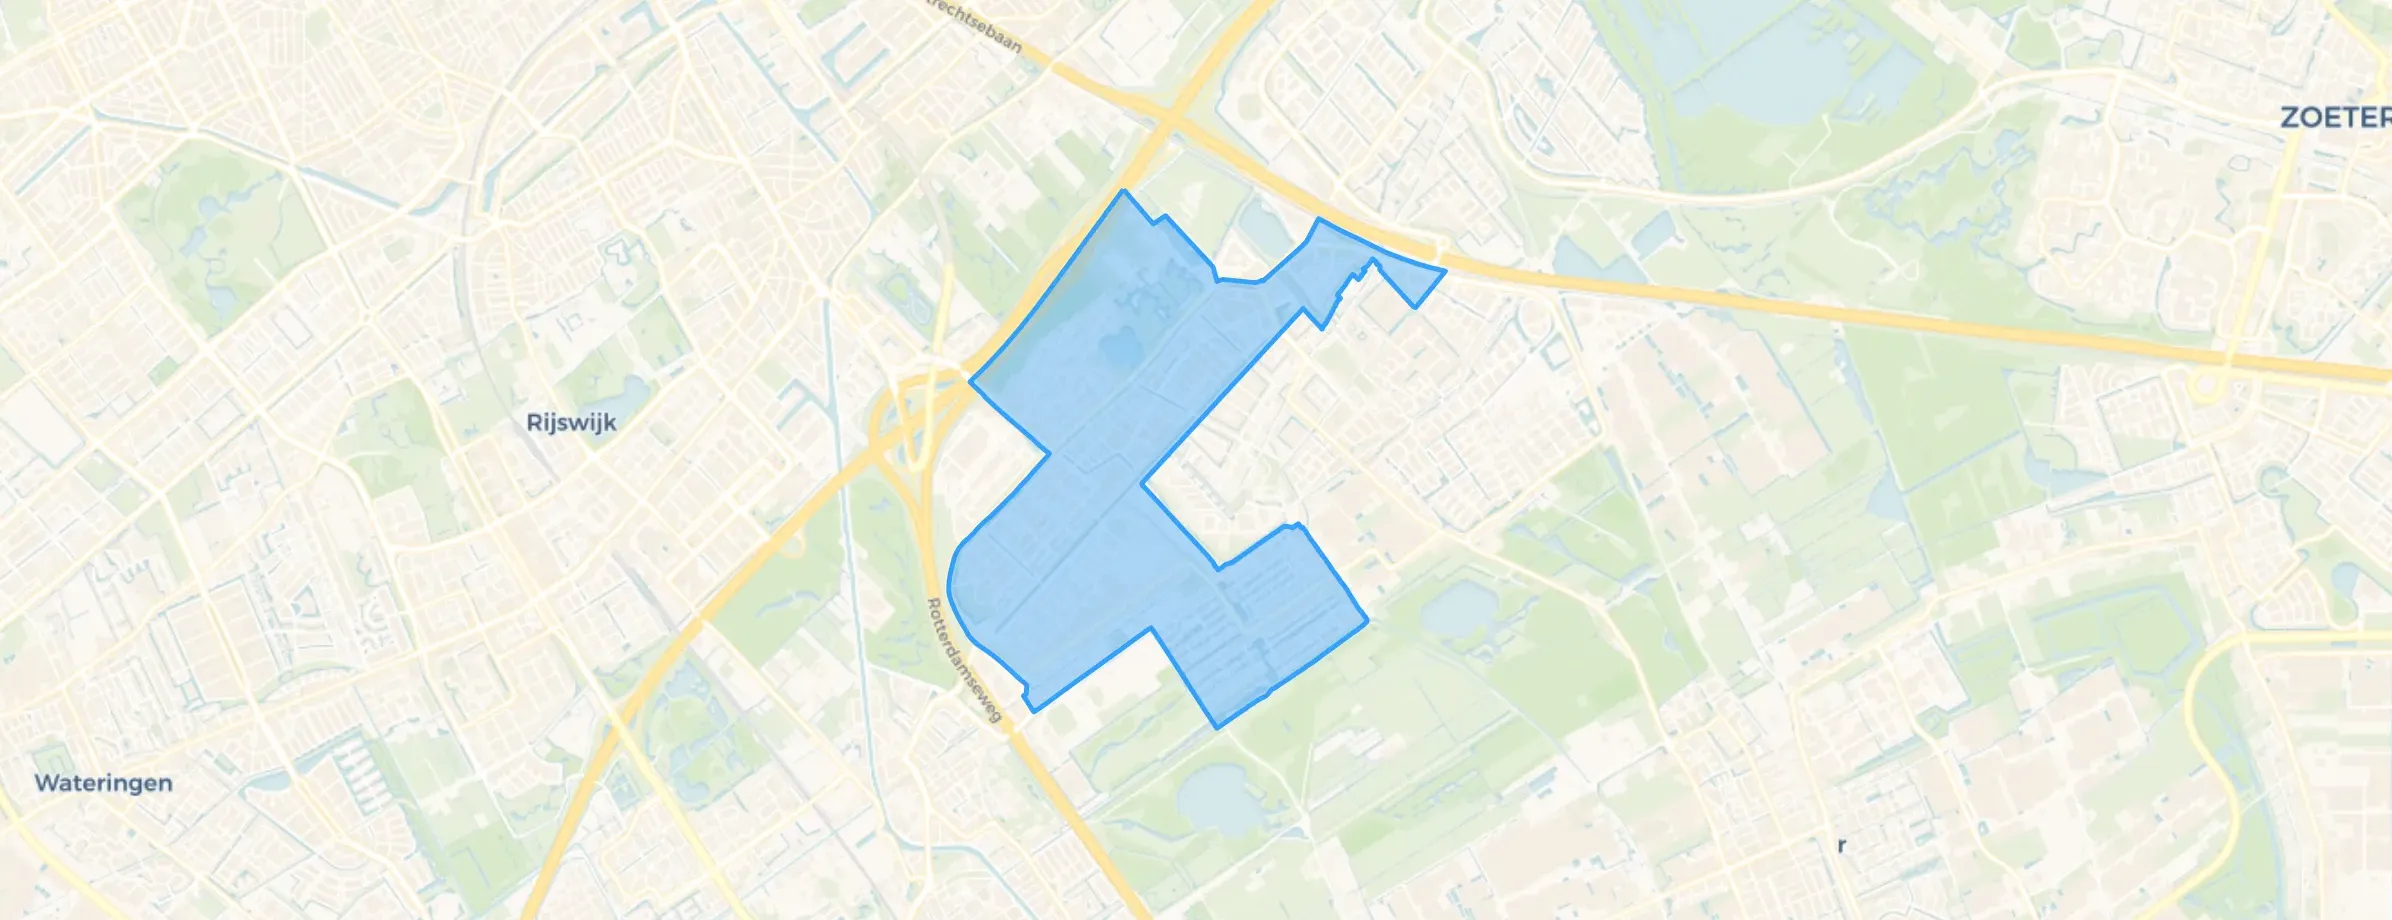
Ypenburg is located in the province of Zuid-Holland, in the municipality of Den Haag The district has a total area of 505 hectares, of which 450 hectares are land and 54 hectares are water. The district is coded as WK051842. The postcode area is 2496HA-2498ZC.
Ypenburg has 26.695 residents. Of these, 50,0% are men and 50,0% are women. Most residents are 45 to 65 years (33,1%). The other age groups are 22,6% for '25 to 45 years', 18,9% for '0 to 15 years', 15,7% for '15 to 25 years' and 9,7% for '65 years or older'. Of the residents, 53,8% is unmarried, 36,9% is married, 7,3% is divorced and 1,9% is widowed. 13.775 residents originate from the Netherlands, 2.800 come from Europe and 10.125 come from countries outside Europe.
There are 10.220 households in Ypenburg. 24,8% of these are single-person households, 22,3% households without children and 52,9% households with children. The average household size is 2,6 persons.
In Ypenburg there are 20.100 income recipients. The average income per income recipient is €44.600, which is €8.800 (25%) higher than the national average of €35.800. Per resident, the average income is €34.000, which is €4.800 (16%) higher than the national average of €29.200. Most residents of Ypenburg are highly educated. 37,3% have a university or higher professional education (HBO/WO), 36,7% have an intermediate education (HAVO, VWO or MBO 2-4) and 26,0% have a lower education (VMBO or MBO 1).
Of the 26.695 residents, around 67% are in paid employment, which amounts to 17.886 people. This is 2% higher than the national average of 65%. The majority of workers are in salaried employment (83%), while 17% are self-employed. In Ypenburg, 15% of residents receive a benefit. The largest group is those receiving a state pension (AOW). 2.170 people receive this benefit.
In Ypenburg there are 9.734 homes with an average assessed value (WOZ) of €467.000. Of these, around 98% are occupied and 2% unoccupied. Most homes are owner-occupied. This amounts to 43% rental homes and 57% owner-occupied homes. Of the homes, 57% privately owned, 25% owned by housing associations and 18% owned by other landlords. The most common construction periods in Ypenburg are 2000-2010 (70%) and 1990-2000 (24%).
There are currently no homes for sale in Ypenburg. The most recently listed home is Blauw Glidkruid 63 by Frisia Makelaars B.V.. No homes were sold in Ypenburg over the past year.
There are currently no homes for rent in Ypenburg. The most recent home is Windjammersingel 112, offered by www.woonnet-haaglanden.nl. No homes were let in Ypenburg over the past year.
No recent rental data available for Ypenburg.
In Ypenburg there are 9.974 addresses with a registered energy label. The most common labels are A (63%), B (23%) and A+ (11%). On average, an address in Ypenburg uses 3.090 kWh of electricity per year. This is 10% above the national average of 2.810 kWh. With an annual consumption of 140 m³ per address, natural gas consumption is 89% below the national average of 1.280 m³.
Pleasant living close to amenities and nature area.
Auto-translated to English by AIIf something is going on, the neighbours often want to help or offer a sympathetic ear! Actually, nothing really crazy ever happens in the neighbourhood, only people often drive too fast late at night. When the bins are full, all the residents report it and they are emptied quickly, which I personally find very nice. The neighbourhood and the residents keep the area very tidy and clean, I feel privileged to live in such a beautiful place.
Auto-translated to English by AII've lived here for almost 17 years, it's a beautiful neighbourhood, lots of lovely families, schools, a big park, you name it, it's great, it's very clean here, it's located near the motorway, it's super easy to reach
Auto-translated to English by AIWhen I first moved here, I thought, oh nice, a nice quiet neighbourhood, but that quickly faded. I myself have aggressive neighbours who throw their joints everywhere and just move your things without asking. Way too many loitering youths in the area, they terrorise the shopping centre every evening, and there's just nothing fun here. It's dirty everywhere, there's litter and rubbish, and it just stinks.
Auto-translated to English by AIForest and park around the corner, 2 schools centrally located in the neighbourhood, community centre, many playgrounds and a sports club. There is a lot to do in the Bras, especially for primary school-aged children. The neighbourhood association is active and organises a fun activity almost every month.
Auto-translated to English by AIThe part where I live is very social, but you notice that the neighbourhood is deteriorating; more rubbish is left on the streets and it's more restless in the evening. We also experience enormous parking pressure because everything around our neighbourhood has become paid parking, but not here, even though we applied for it. The fact that there is a lot of greenery in our neighbourhood gives a nice feeling. Public transport is very good; you have access to bus, tram and train, making it easy to get anywhere. The motorway is also easily accessible.
Auto-translated to English by AI.
Auto-translated to English by AIE
Auto-translated to English by AI
The housing stock is relatively young — 99% dates from after 1990. In addition, the most common type is terraced houses (47%).
Over the past year a home for sale in Ypenburg was listed for an average of €656,467 (€4,781 per m²). Last quarter prices fell by 18%.
A rental home in Ypenburg cost an average of €2,114 per month (€16 per m²).
Residents give Ypenburg a 7.7 out of 10 based on 13 reviews. Especially accessibility (8.3) scores well; community (6.6) receives the lowest rating.
Wijk Ypenburg has 26,695 residents. The largest age group is 45 to 65 years (33%). Many families: 53% of the households have children.
The housing supply in Ypenburg is remarkably efficient: 99% has an A, A+ or B label. The average natural gas consumption per household is 140 m³ per year.
From Ypenburg you can on average reach a supermarket at 1.2 km, a GP at 1.0 km, a railway station at 3.1 km, a primary school at 0.7 km (as the crow flies, source: CBS).
Right now you will find 67 homes for sale and 15 homes for rent in Ypenburg.

Buurtje.nl uses cookies to make the site work and to improve it. In doing so, we process data such as your IP address and the pages you visit.
We use this data for three purposes: running the website (functional), measuring visits so we can improve Buurtje.nl (analytics), and — if you allow it — tailoring ads to your interests (marketing).
How we handle your data is described in our privacy policy. You can change your preferences at any time via 'Cookie preferences' at the bottom of every page.
Choose per category which cookies we may place. Read more in our privacy policy.