Municipality in Noord-Brabant
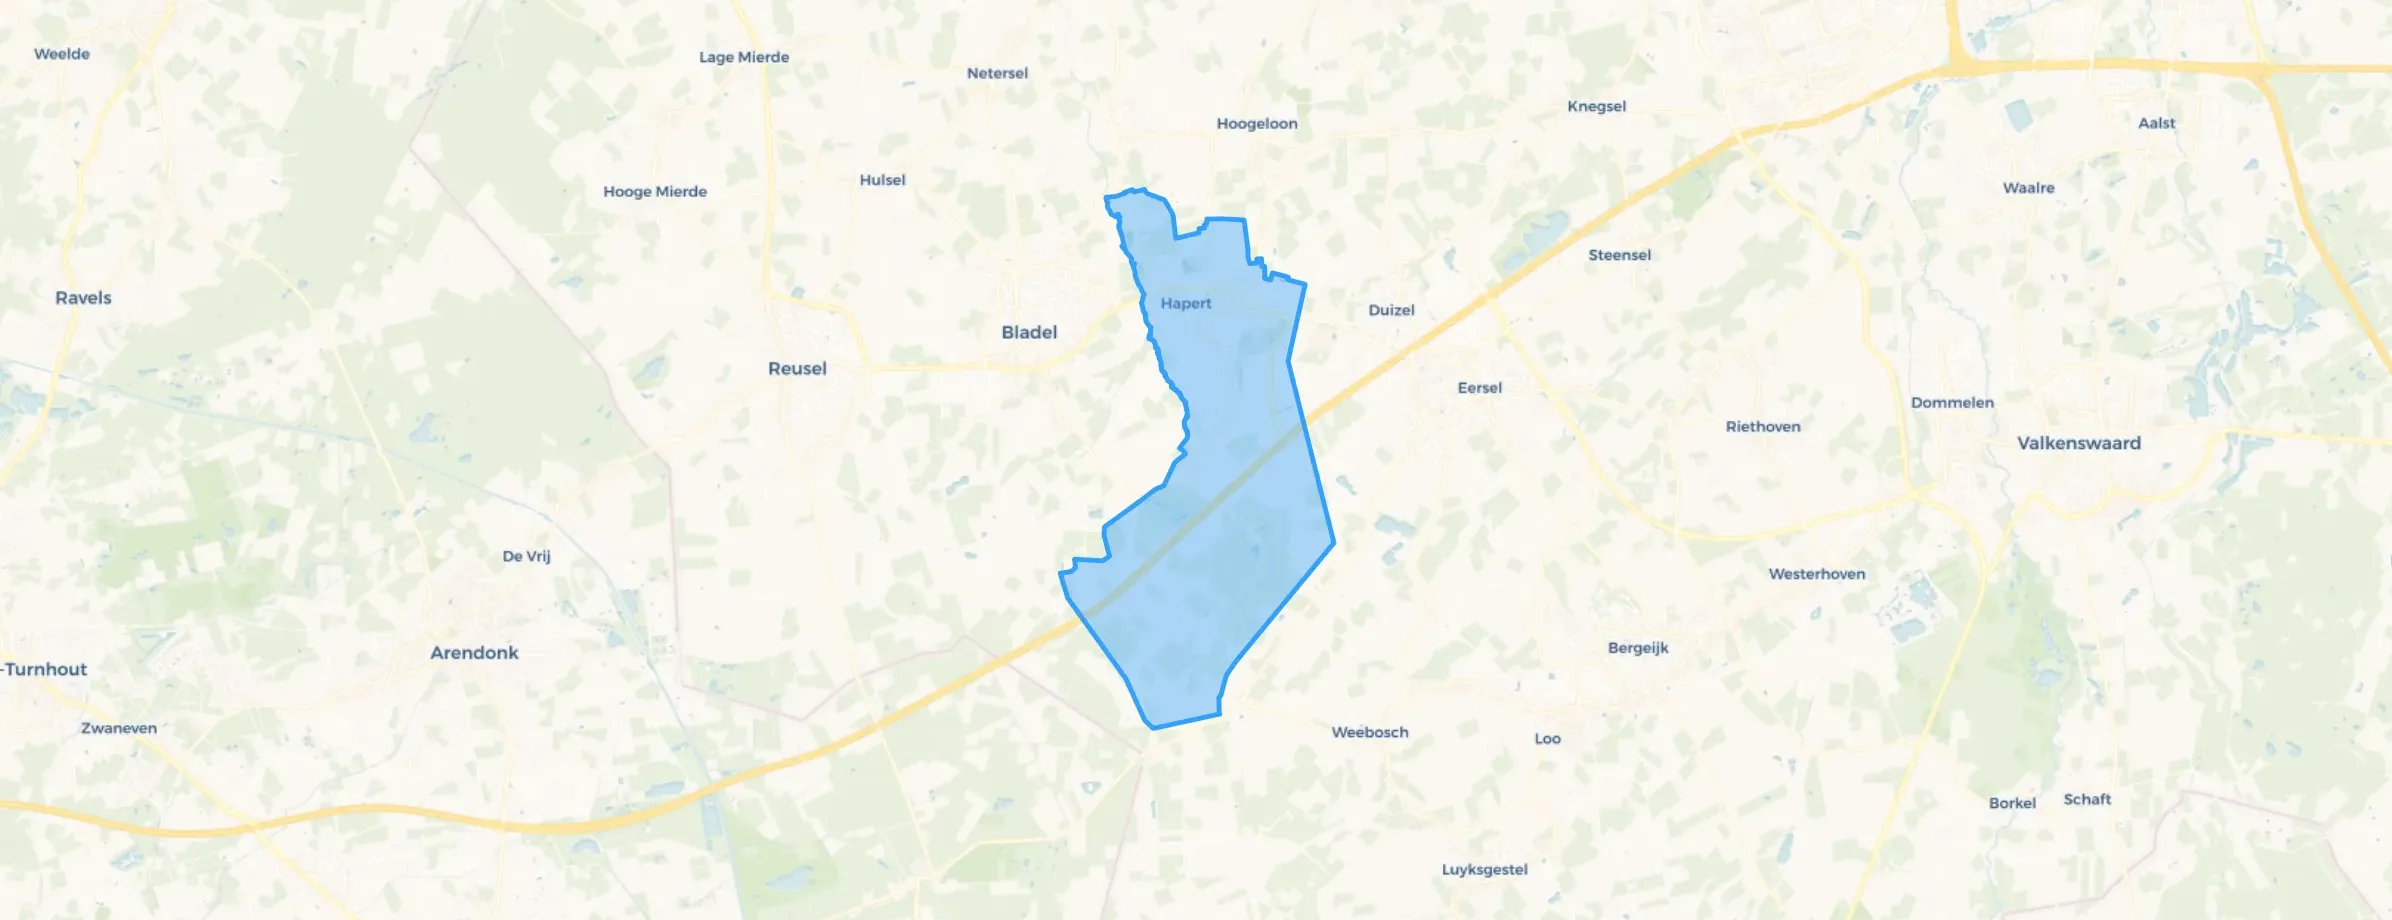
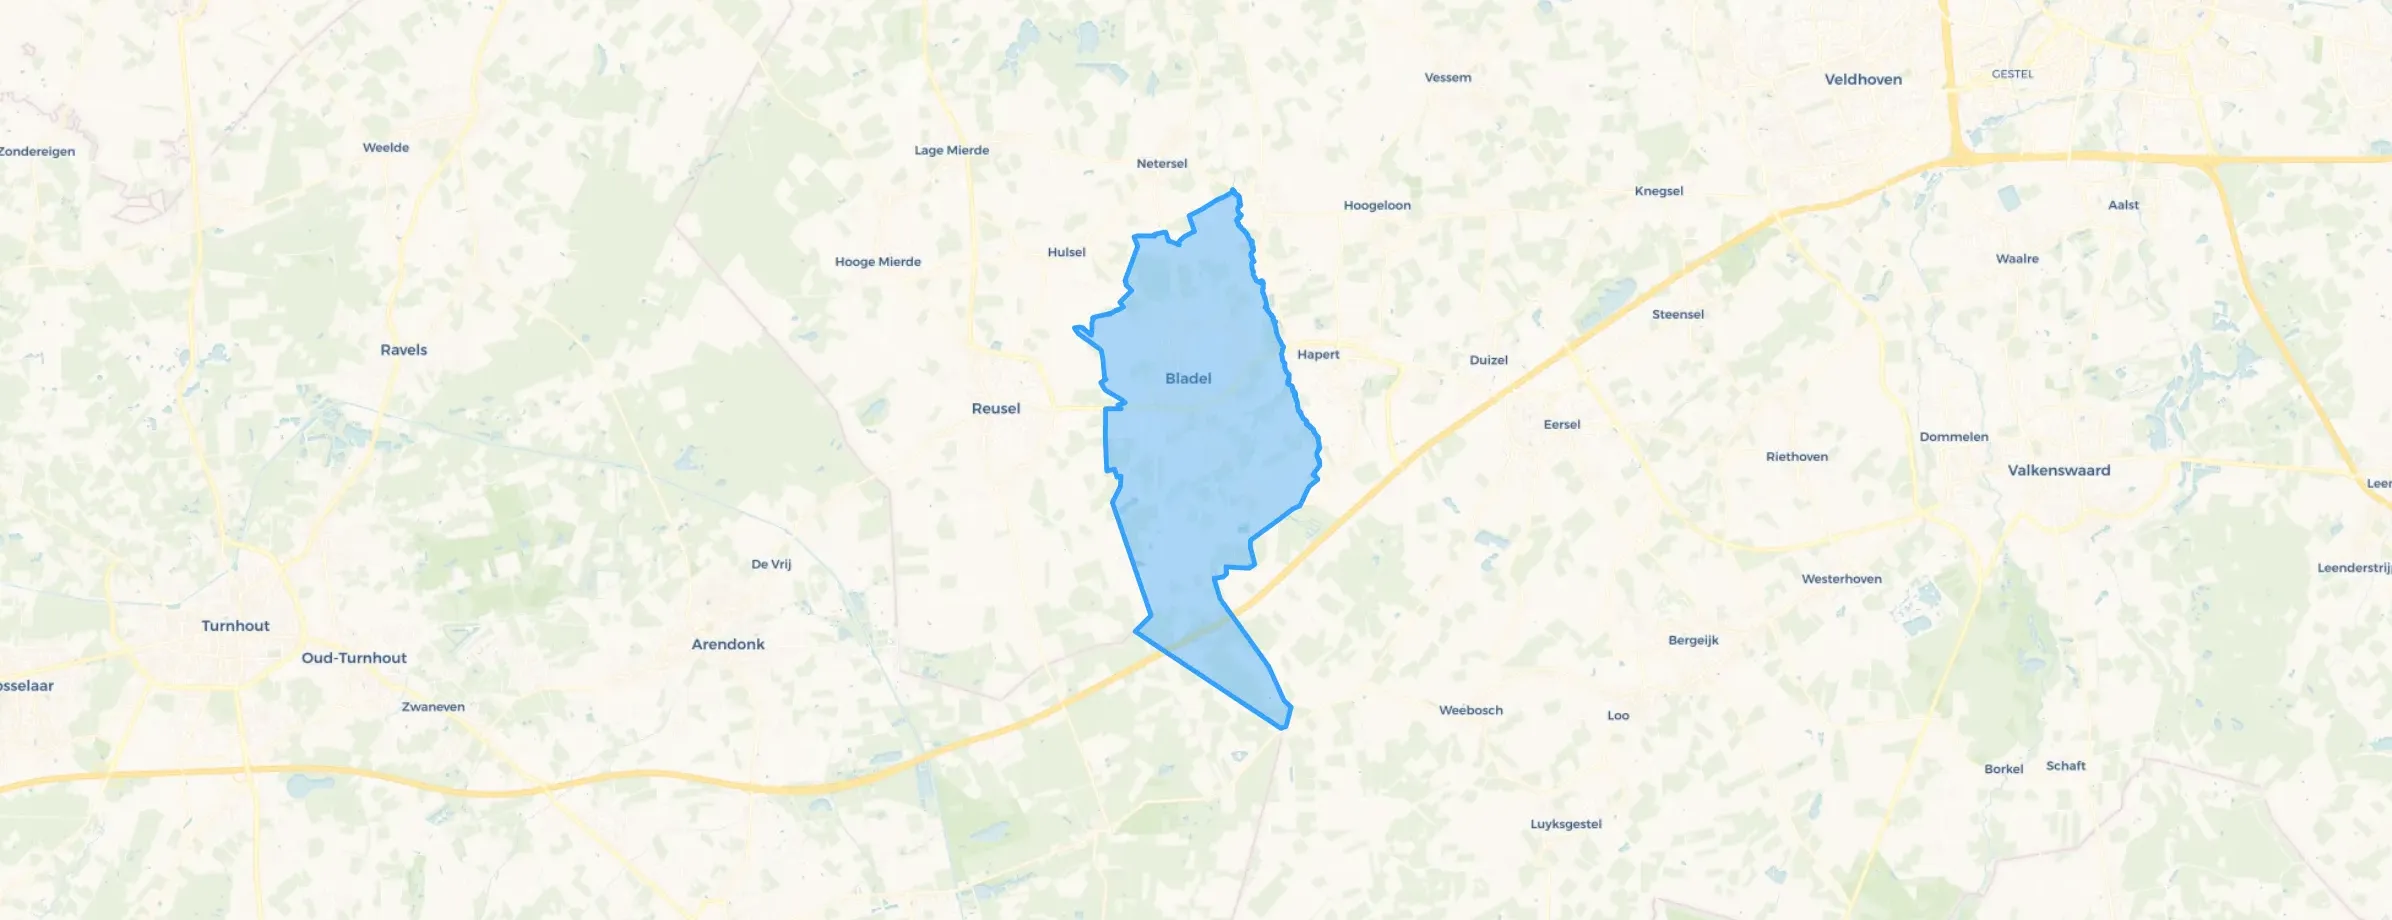
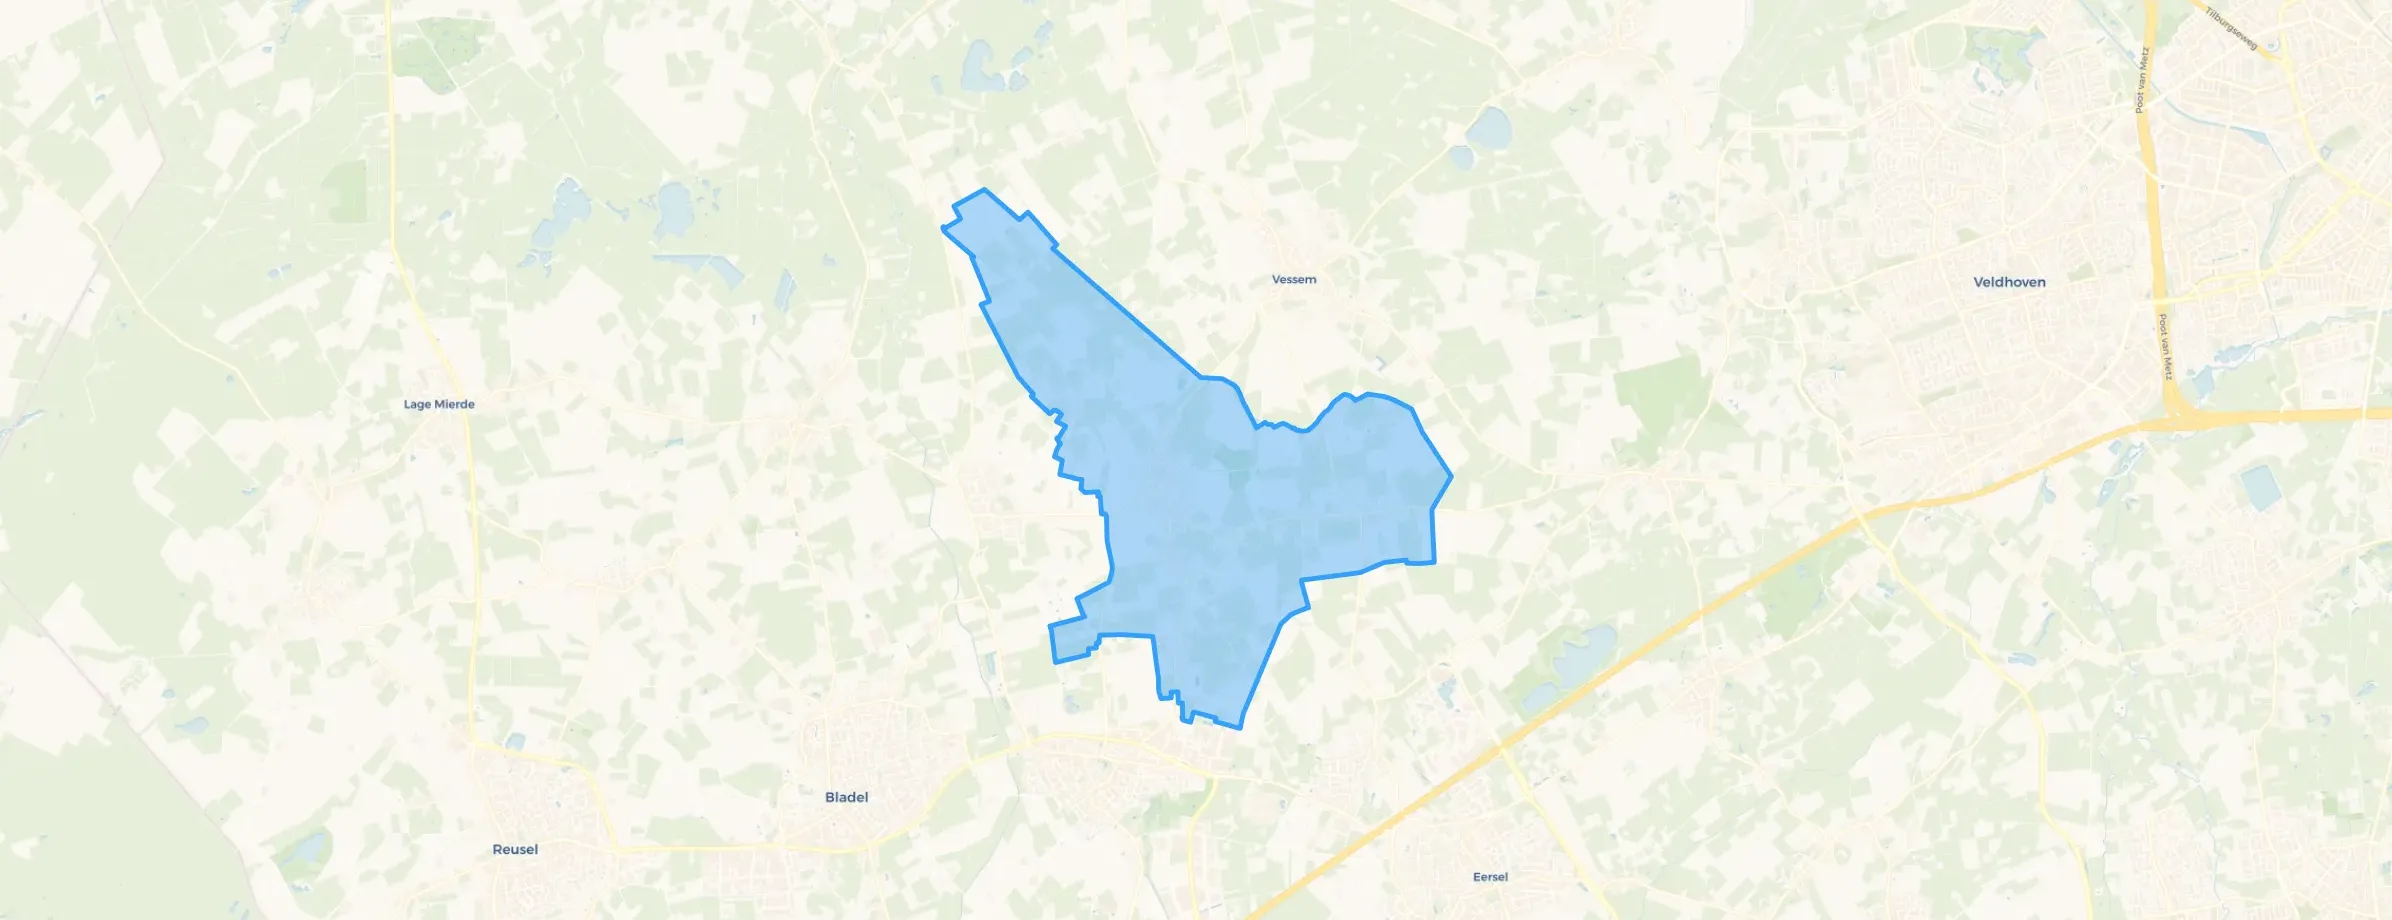
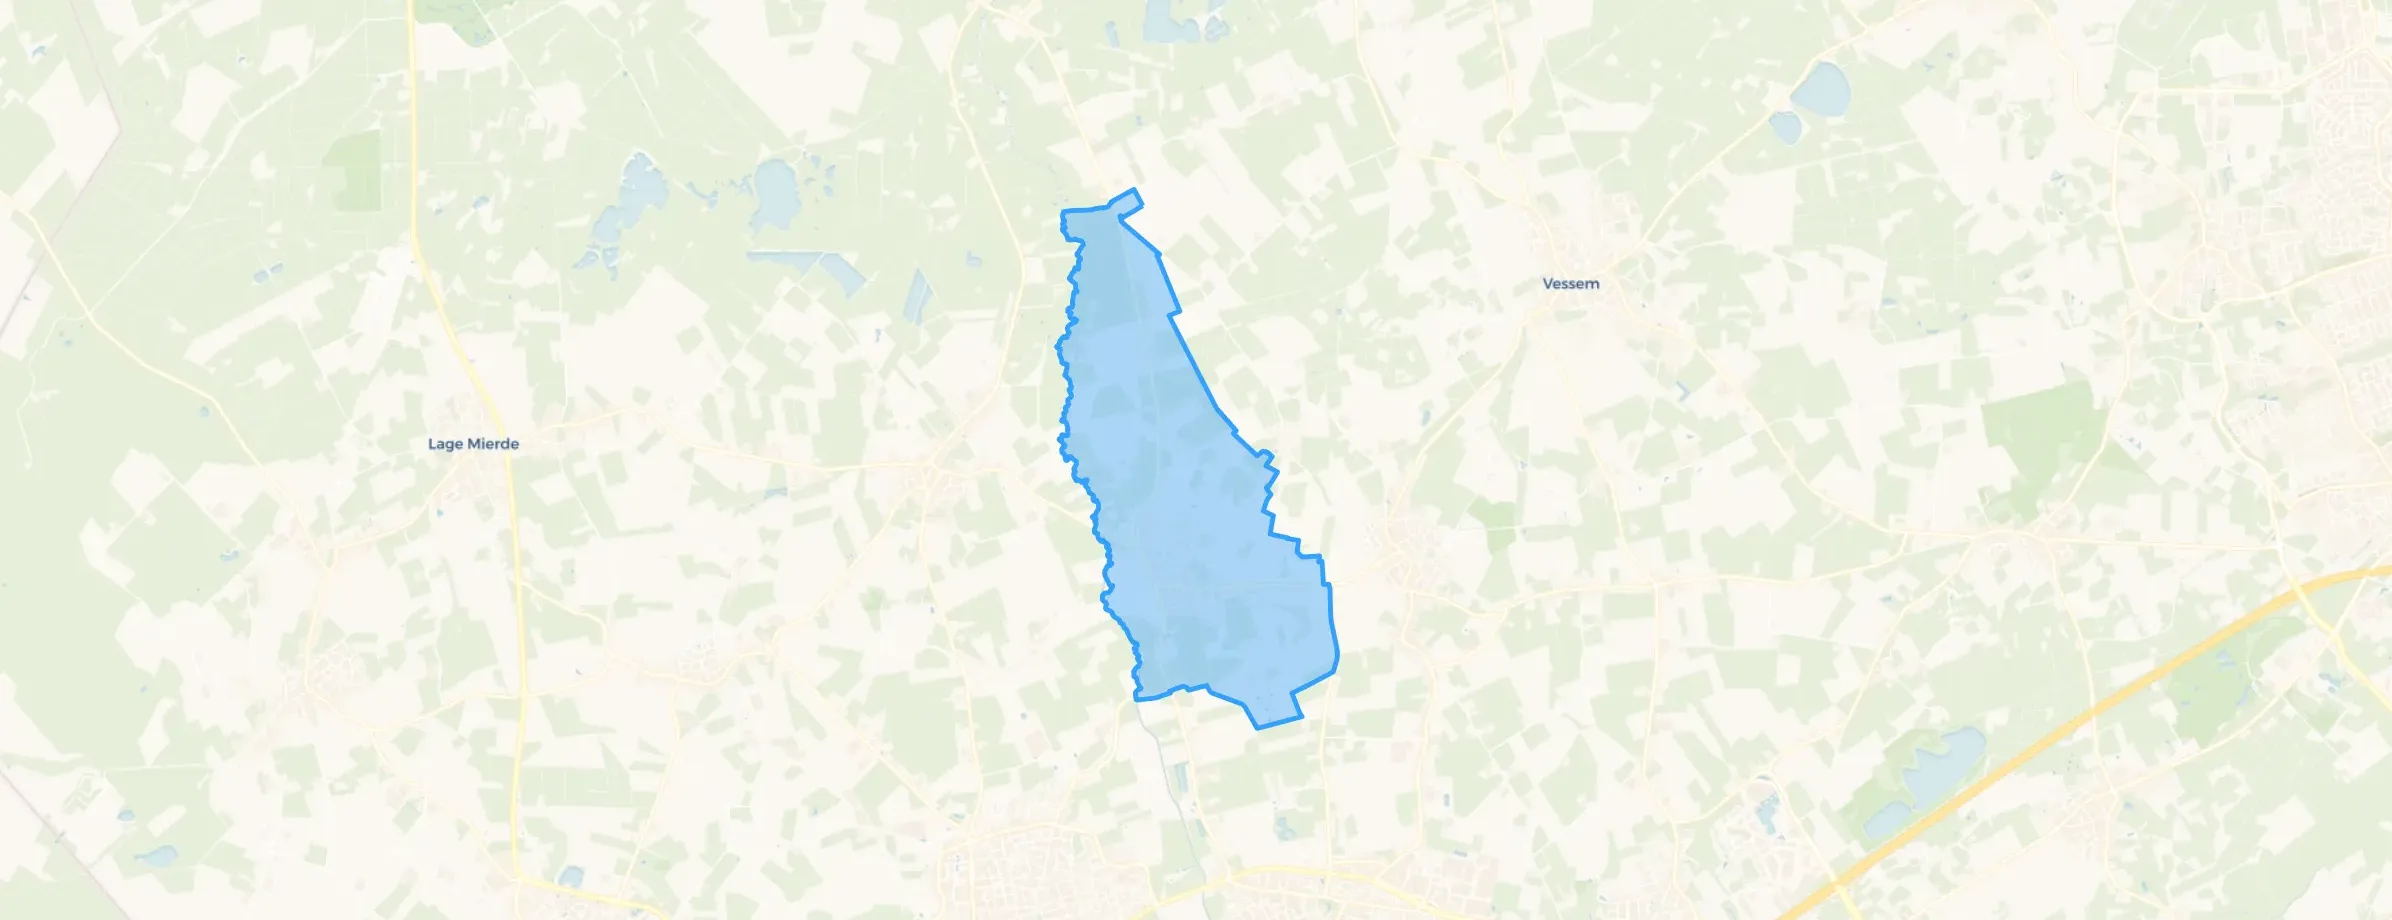
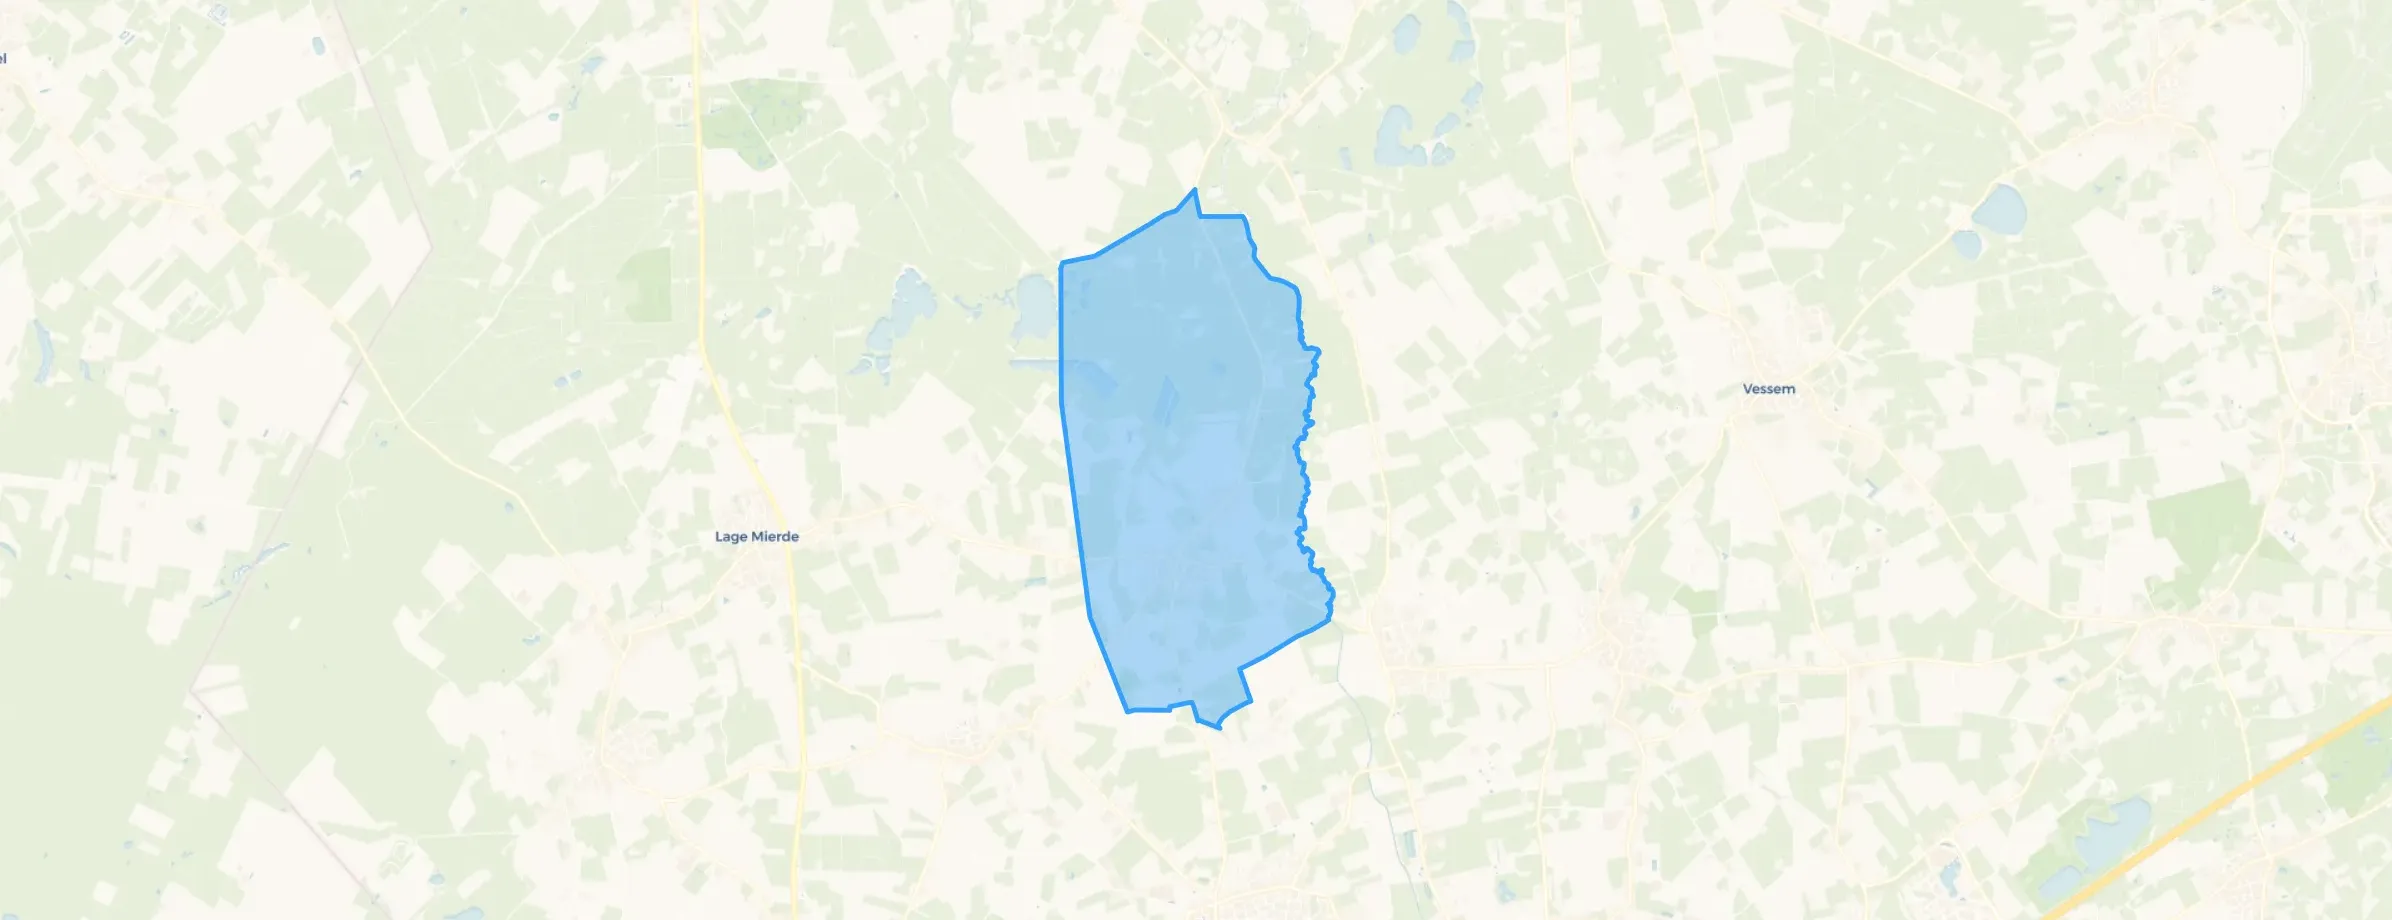
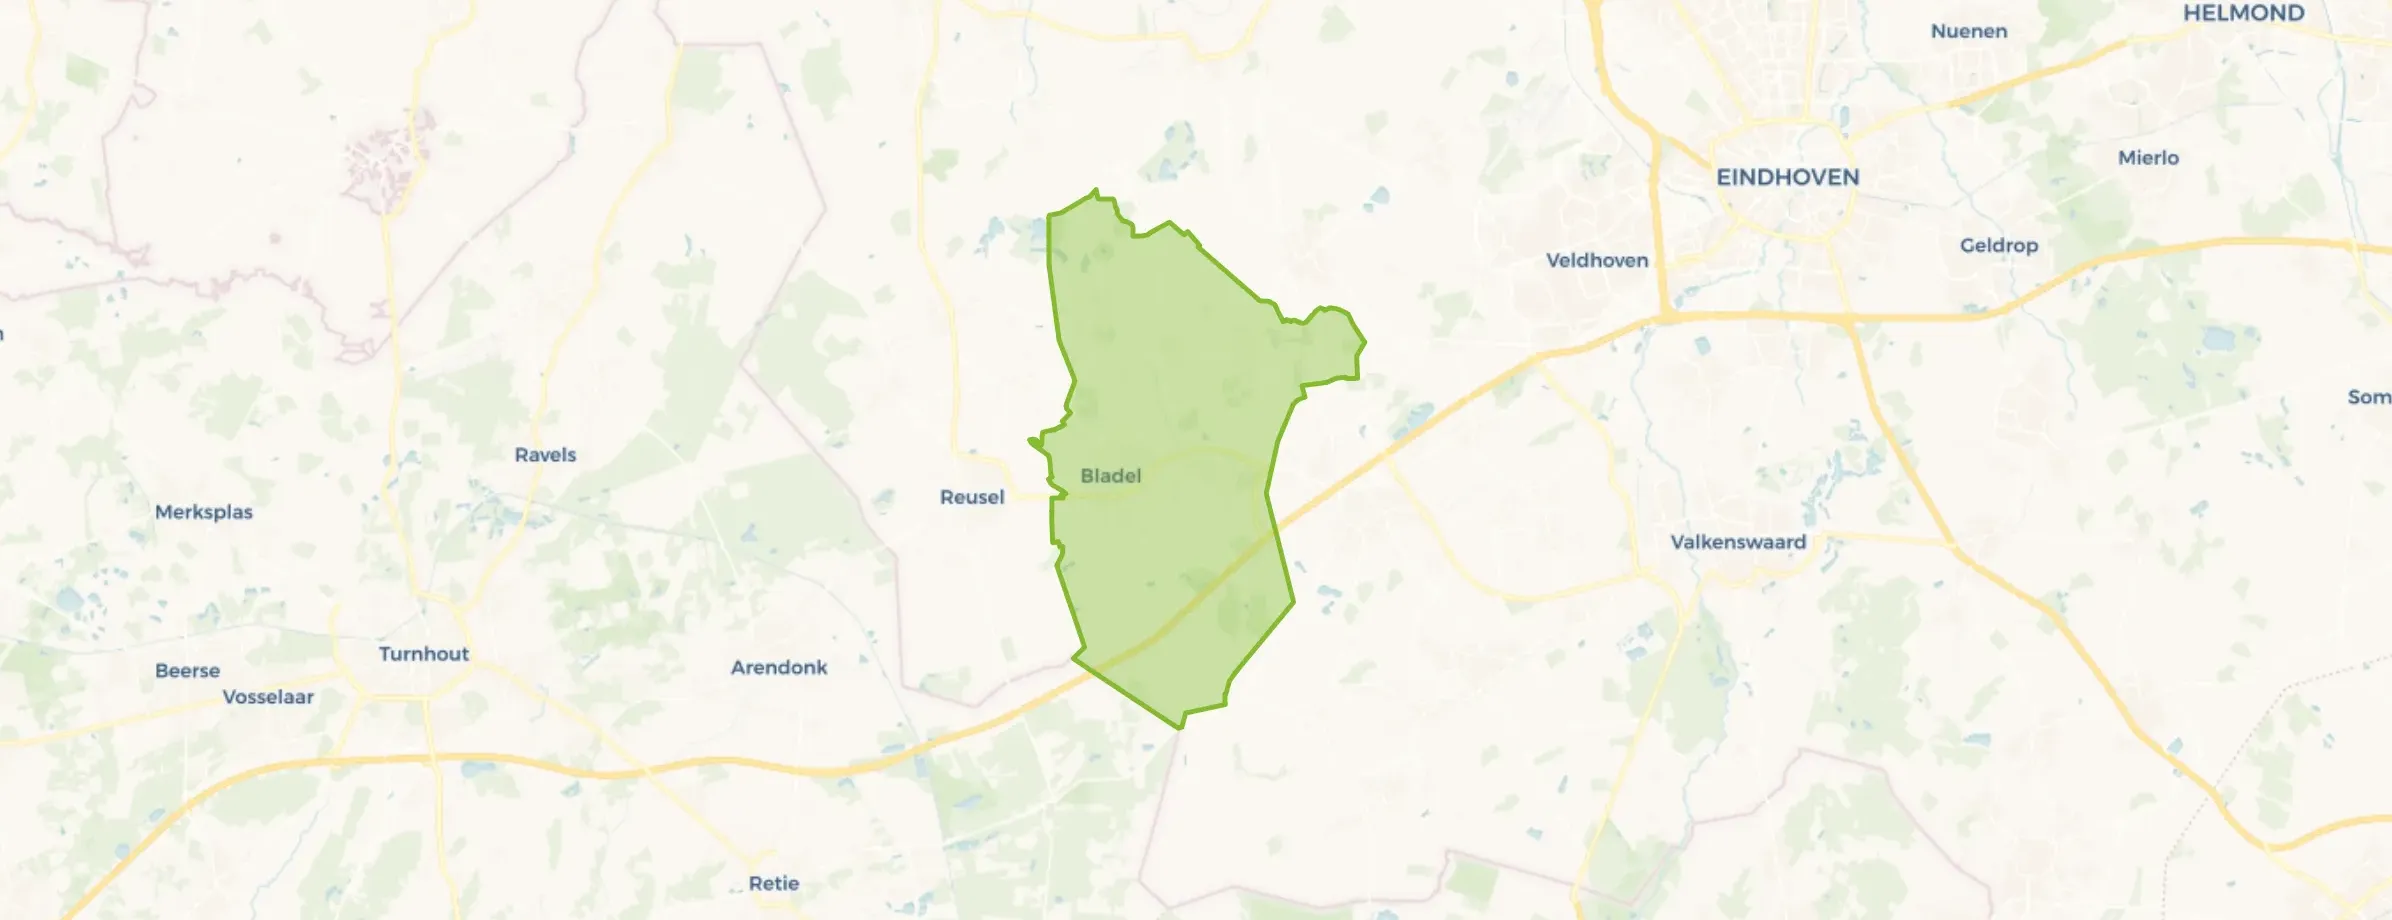
Bladel is located in the province of Noord-Brabant The municipality has a total area of 7.562 hectares, of which 7.533 hectares are land and 29 hectares are water. The municipality is coded as GM1728. The postcode area is 5527AA-5534BJ.
Bladel has 21.006 residents. Of these, 50,9% are men and 49,1% are women. Most residents are 45 to 65 years (27,6%). The other age groups are 24,1% for '65 years or older', 23,3% for '25 to 45 years', 14,1% for '0 to 15 years' and 10,8% for '15 to 25 years'. Of the residents, 44,6% is unmarried, 43,3% is married, 6,6% is divorced and 5,6% is widowed. 18.329 residents originate from the Netherlands, 1.592 come from Europe and 1.085 come from countries outside Europe.
There are 9.198 households in Bladel. 31,7% of these are single-person households, 35,0% households without children and 33,3% households with children. The average household size is 2,3 persons. The national average is 2,1 persons.
In Bladel there are 17.600 income recipients. The average income per income recipient is €40.300, which is €1.900 (5%) lower than the national average of €42.200. Per resident, the average income is €34.300, which is €600 (2%) lower than the national average of €34.900. Most residents of Bladel are educated to an intermediate level. 46,2% have an intermediate education (HAVO, VWO or MBO 2-4), 27,5% have a university or higher professional education (HBO/WO) and 26,2% have a lower education (VMBO or MBO 1).
Of the 21.006 residents, around 78% are in paid employment, which amounts to 16.385 people. This is 6% higher than the national average of 72%. The majority of workers are in salaried employment (82%), while 18% are self-employed. In Bladel, 27% of residents receive a benefit. The largest group is those receiving a state pension (AOW). 4.570 people receive this benefit.
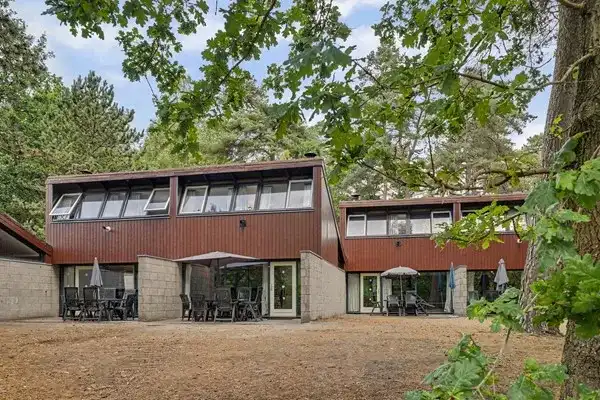
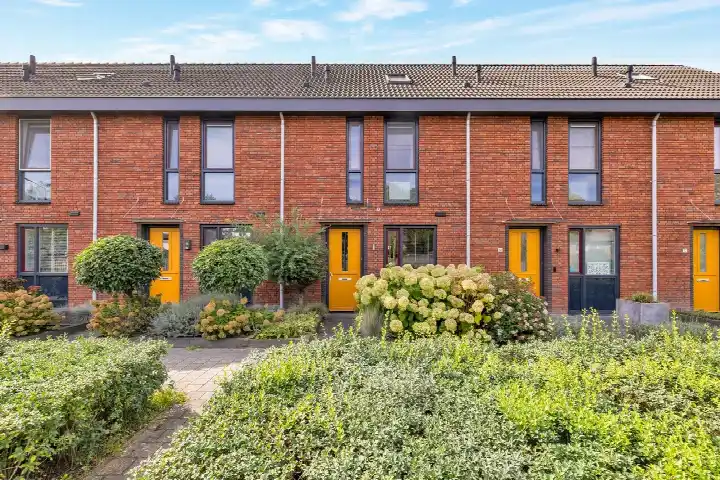
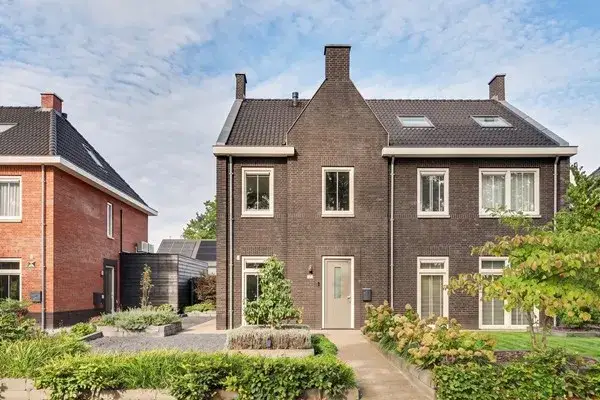
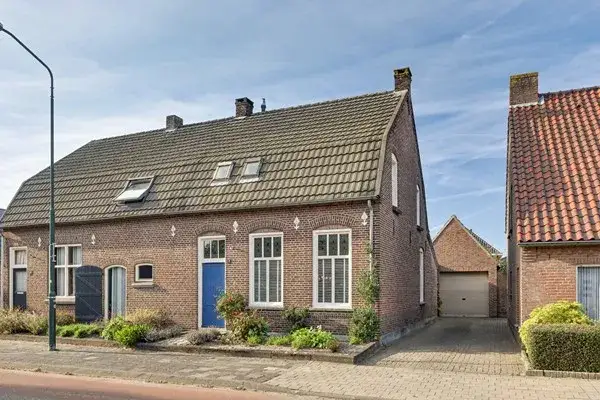
In Bladel there are 9.228 homes with an average assessed value (WOZ) of €445.000. Of these, around 96% are occupied and 4% unoccupied. Most homes are owner-occupied. This amounts to 26% rental homes and 74% owner-occupied homes. Of the homes, 74% privately owned, 14% owned by housing associations and 12% owned by other landlords. The most common construction periods in Bladel are 1970-1980 (24%) and 1950-1970 (18%).
There are currently no homes for sale in Bladel. The most recently listed home is De Wijer 17B by Revast Makelaardij. No homes were sold in Bladel over the past year.
There are currently no homes for rent in Bladel. The most recent home is Jacob Meijerweg 26, offered by www.wooniezie.nl. No homes were let in Bladel over the past year.
No recent rental data available for Bladel.
In Bladel there are 6.173 addresses with a registered energy label. The most common labels are A (30%), C (24%) and B (14%). On average, an address in Bladel uses 3.050 kWh of electricity per year. This is 20% above the national average of 2.550 kWh. Natural gas consumption, at 930 m³ per year, is 16% above the national average of 800 m³.
Fun things are often organised, like a neighbourhood party or Neighbours' Day. There are many very nice people living in the neighbourhood and you can always knock on any door.
Auto-translated to English by AII don't have much experience with the neighbourhood.
Auto-translated to English by AIThe ditch is dirty and there is rubbish everywhere
Auto-translated to English by AIThe neighbourhood parties are fun! And the outings and organised events with the young people are always fun too.
Auto-translated to English by AIHapert-Oost is a rapidly growing neighbourhood with a worse reputation compared to other neighbourhoods in Hapert and the surrounding area. I think this is unjustified because I have always experienced it as very cosy and pleasant. It is a neighbourhood with many different types of residents, which can sometimes lead to clashes (think of a young couple partying late into the night near a house with young children). There are also many different houses and it is easily accessible. However, there are few amenities in the neighbourhood itself, such as a supermarket. The streets are (usually) clean.
Auto-translated to English by AIHoogeloon is a very beautiful village with lots of greenery and freedom. The community is good because many events are held and almost everyone knows everyone. The only downside is that there are very few amenities. Not even a supermarket.
Auto-translated to English by AIThe housing stock is mainly post-war — 58% was built between 1945 and 1990.
Over the past year a home for sale in Bladel was listed for an average of €538,985 (€3,797 per m²).
A rental home in Bladel cost an average of €1,541 per month (€15 per m²). That is 29% below the national average.
Residents give Bladel a 7.6 out of 10 based on 6 reviews. The strongest score is for accessibility (8.3), the weakest for amenities (6.5).
The housing supply in Bladel is remarkably efficient: 56% has an A, A+ or B label. The average natural gas consumption per household is 930 m³ per year.
From Bladel you can on average reach a supermarket at 1.5 km, a GP at 1.3 km, a railway station at 20.4 km, a primary school at 0.8 km (as the crow flies, source: CBS).
Right now you will find 145 homes for sale and 6 homes for rent in Bladel. A home for sale here is listed for an average of 72 days — relatively long for the current market.