Municipality in Zuid-Holland
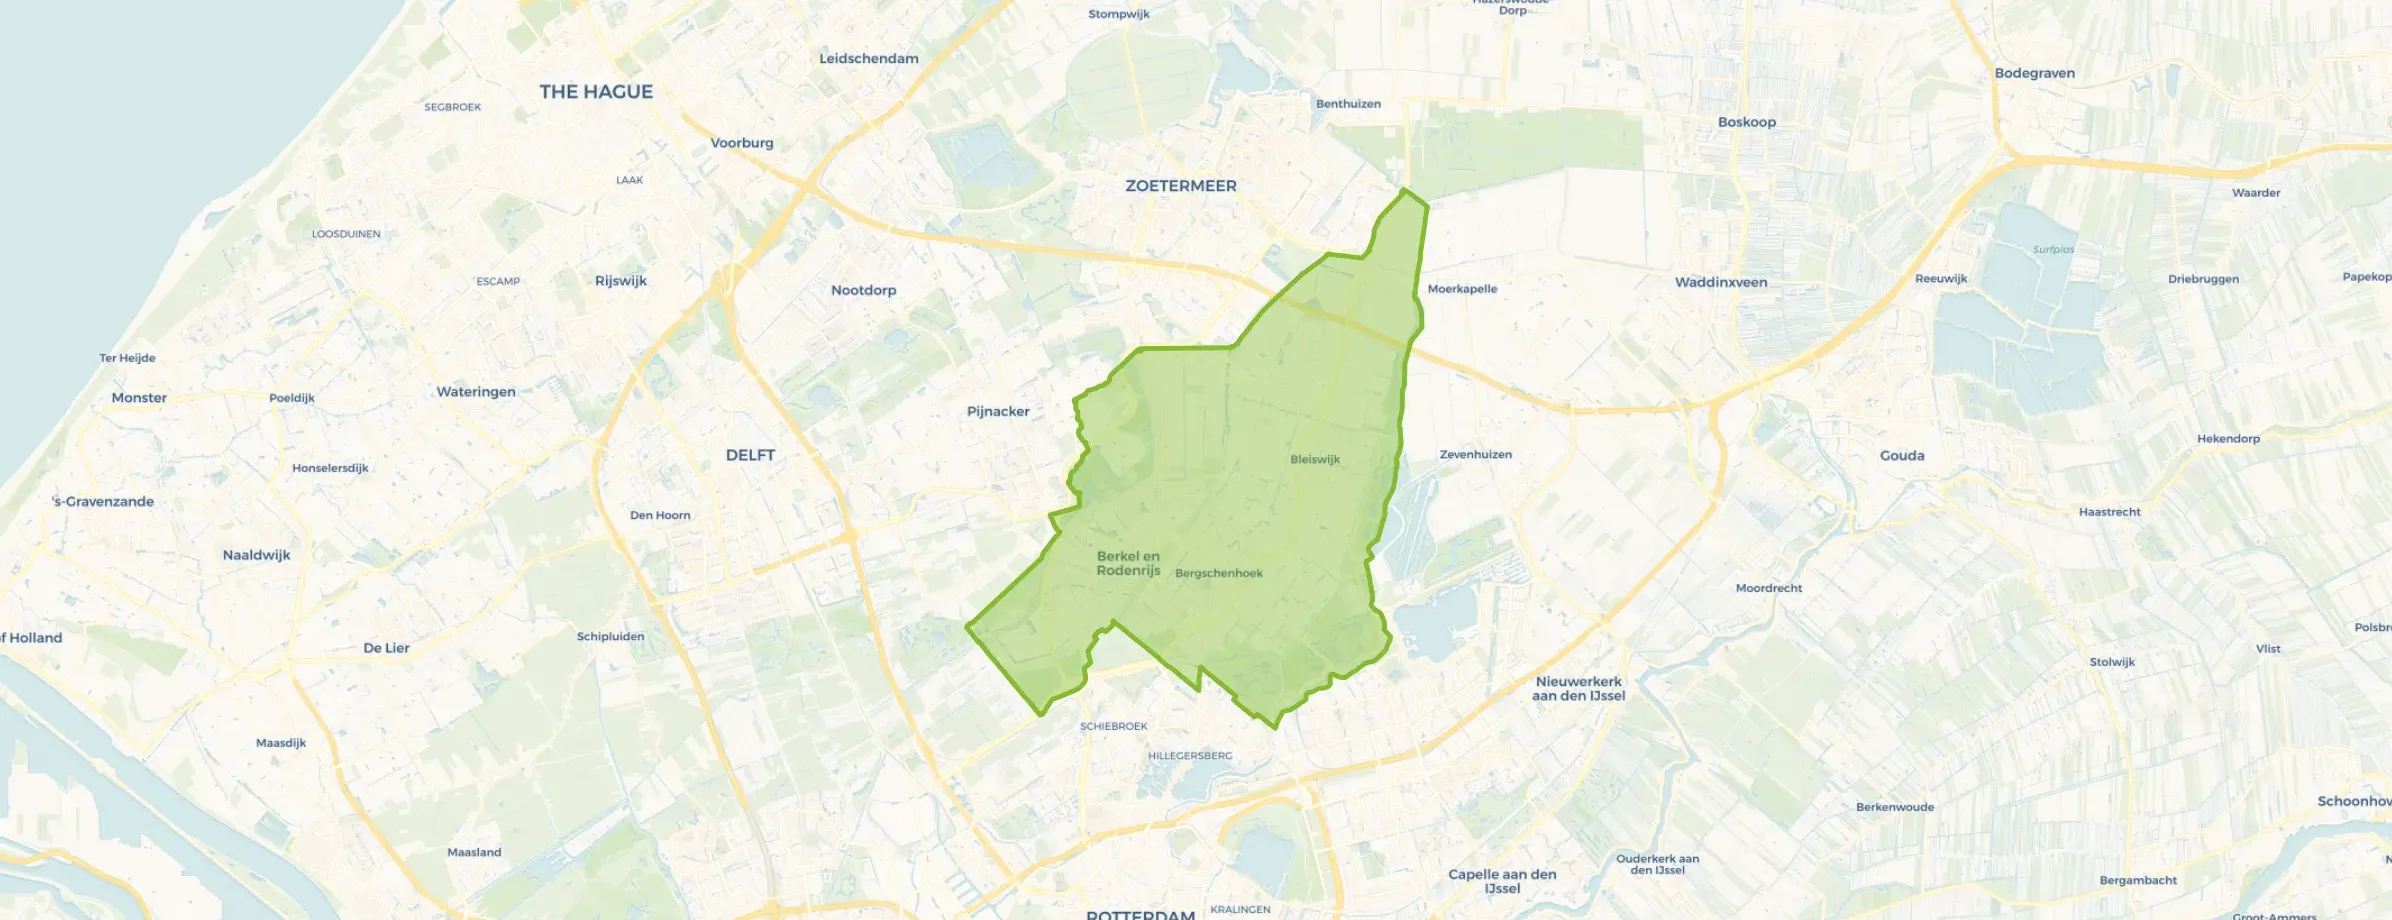
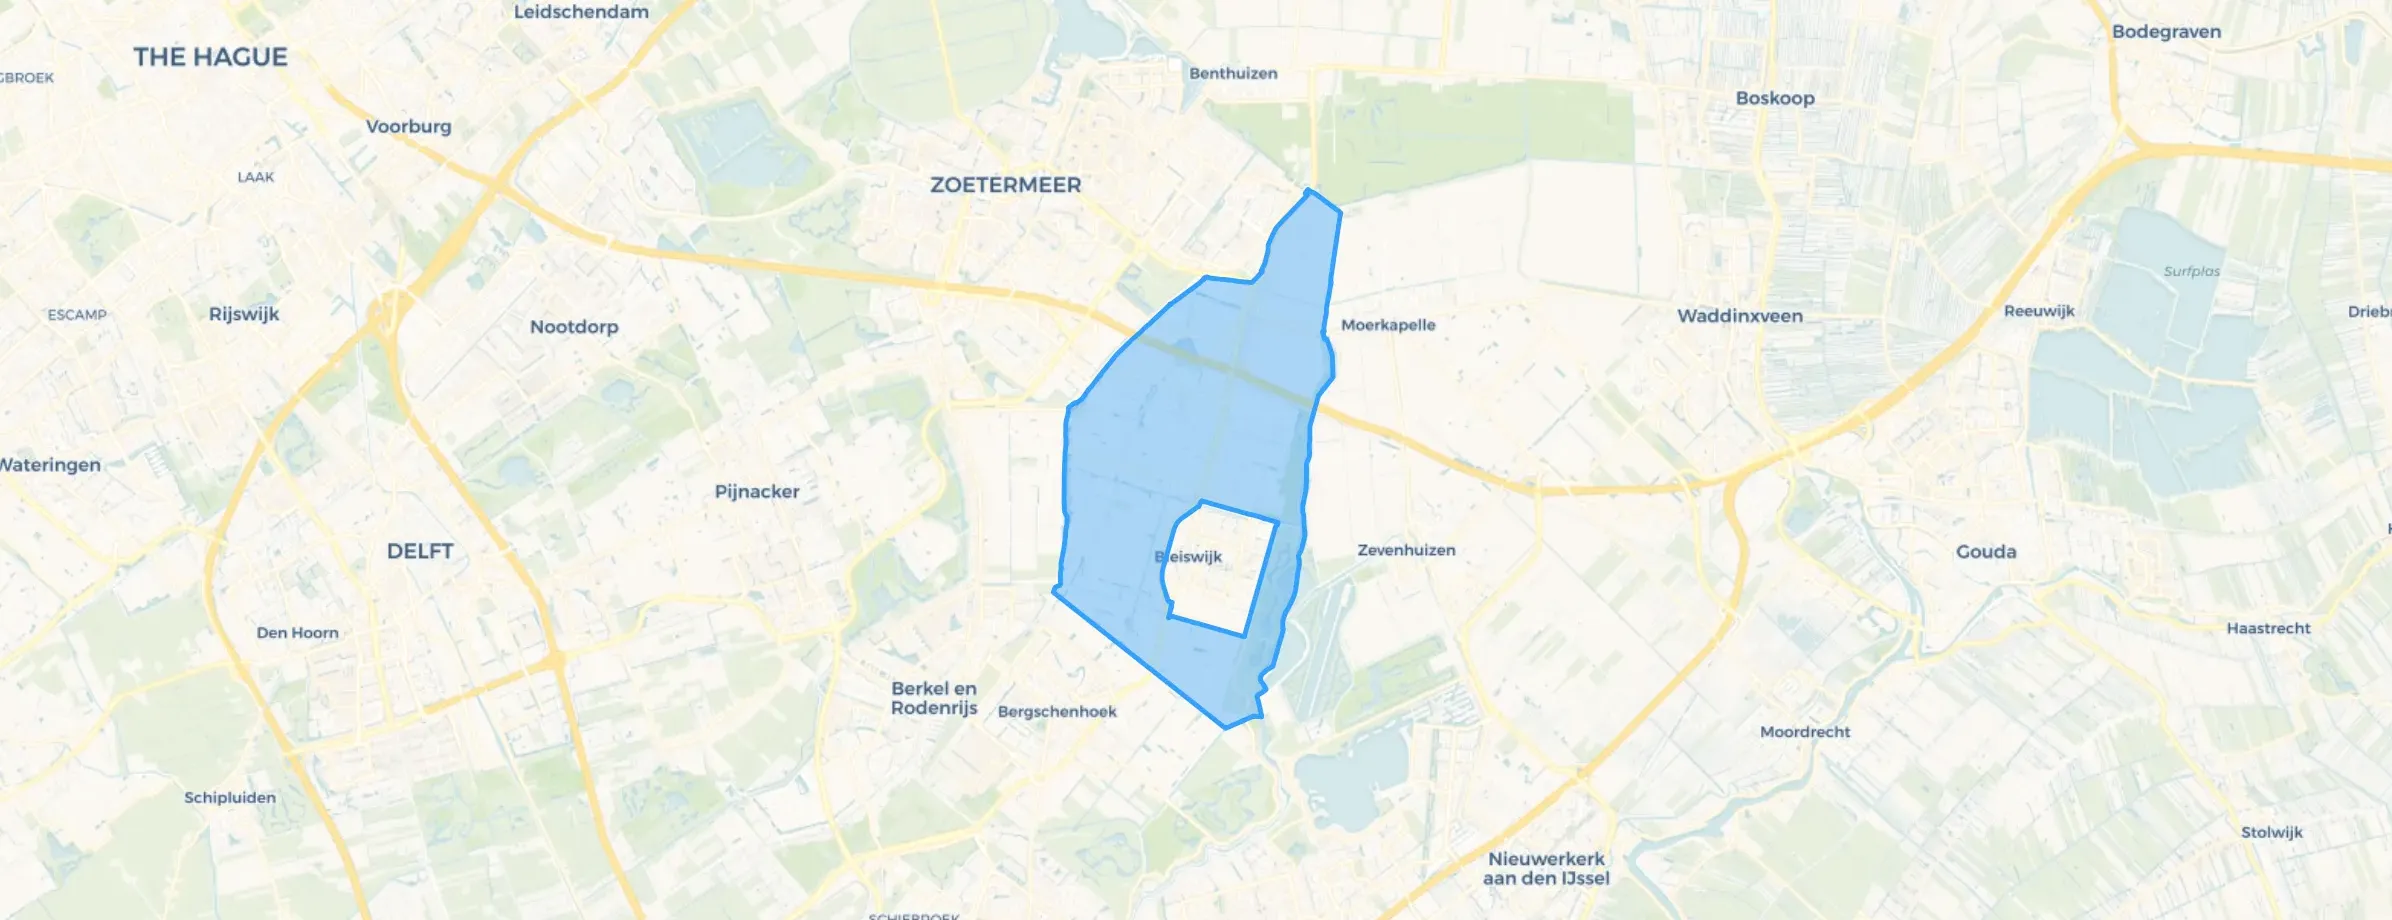
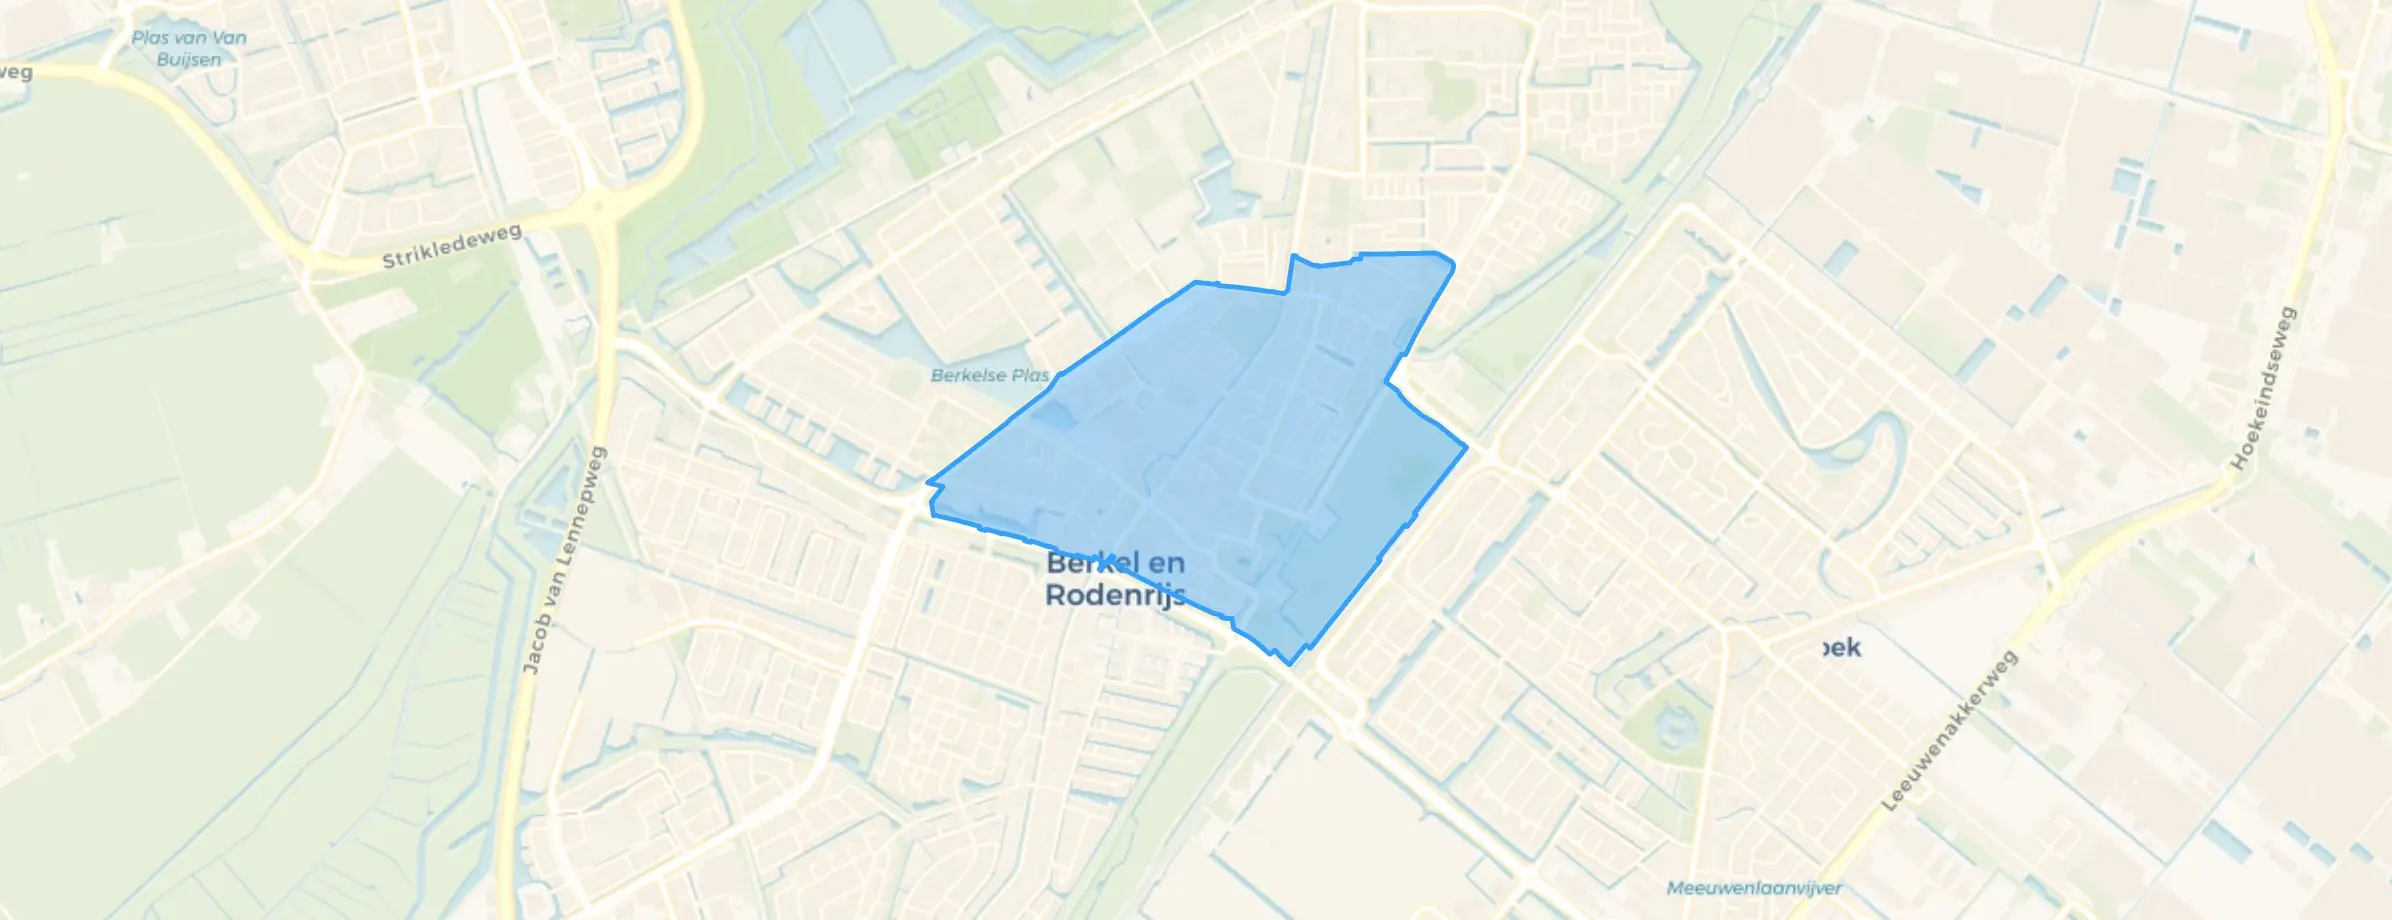
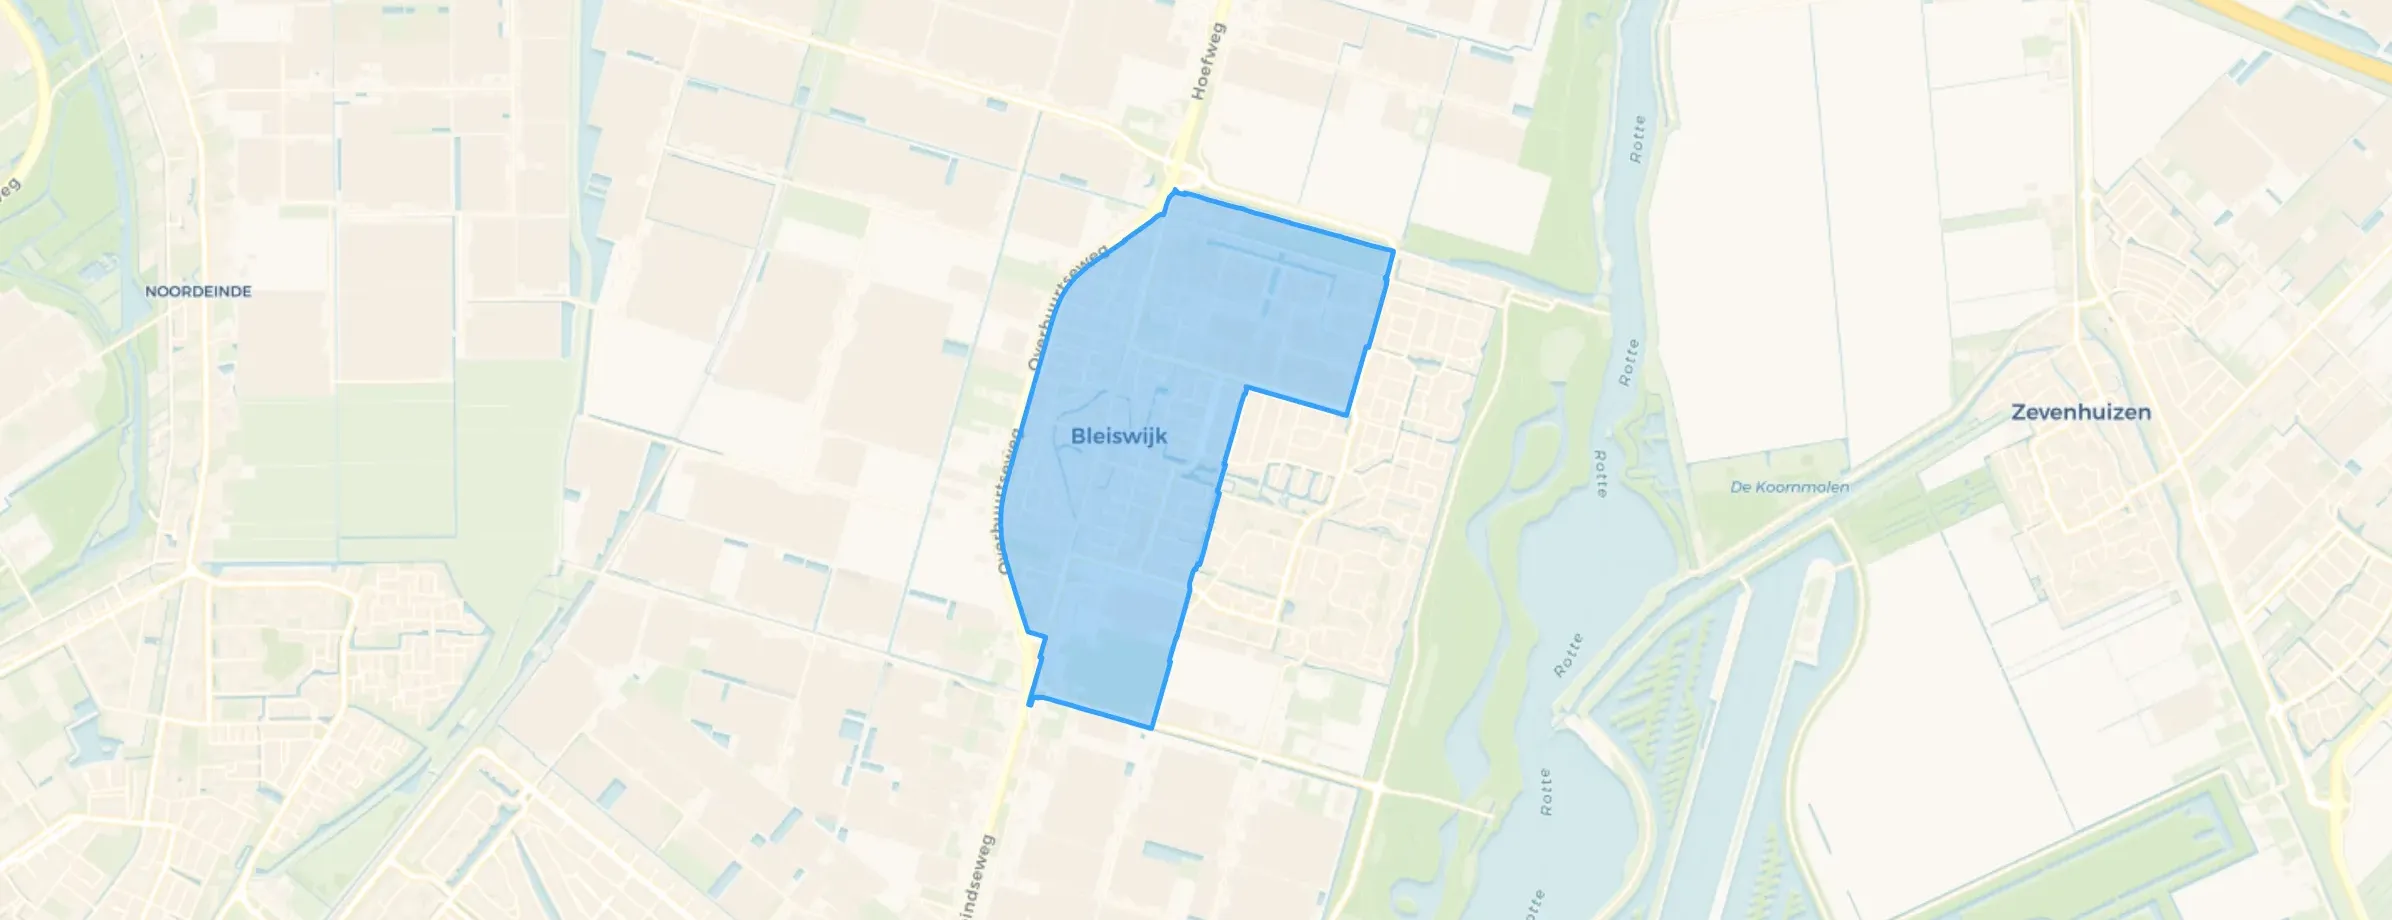
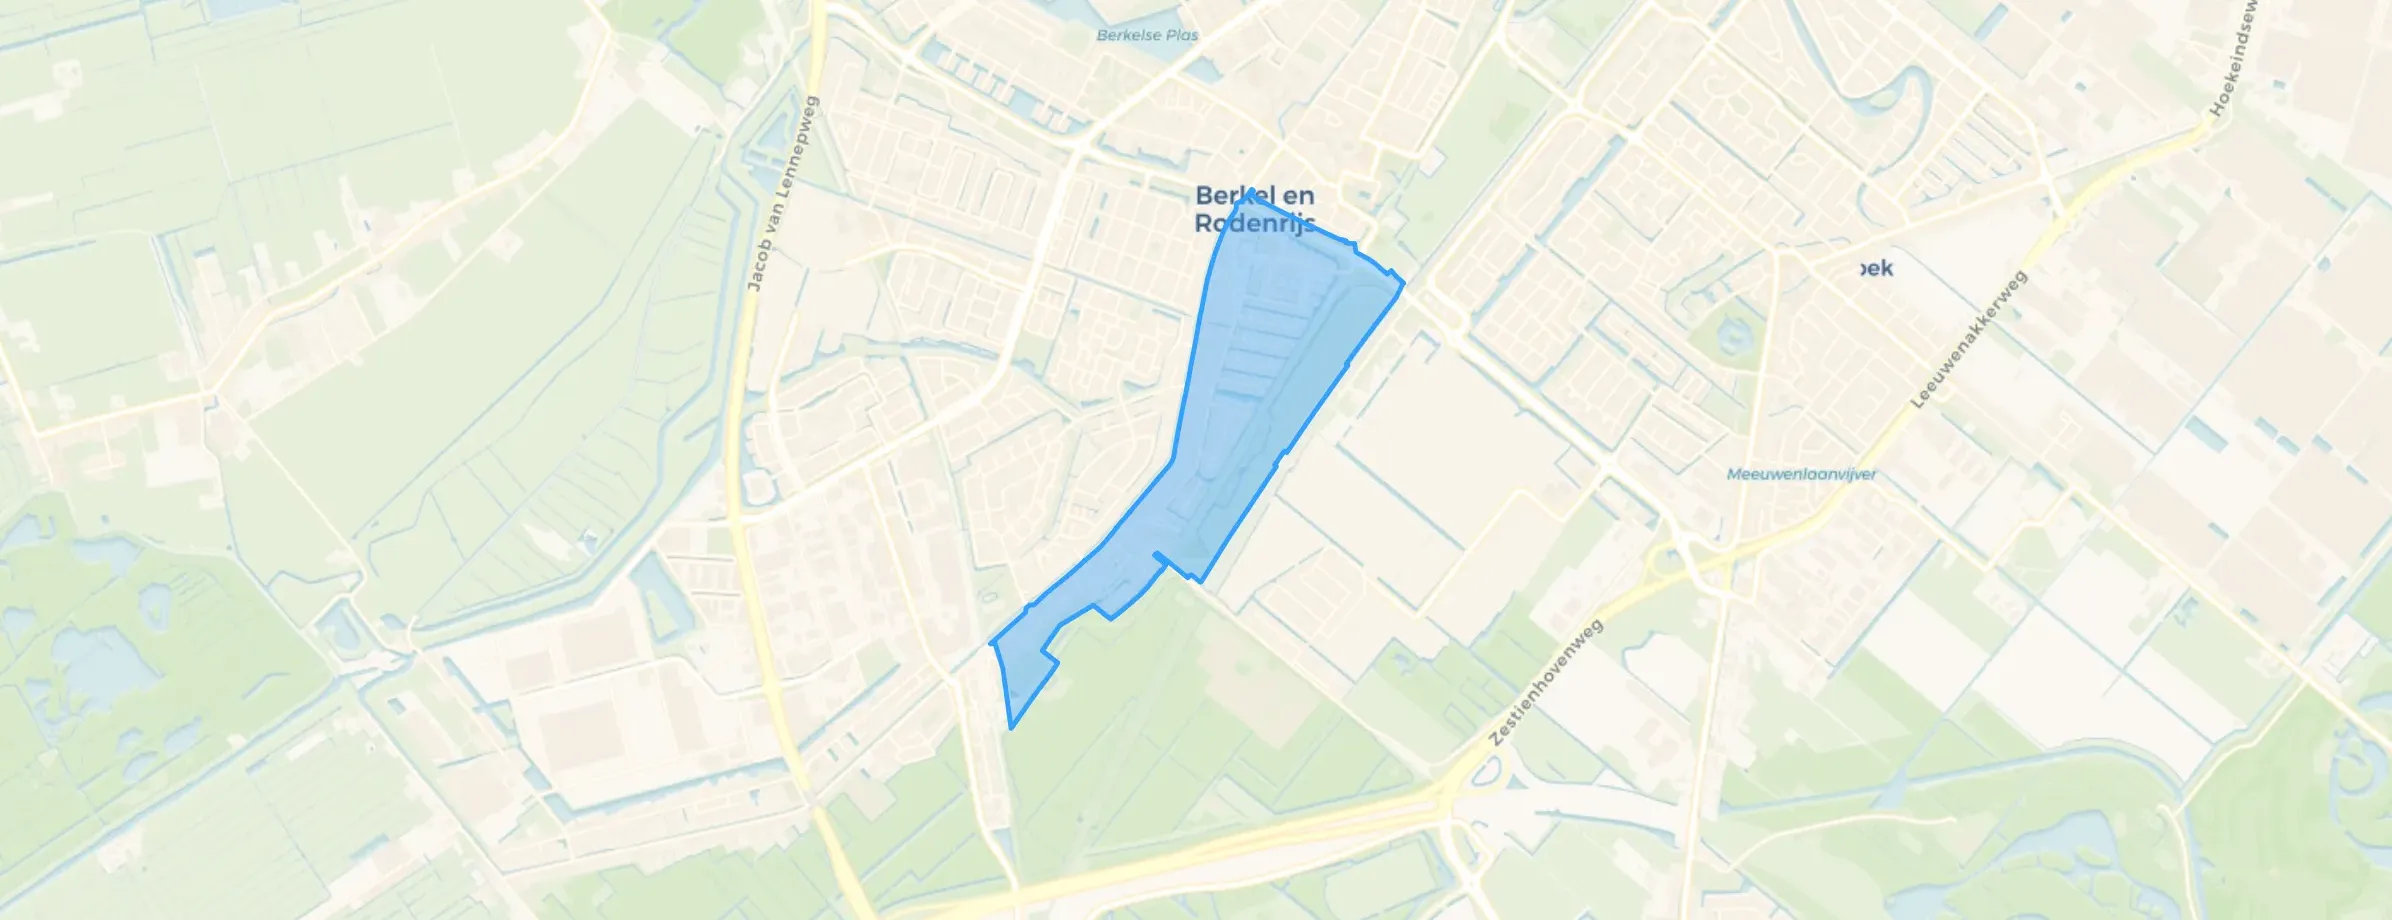
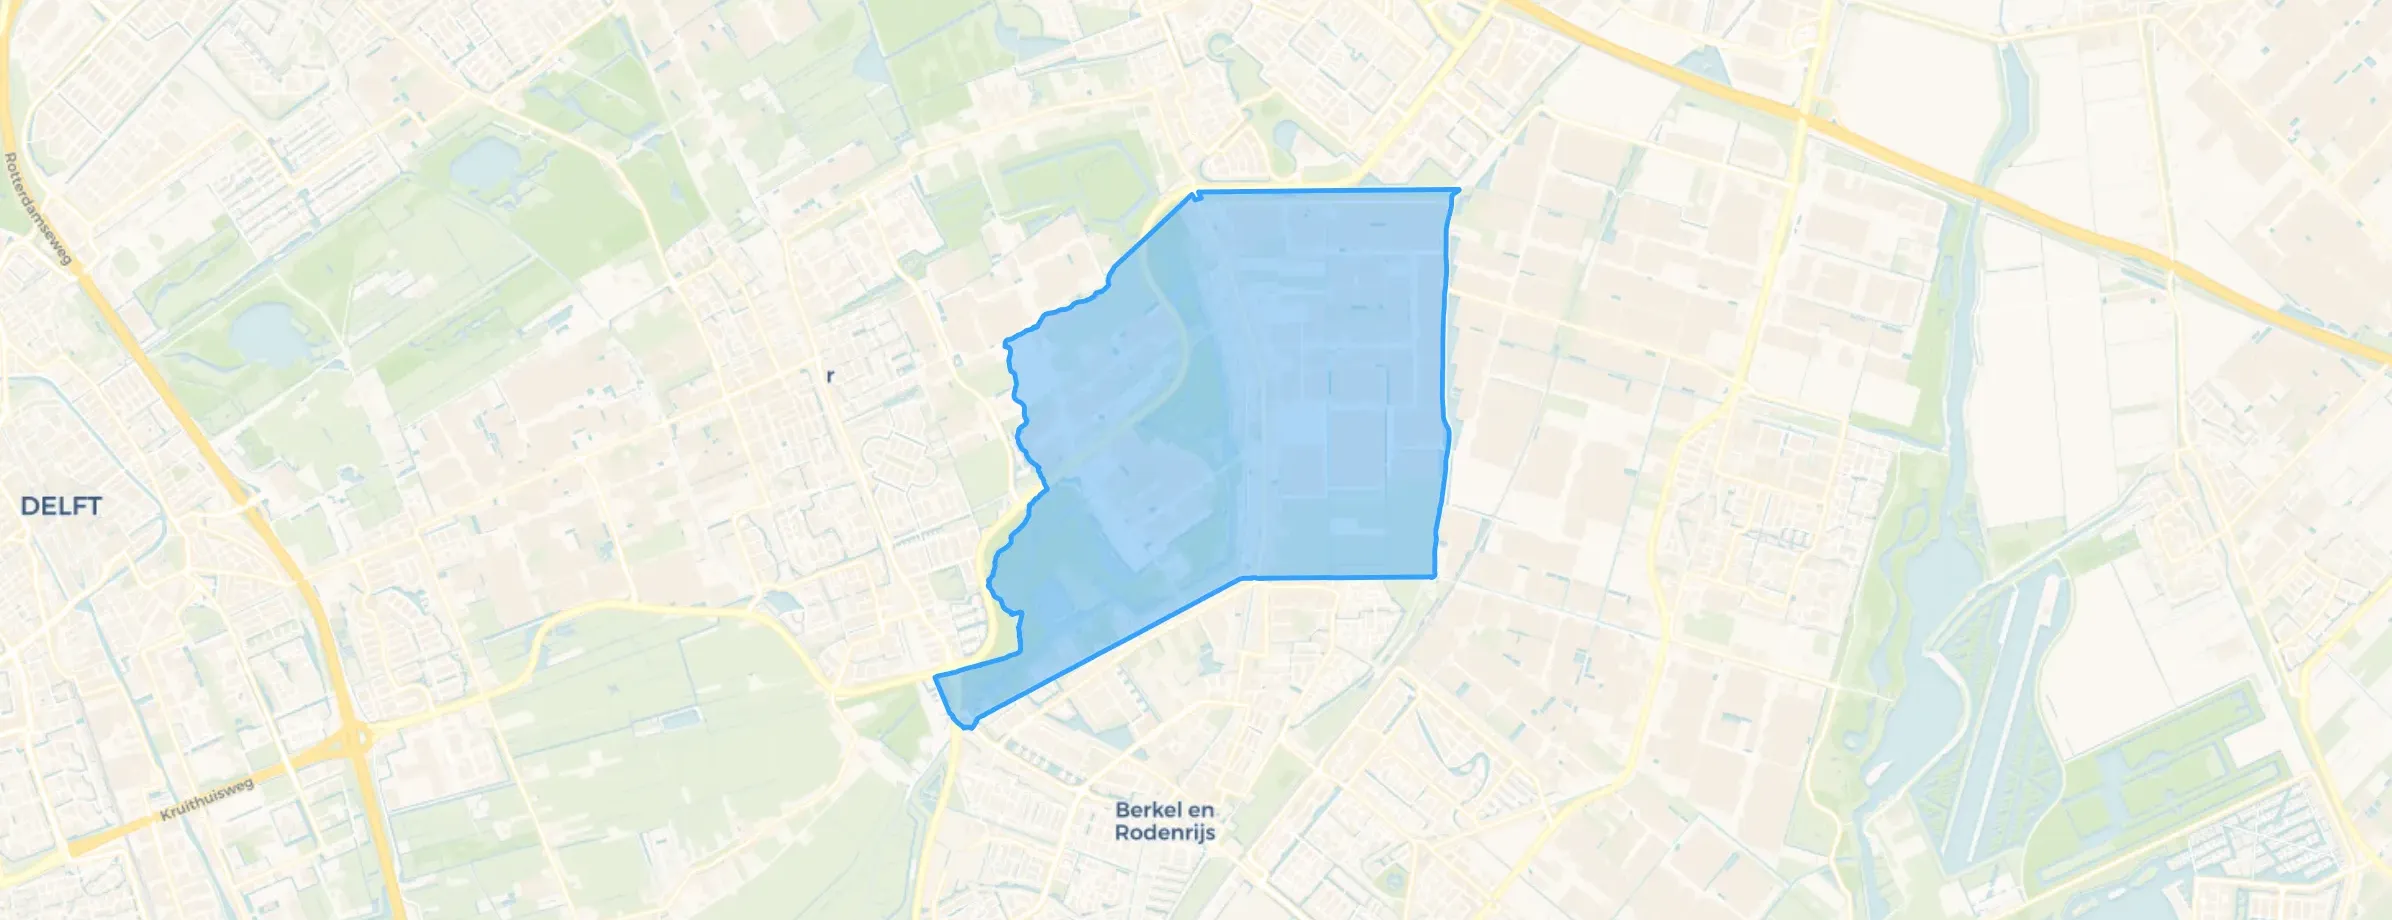
Lansingerland is located in the province of Zuid-Holland The municipality has a total area of 5.639 hectares, of which 5.327 hectares are land and 312 hectares are water. The municipality is coded as GM1621. The postcode area is 2651AA-2665XP.
Lansingerland has 66.064 residents. Of these, 49,4% are men and 50,6% are women. Most residents are 45 to 65 years (28,2%). The other age groups are 23,1% for '25 to 45 years', 19,7% for '0 to 15 years', 16,8% for '65 years or older' and 12,1% for '15 to 25 years'. Of the residents, 48,4% is unmarried, 41,6% is married, 6,2% is divorced and 3,8% is widowed. 50.464 residents originate from the Netherlands, 4.124 come from Europe and 11.476 come from countries outside Europe.
There are 25.852 households in Lansingerland. 24,8% of these are single-person households, 28,1% households without children and 47,1% households with children. The average household size is 2,5 persons. The national average is 2,1 persons.
In Lansingerland there are 50.500 income recipients. The average income per income recipient is €50.700, which is €8.500 (20%) higher than the national average of €42.200. Per resident, the average income is €39.500, which is €4.600 (13%) higher than the national average of €34.900. Most residents of Lansingerland are highly educated. 41,0% have a university or higher professional education (HBO/WO), 37,3% have an intermediate education (HAVO, VWO or MBO 2-4) and 21,7% have a lower education (VMBO or MBO 1).
Of the 66.064 residents, around 78% are in paid employment, which amounts to 51.530 people. This is 6% higher than the national average of 72%. The majority of workers are in salaried employment (82%), while 18% are self-employed. In Lansingerland, 20% of residents receive a benefit. The largest group is those receiving a state pension (AOW). 10.040 people receive this benefit.
In Lansingerland there are 25.791 homes with an average assessed value (WOZ) of €505.000. Of these, around 98% are occupied and 2% unoccupied. Most homes are owner-occupied. This amounts to 27% rental homes and 73% owner-occupied homes. Of the homes, 73% privately owned, 19% owned by housing associations and 8% owned by other landlords. The most common construction periods in Lansingerland are 2000-2010 (23%) and 2010-2020 (15%).
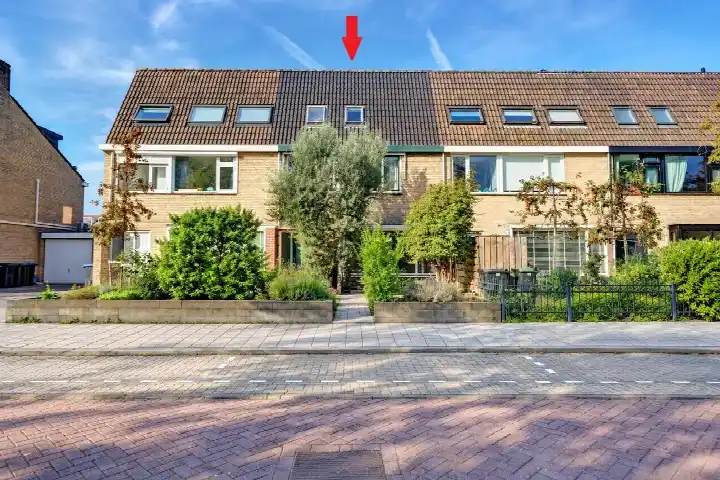
There are currently no homes for sale in Lansingerland. The most recently listed home is Berkelsezoom 44 by Ooms Makelaars Lansingerland op Funda. No homes were sold in Lansingerland over the past year.
There are currently no homes for rent in Lansingerland. The most recent home is Varenkade 39, offered by Immobilia | Vastgoed & Makelaardij op Funda. No homes were let in Lansingerland over the past year.
No recent rental data available for Lansingerland.
In Lansingerland there are 17.668 addresses with a registered energy label. The most common labels are A (49%), B (14%) and C (13%). On average, an address in Lansingerland uses 2.890 kWh of electricity per year. This is 13% above the national average of 2.550 kWh. With an annual consumption of 760 m³ per address, natural gas consumption is 5% below the national average of 800 m³.
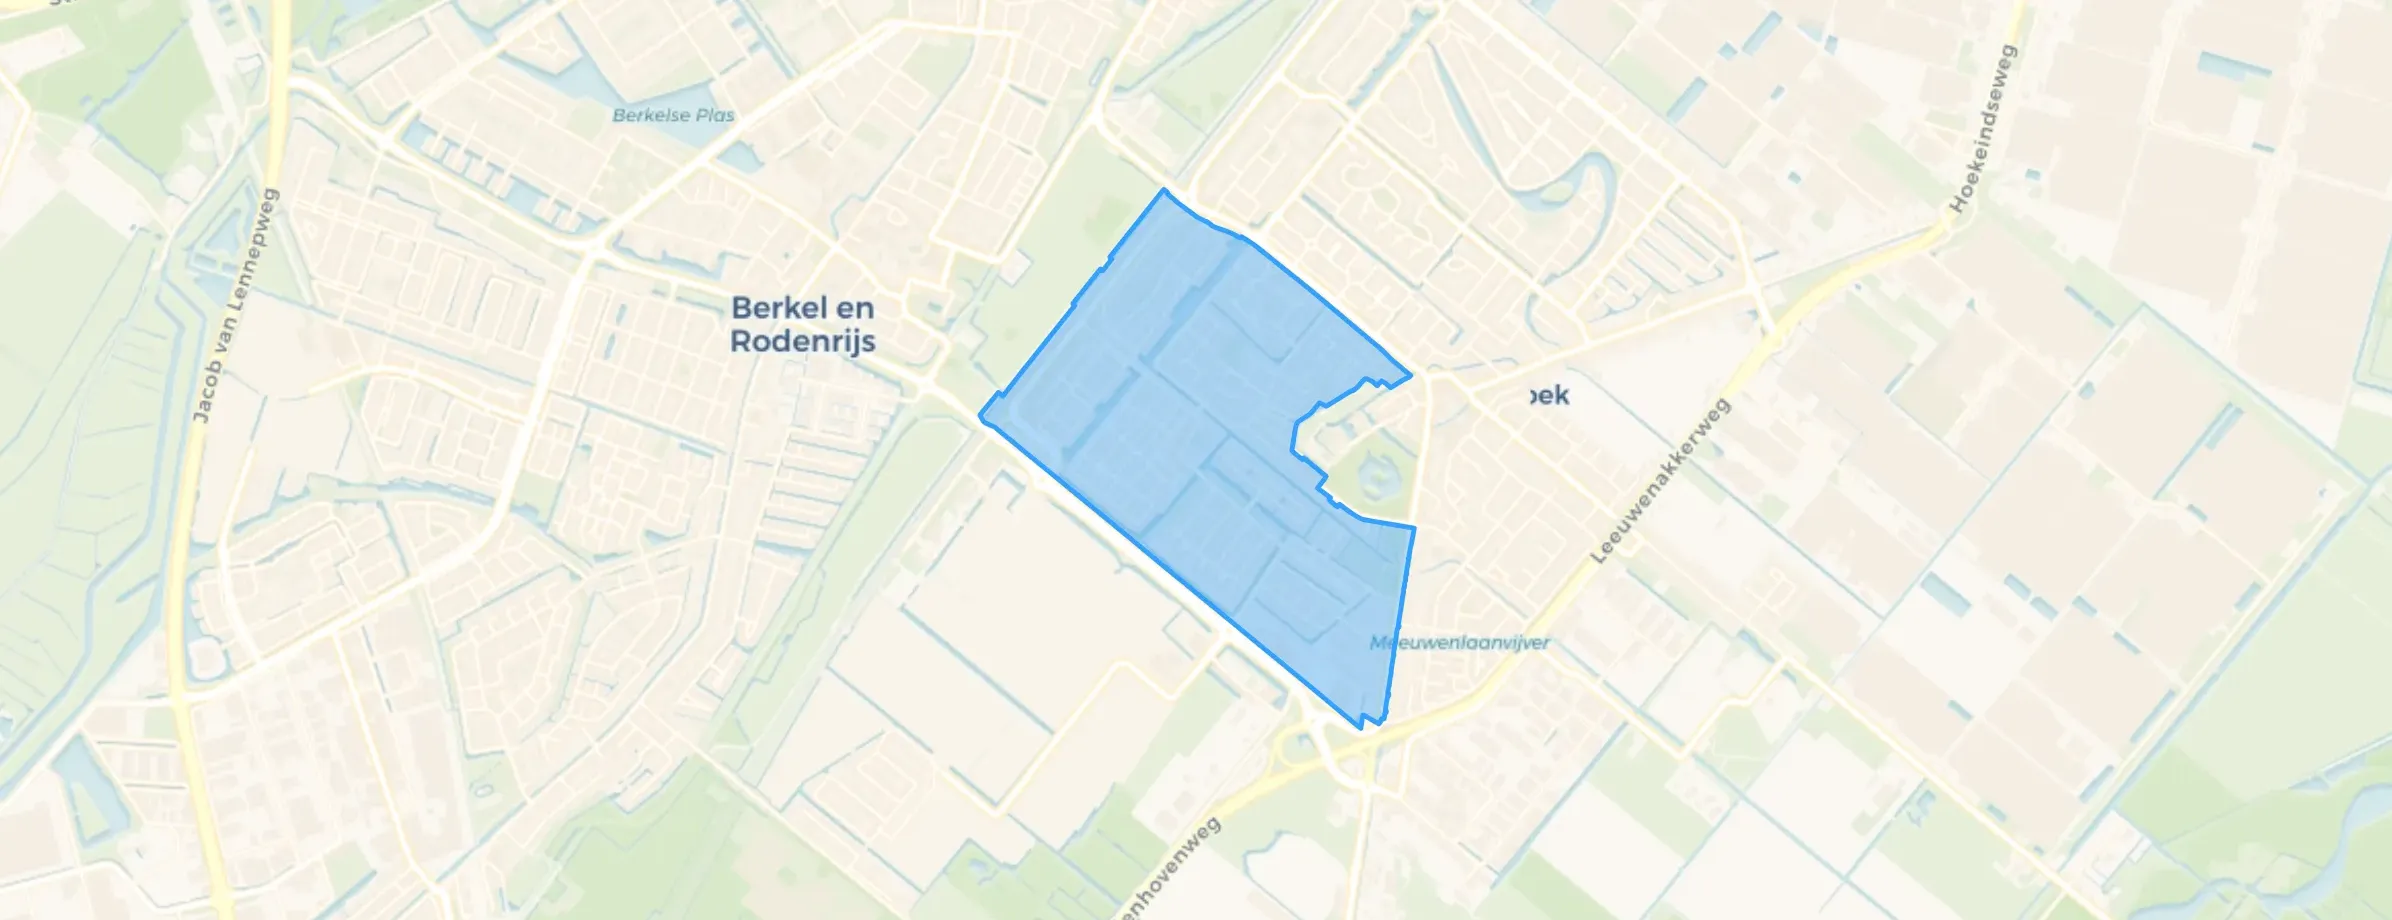
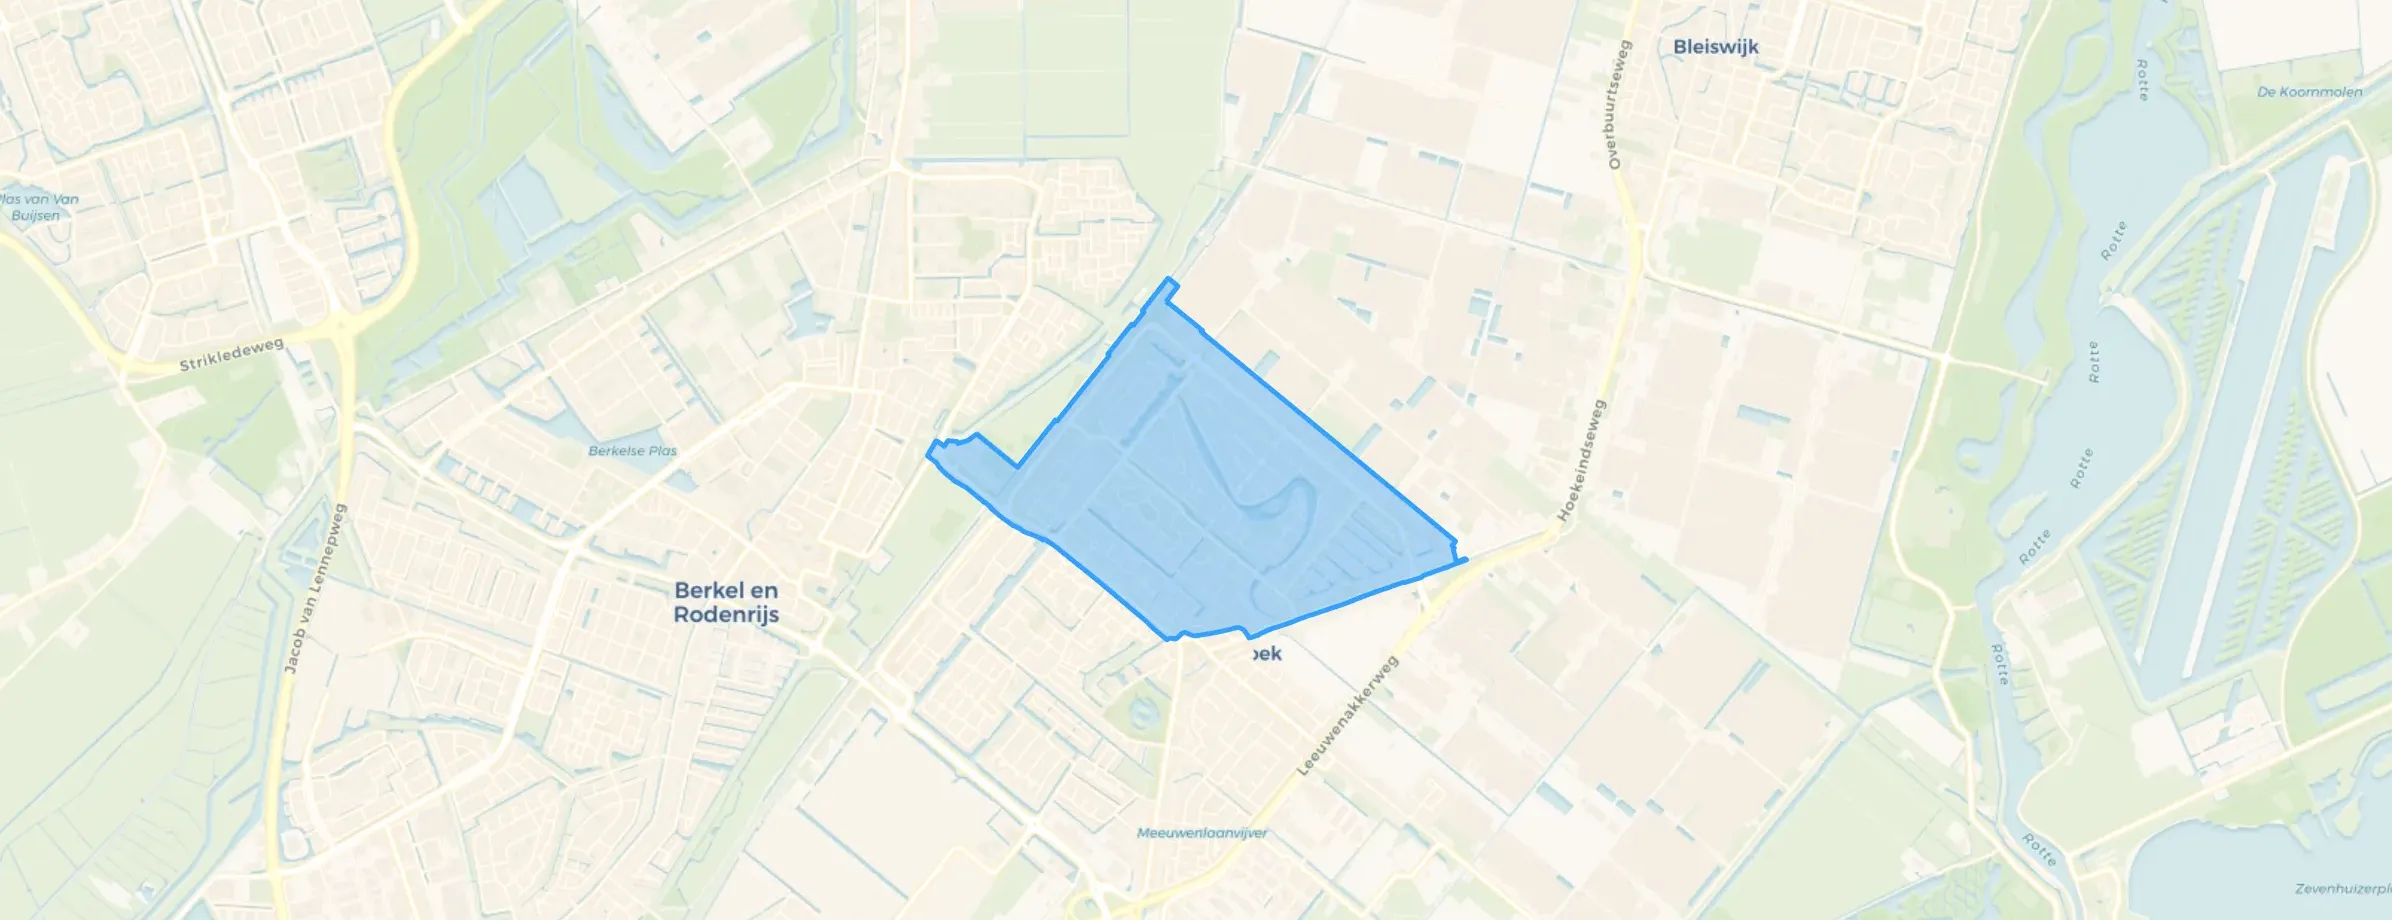

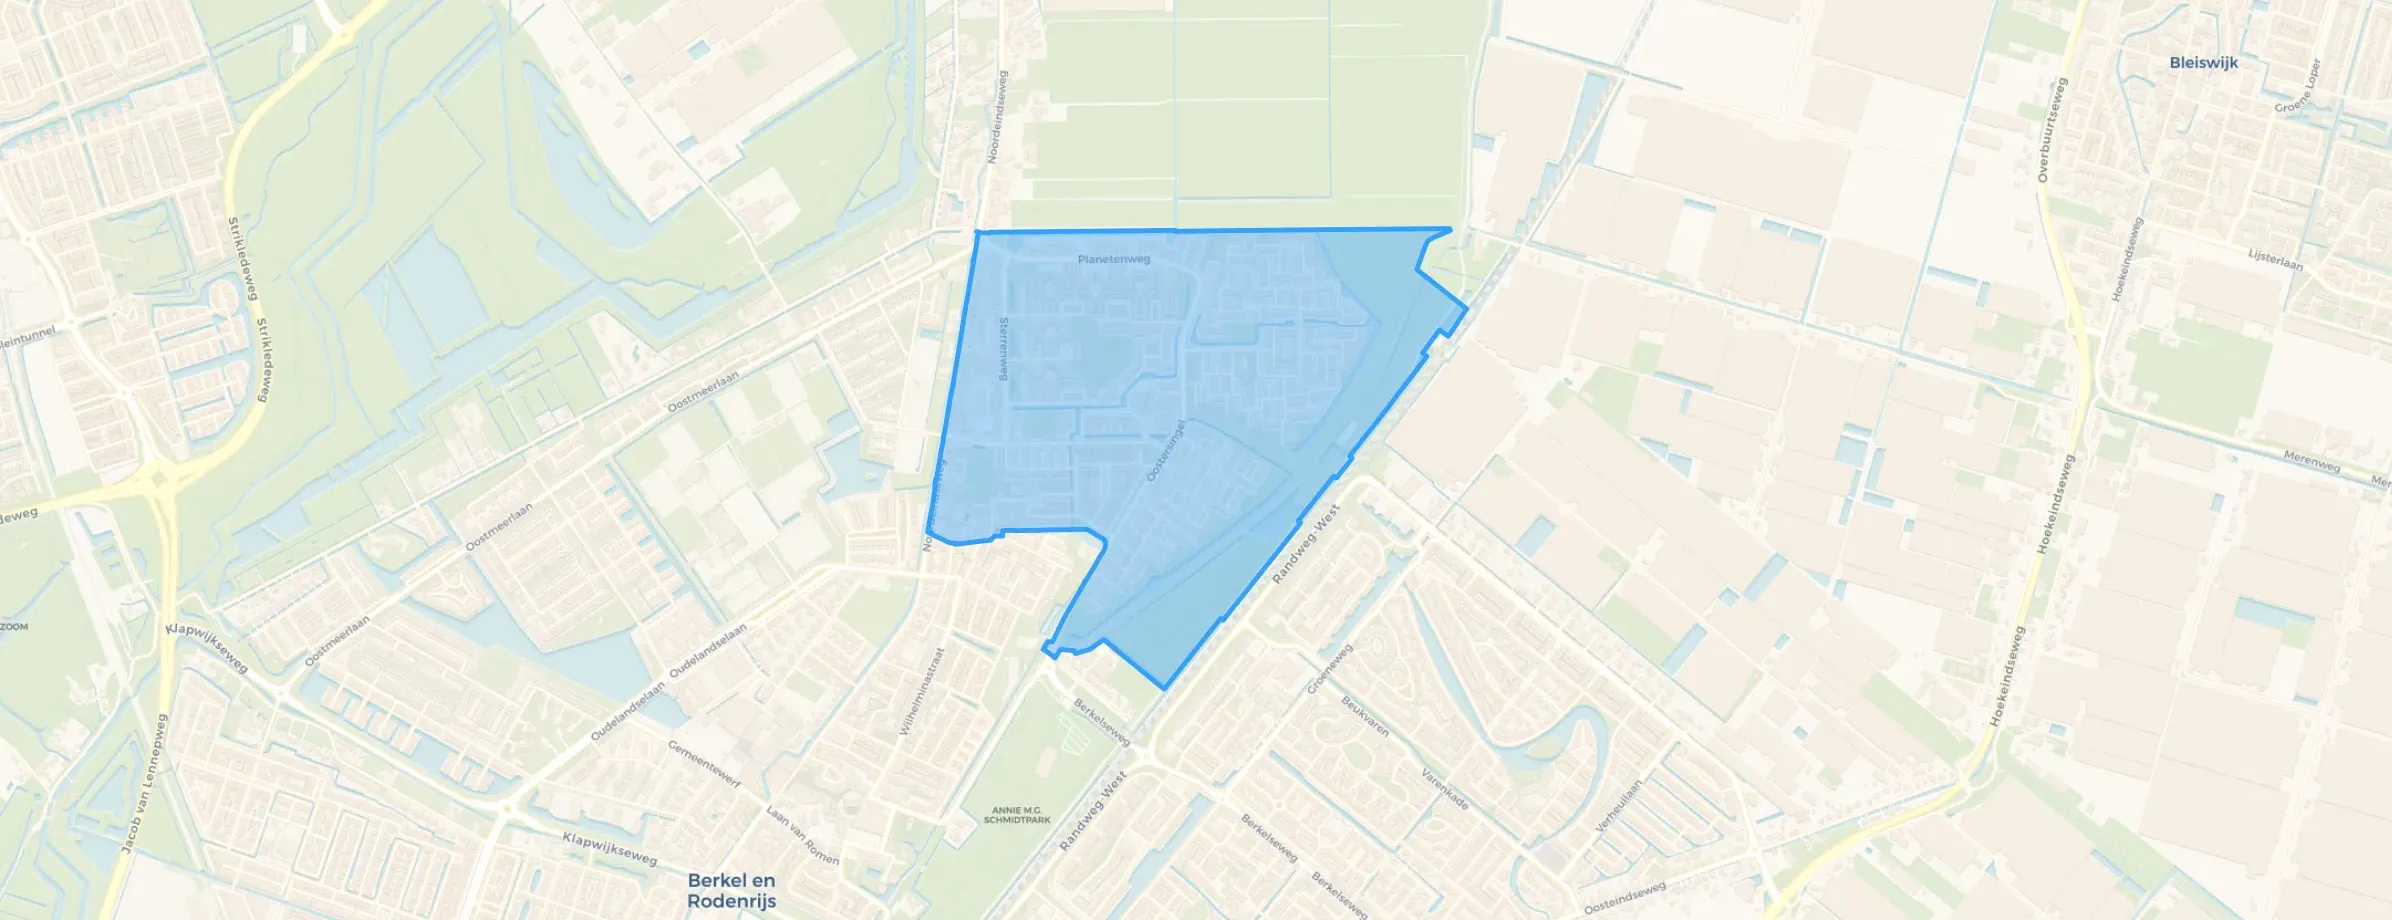
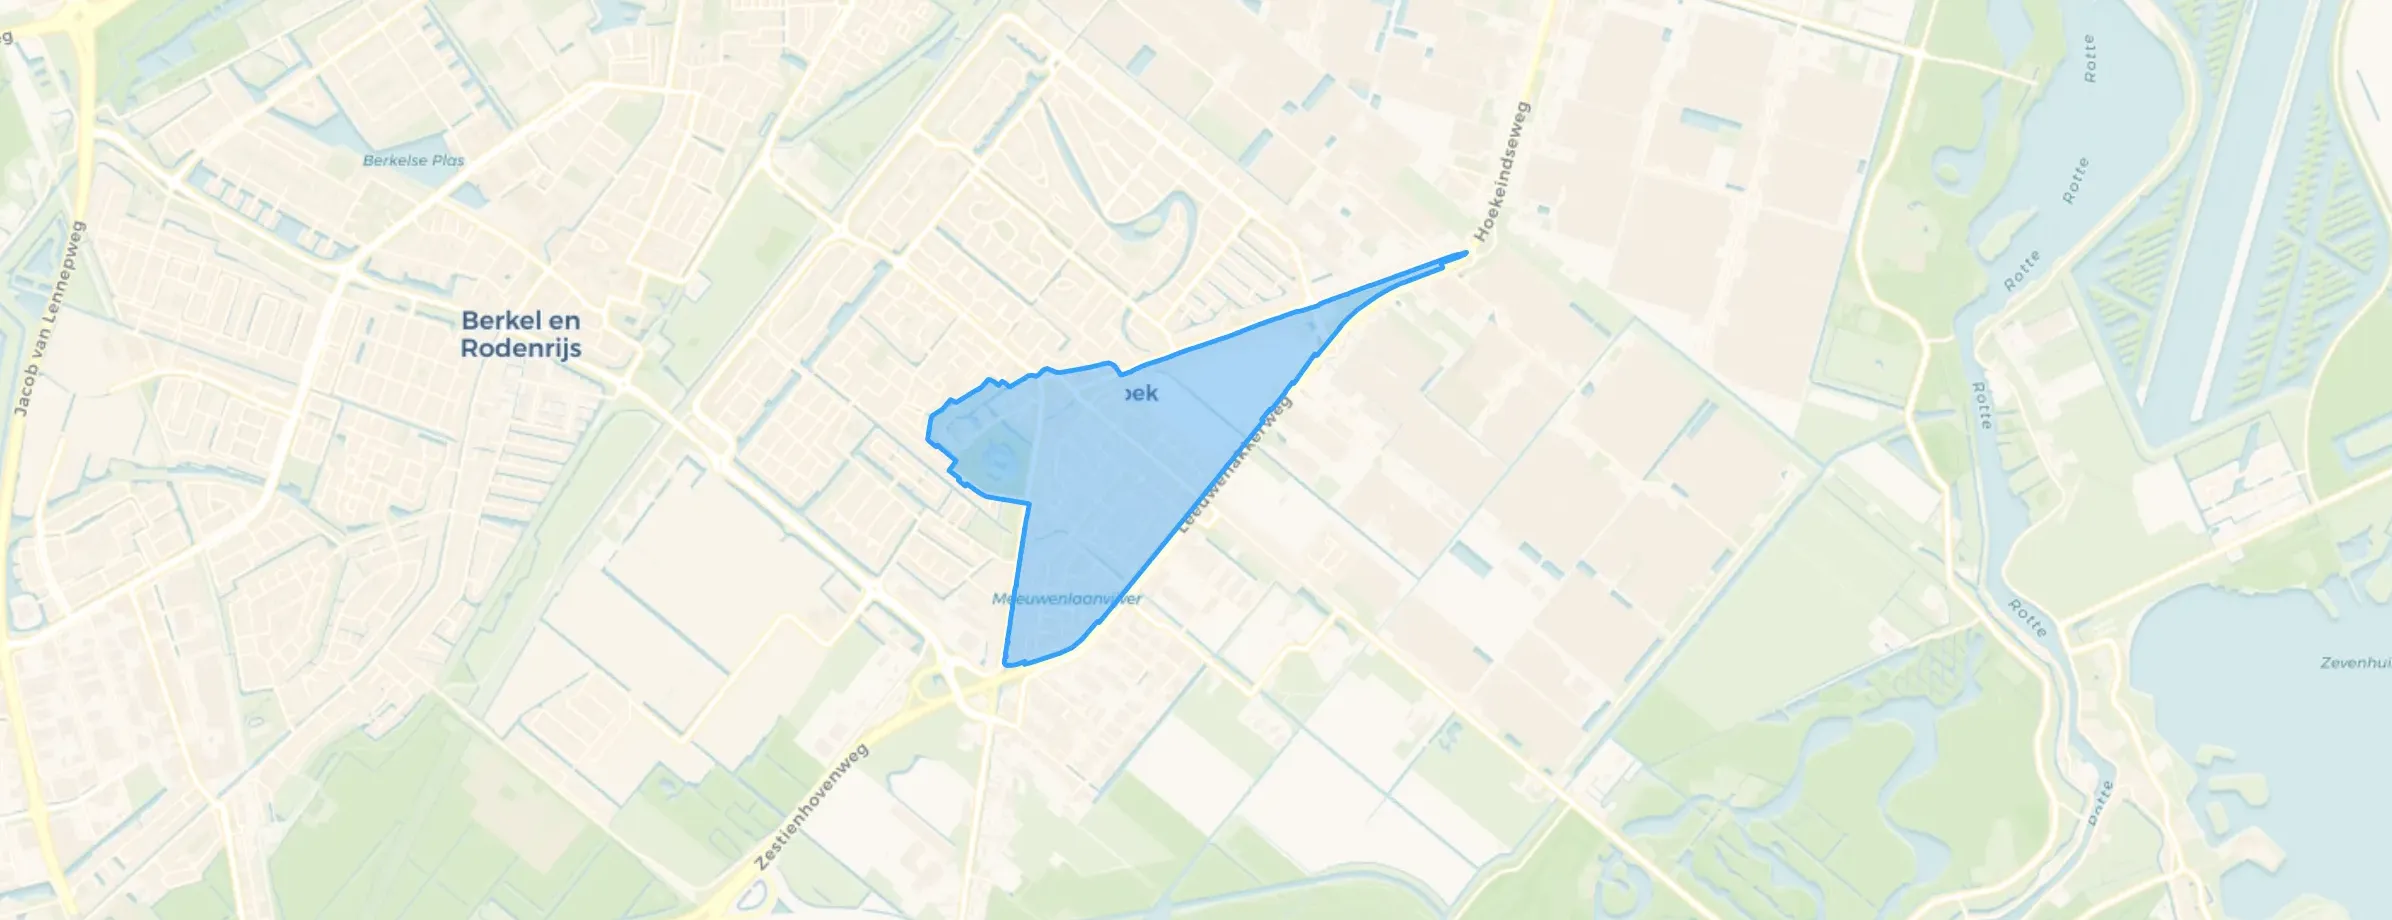
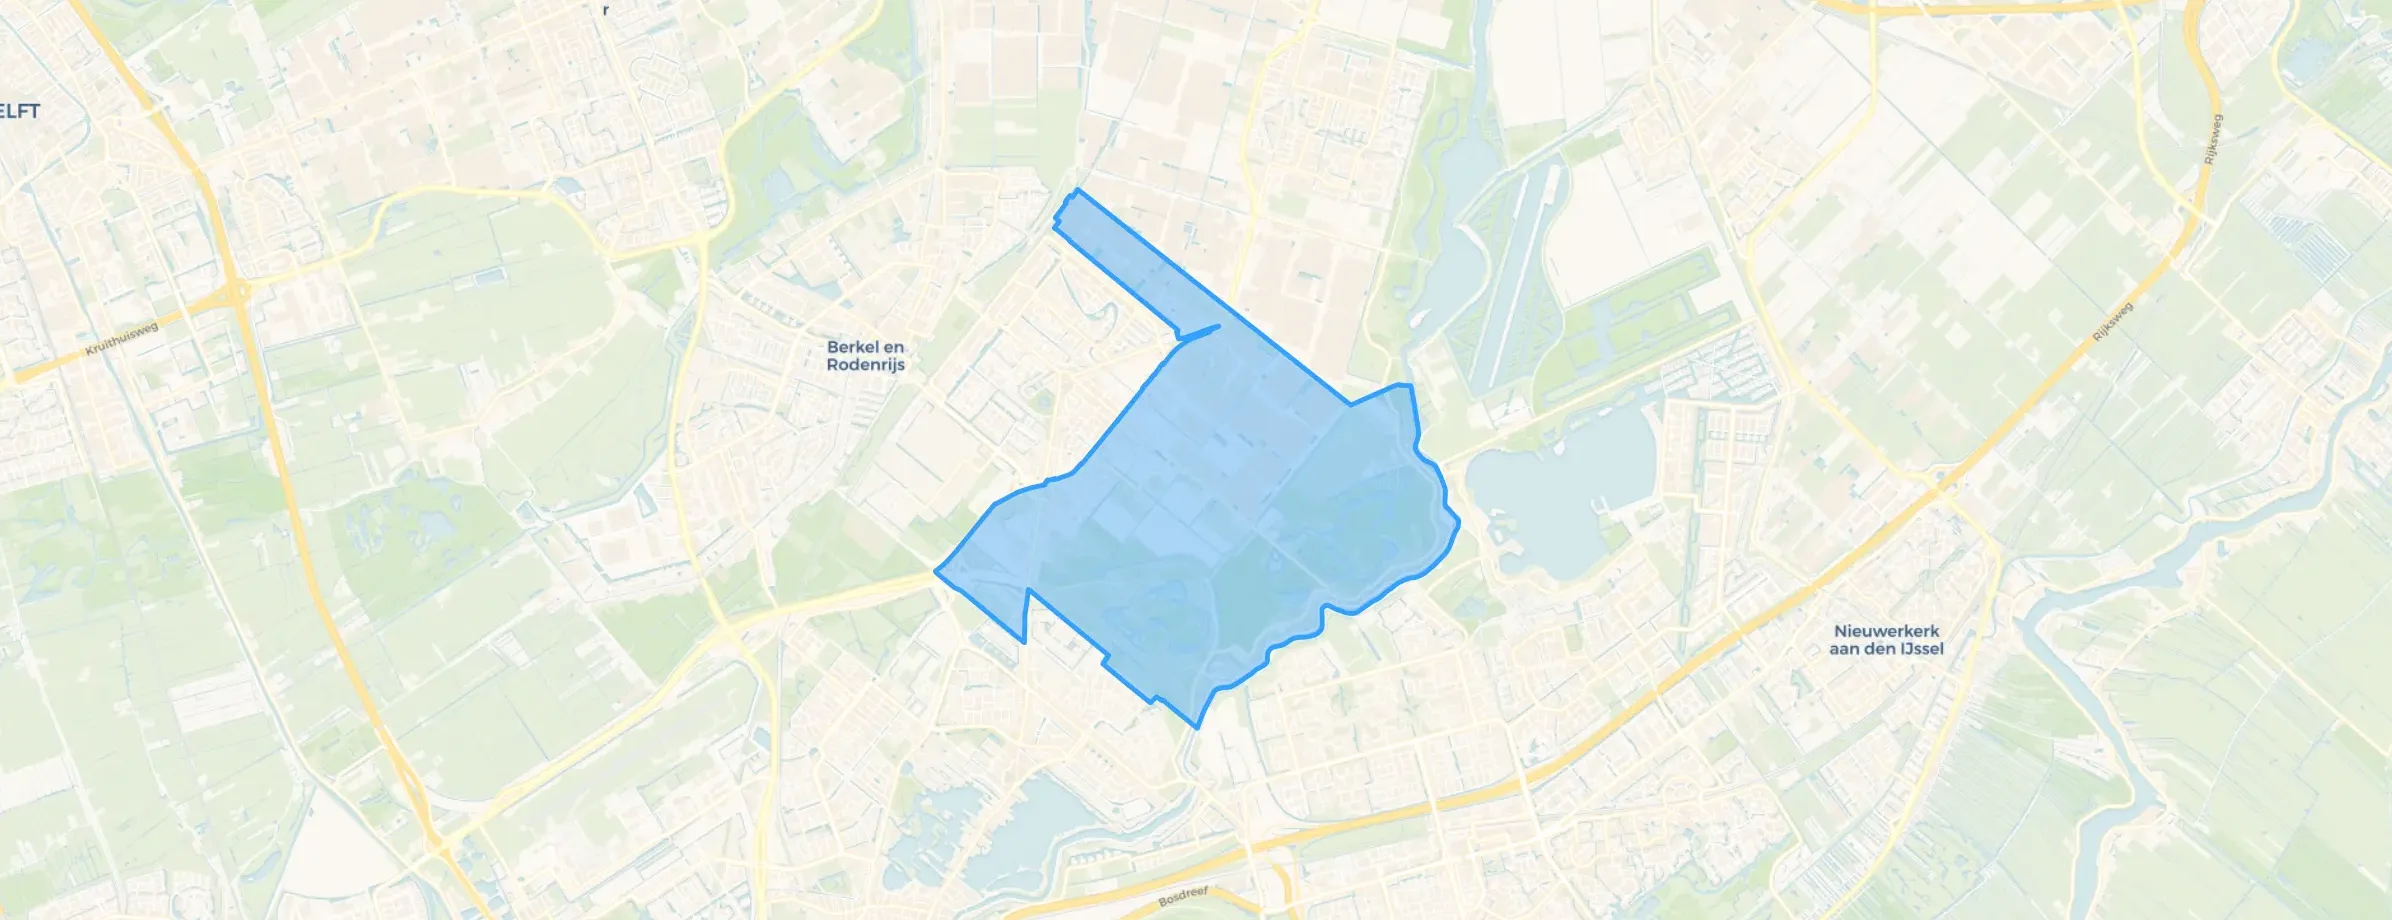
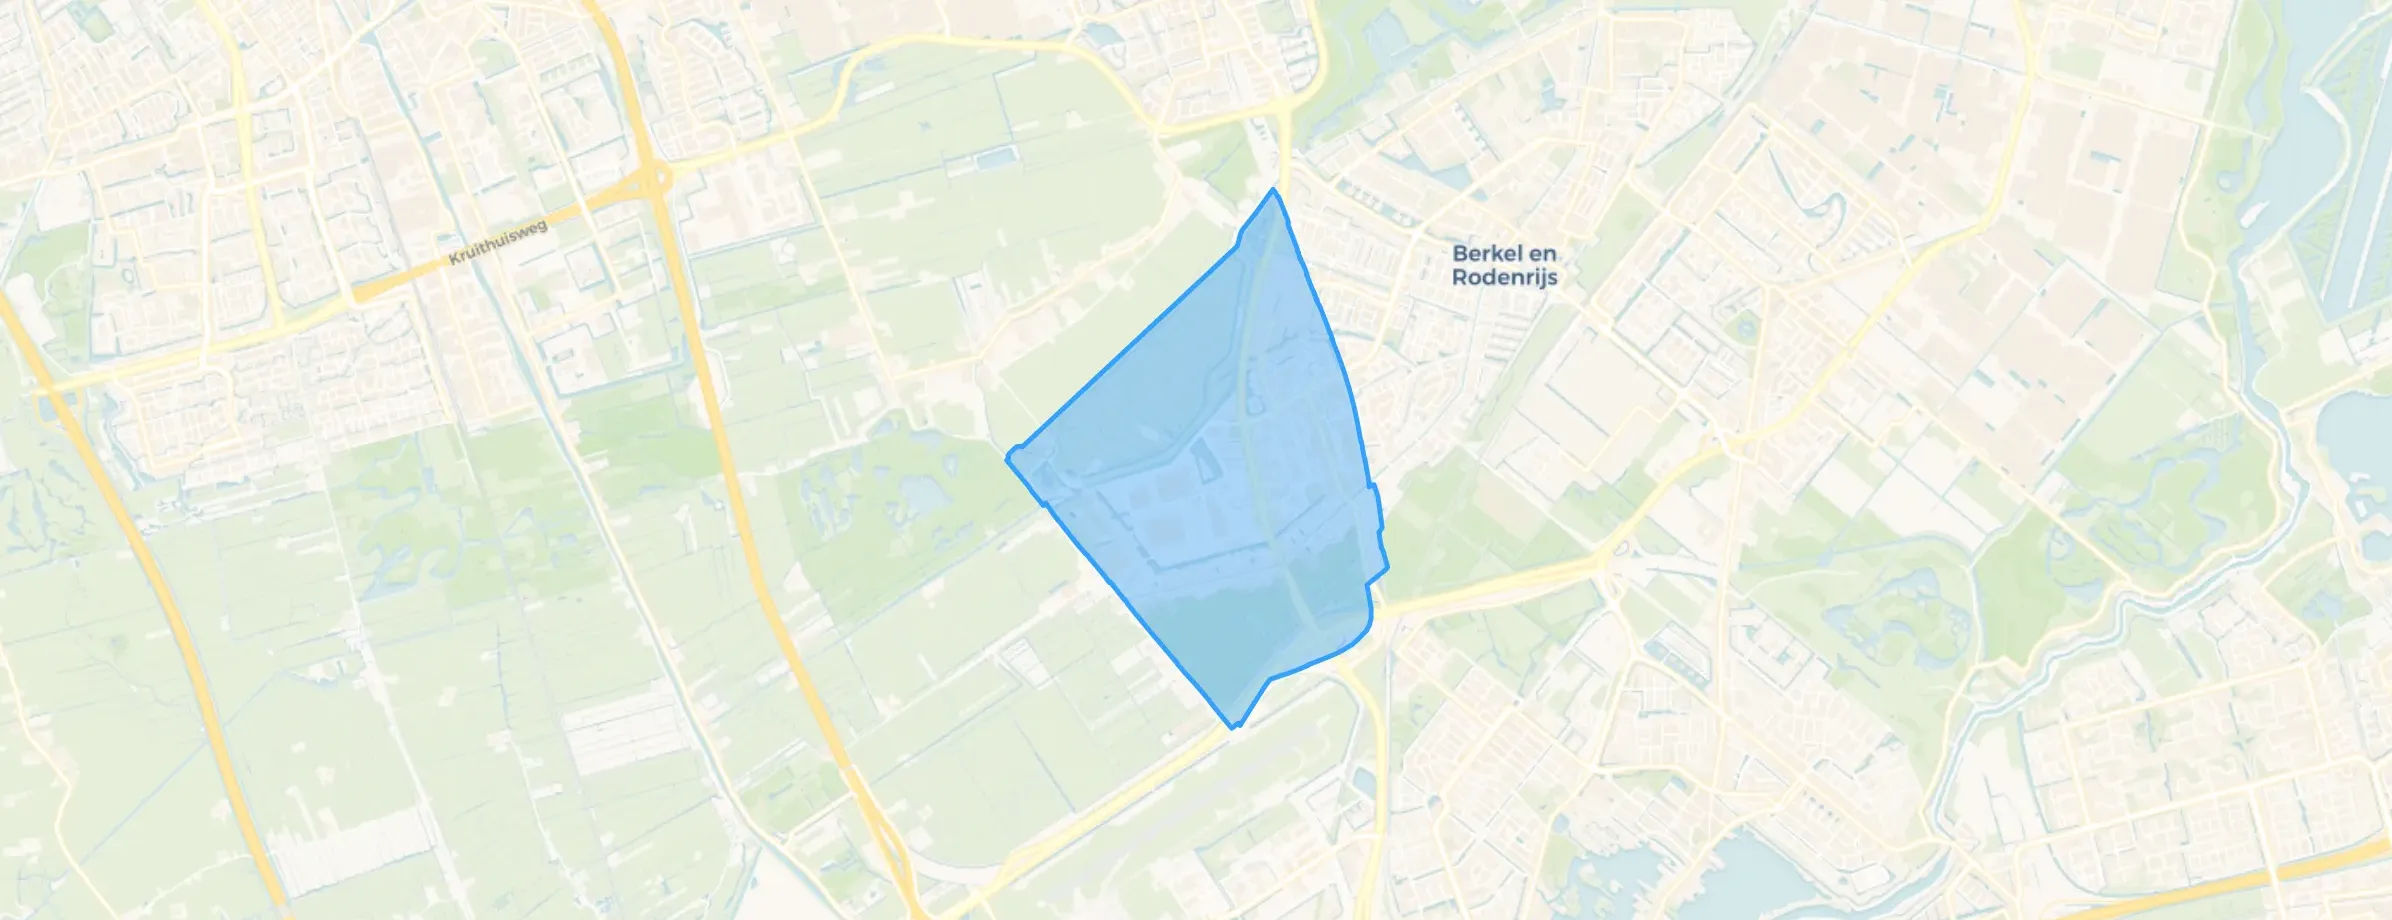
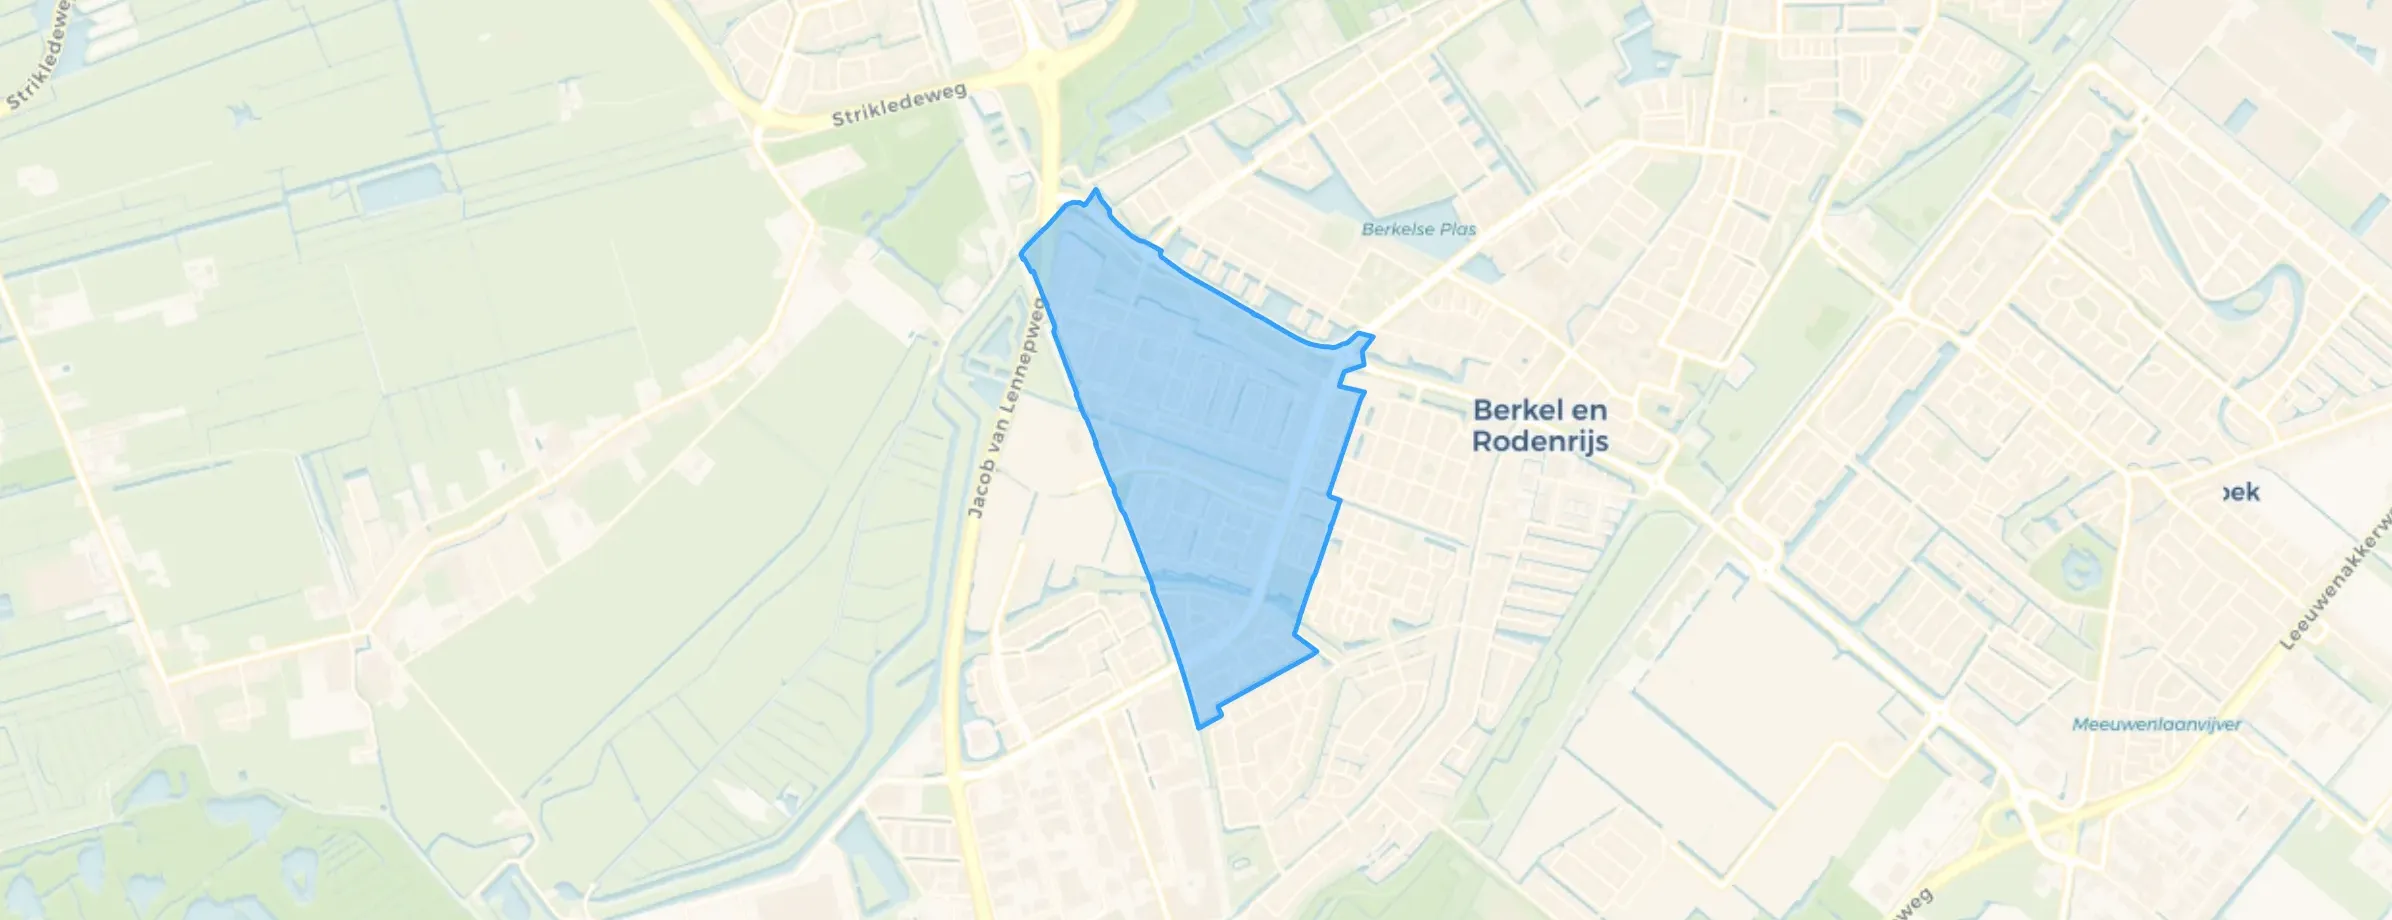
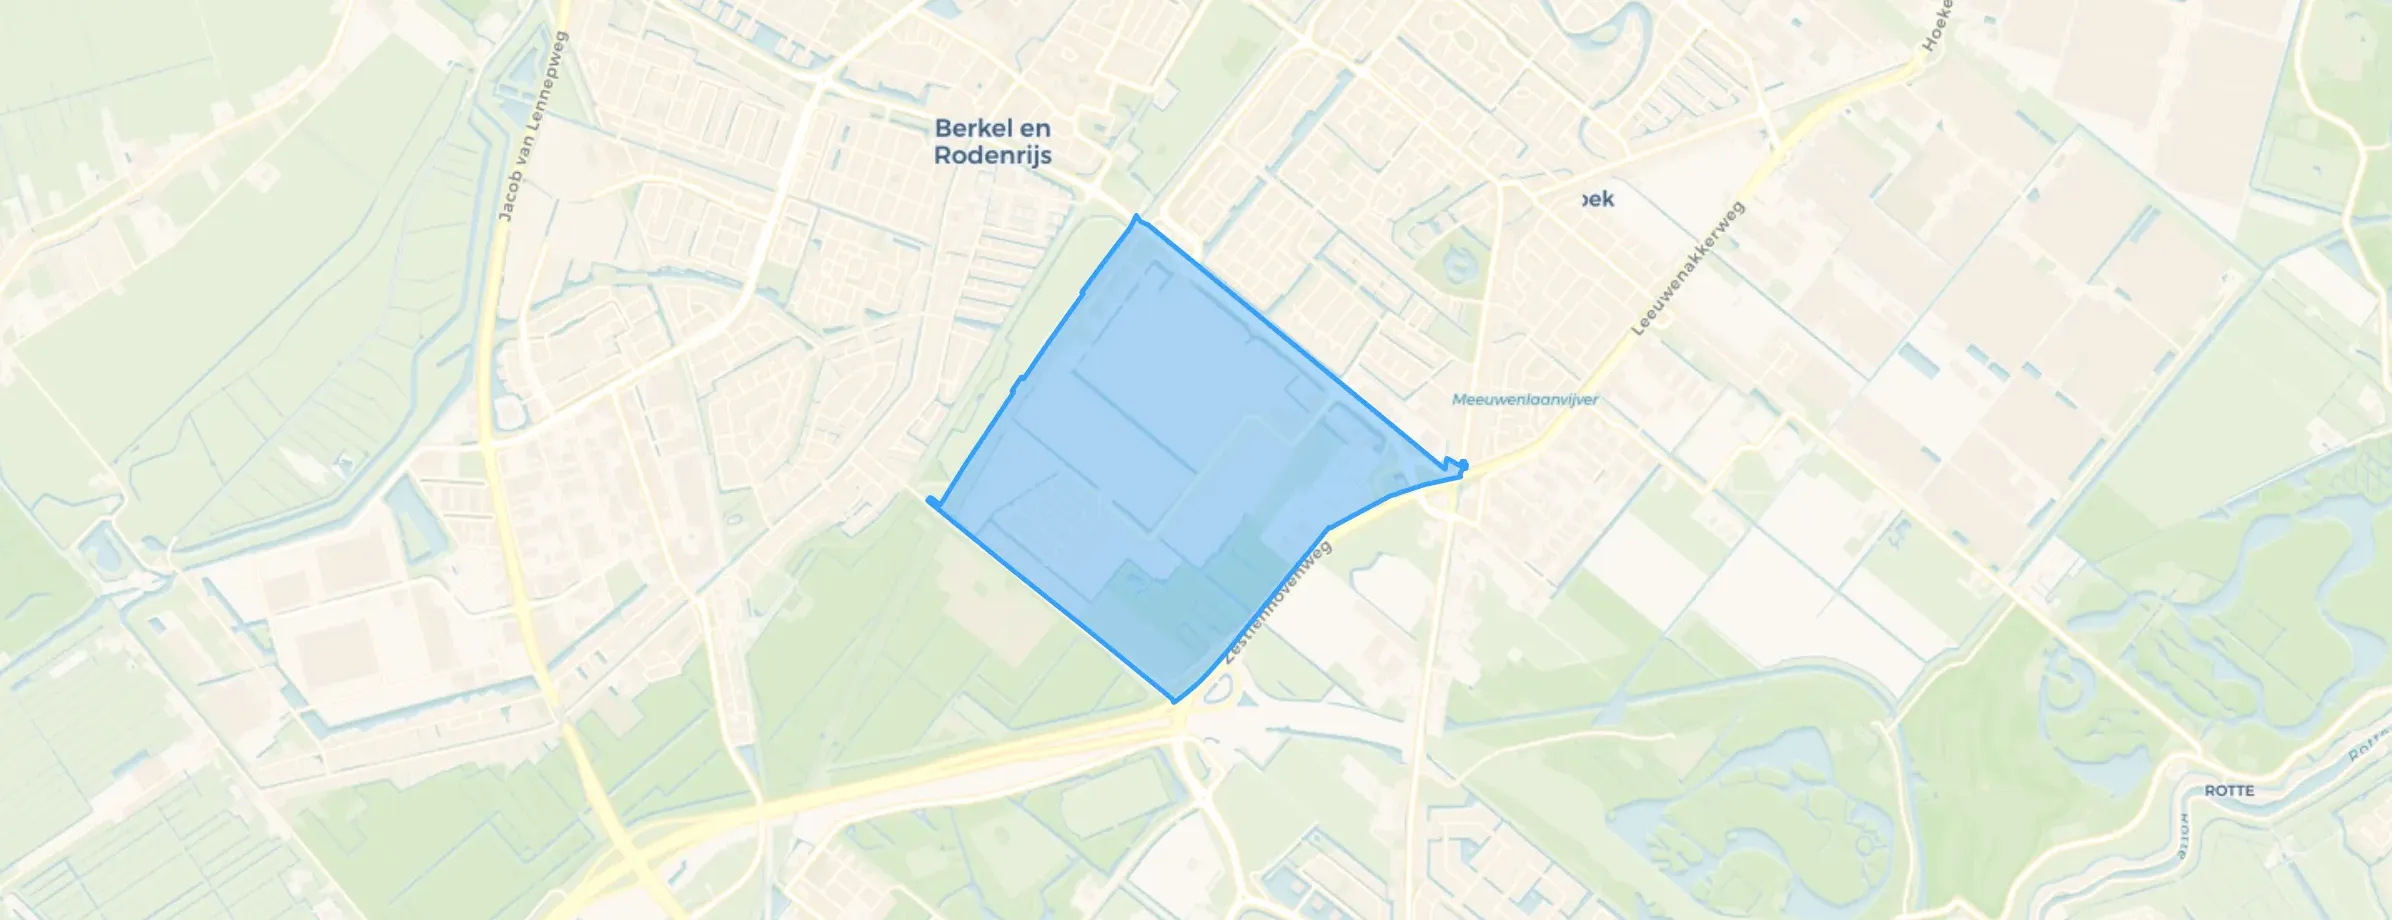
Neighbours say hi to each other when they meet, but we don't really have a close bond (anymore).
Auto-translated to English by AIYou have both houses, nature, the village with all the shops and public transport within walking distance
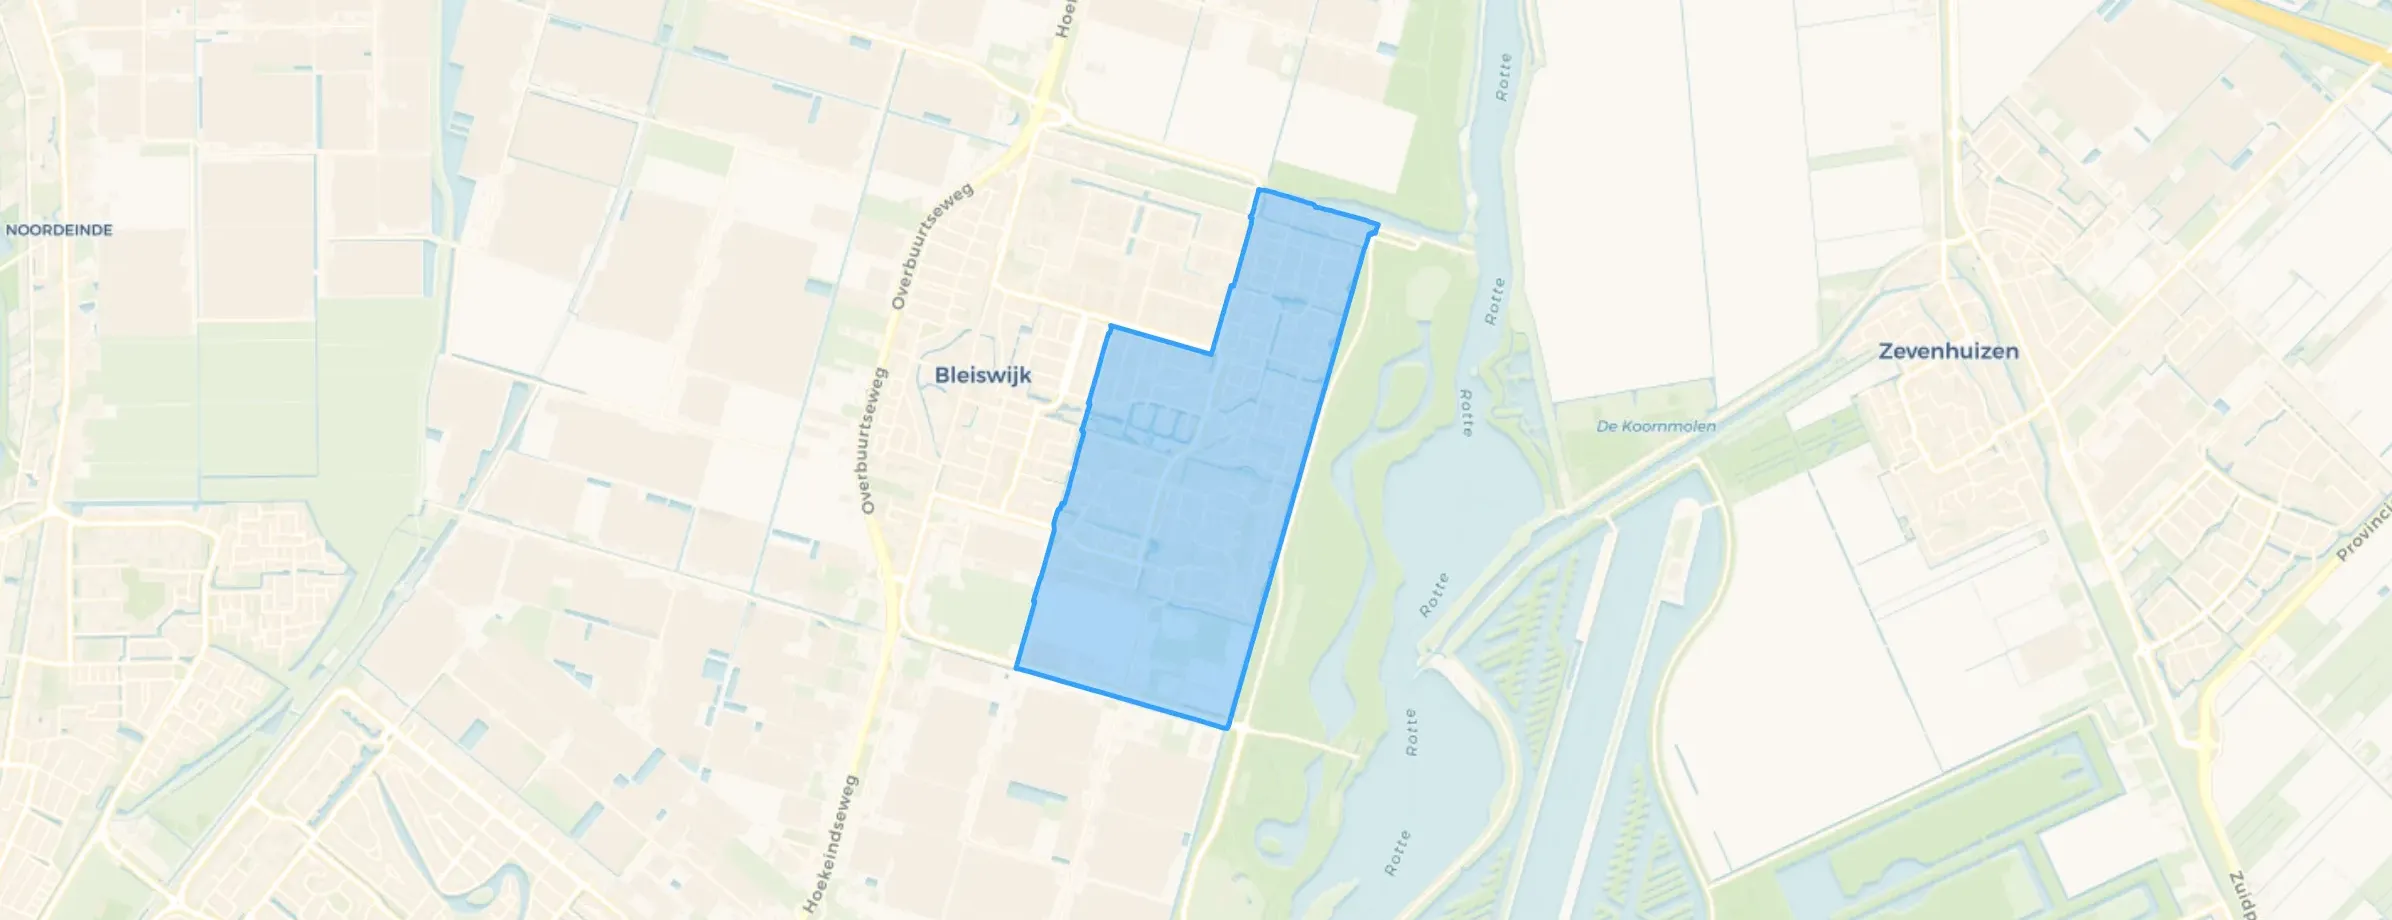
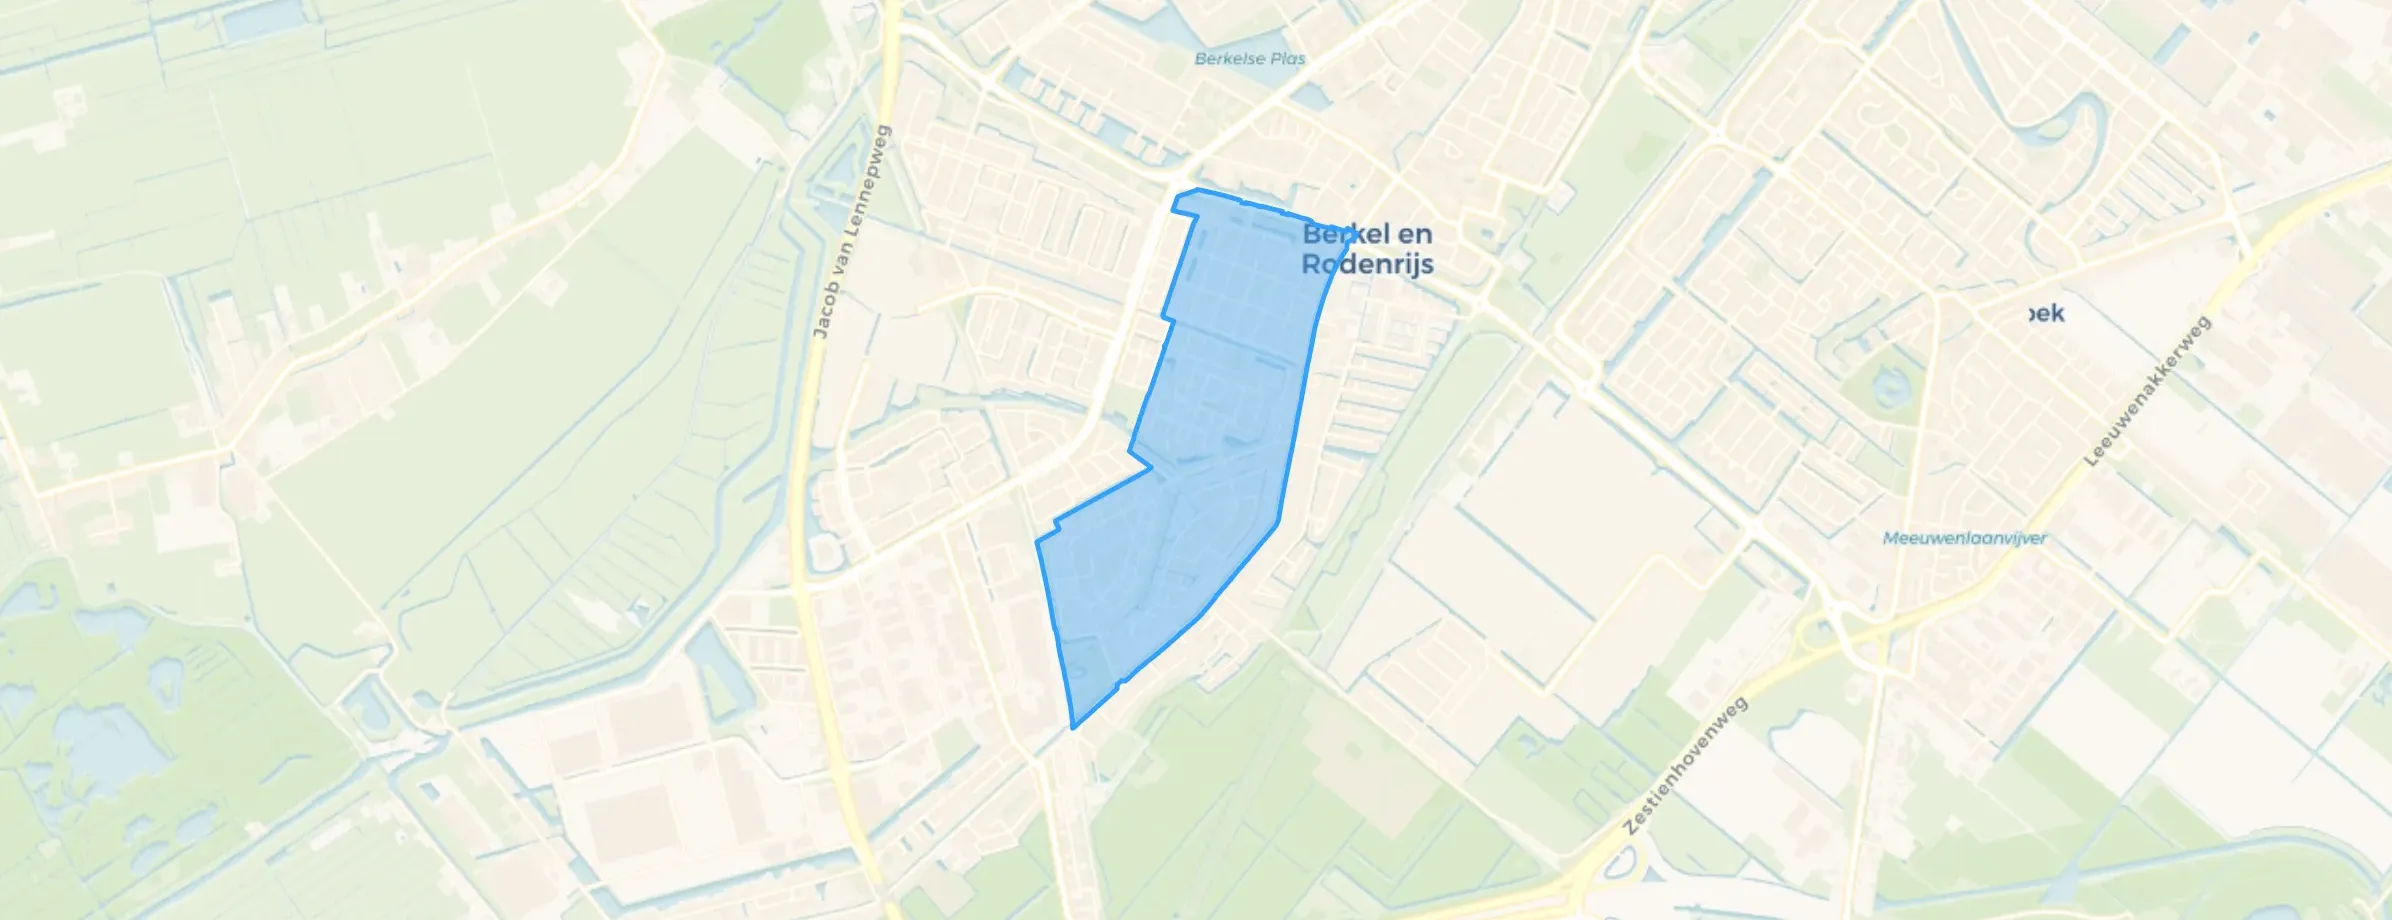
Auto-translated to English by AIThe Bomenbuurt is a fine neighbourhood in Bleiswijk. I have lived here for 20 years now, but over the years there have been more and more reports of car theft. I don't know about burglaries. There are many different sub-neighbourhoods. For example, if you walk out of one street, people quickly see someone else as lesser because they live in a small apartment or a flat-roofed house. There are many neighbourhood communities or more street communities. It is a nice neighbourhood to live in. In terms of greenery, it's okay; it borders the Rottemeren area, but in the neighbourhood itself there is only a small patch of green and for the rest some 1980s steel playgrounds that are dated. More greenery could certainly be added. More trees should be planted. These facilities are so-so.
Auto-translated to English by AII always enjoy it here and have no complaints
Auto-translated to English by AII haven't had any bad experiences in the neighbourhood, and a lot is done for the children, like extra playgrounds, so I'm very satisfied with that. It's also clean and there are enough waste containers in the area. All in all, a very nice neighbourhood.
Auto-translated to English by AII think it's quite a quiet little village, I also feel safe here. The only downside is that there is still quite a bit of street litter on the ground. I think the forest is really beautiful too.
Auto-translated to English by AIOur neighbourhood is a close-knit community: everyone who lives here knows each other, if not directly then through others. Everyone is ready to help each other to keep it safe, and you can see street barbecues in many streets in the summer. The streets are largely clean, and the primary school is a stone's throw away.
Auto-translated to English by AIChild-friendly neighbourhood.
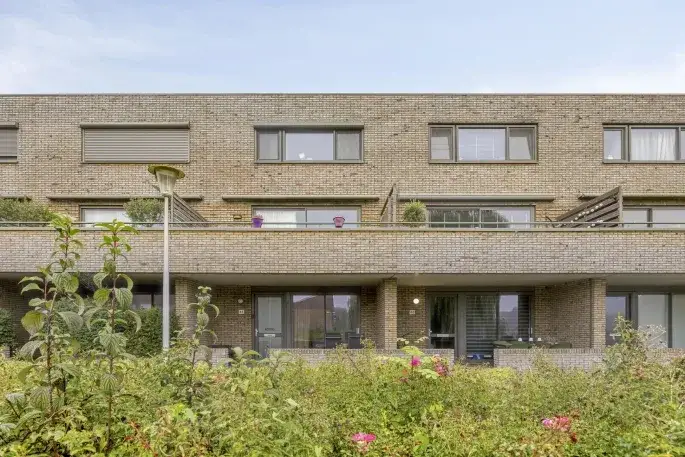
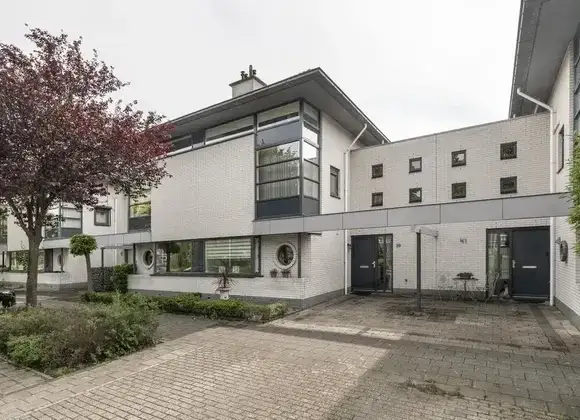
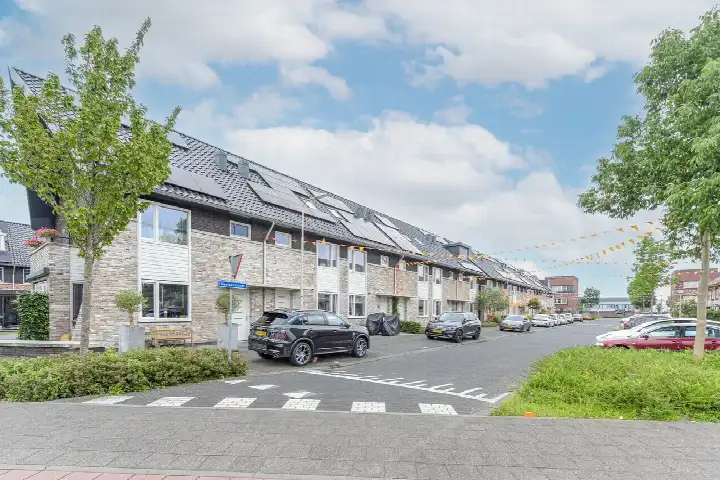
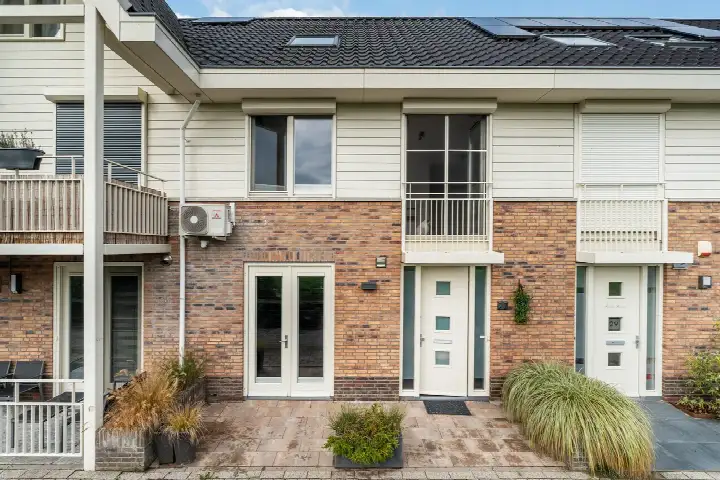
Auto-translated to English by AIThe housing stock is relatively young — 62% dates from after 1990. In addition, the most common type is terraced houses (42%).
Over the past year a home for sale in Lansingerland was listed for an average of €683,912 (€4,864 per m²). That is 29% above the Dutch national average.
A rental home in Lansingerland cost an average of €1,698 per month (€19 per m²). That is 21% below the national average.
Residents give Lansingerland a 7.8 out of 10 based on 12 reviews. Especially community (8.3) scores well; amenities (7.2) receives the lowest rating.
Gemeente Lansingerland has 66,064 residents. Many families: 47% of the households have children.
The housing supply in Lansingerland is remarkably efficient: 76% has an A, A+ or B label. The average natural gas consumption per household is 760 m³ per year.
From Lansingerland you can on average reach a supermarket at 1.0 km, a GP at 0.9 km, a railway station at 6.6 km, a primary school at 0.8 km (as the crow flies, source: CBS).
Right now you will find 249 homes for sale and 18 homes for rent in Lansingerland.