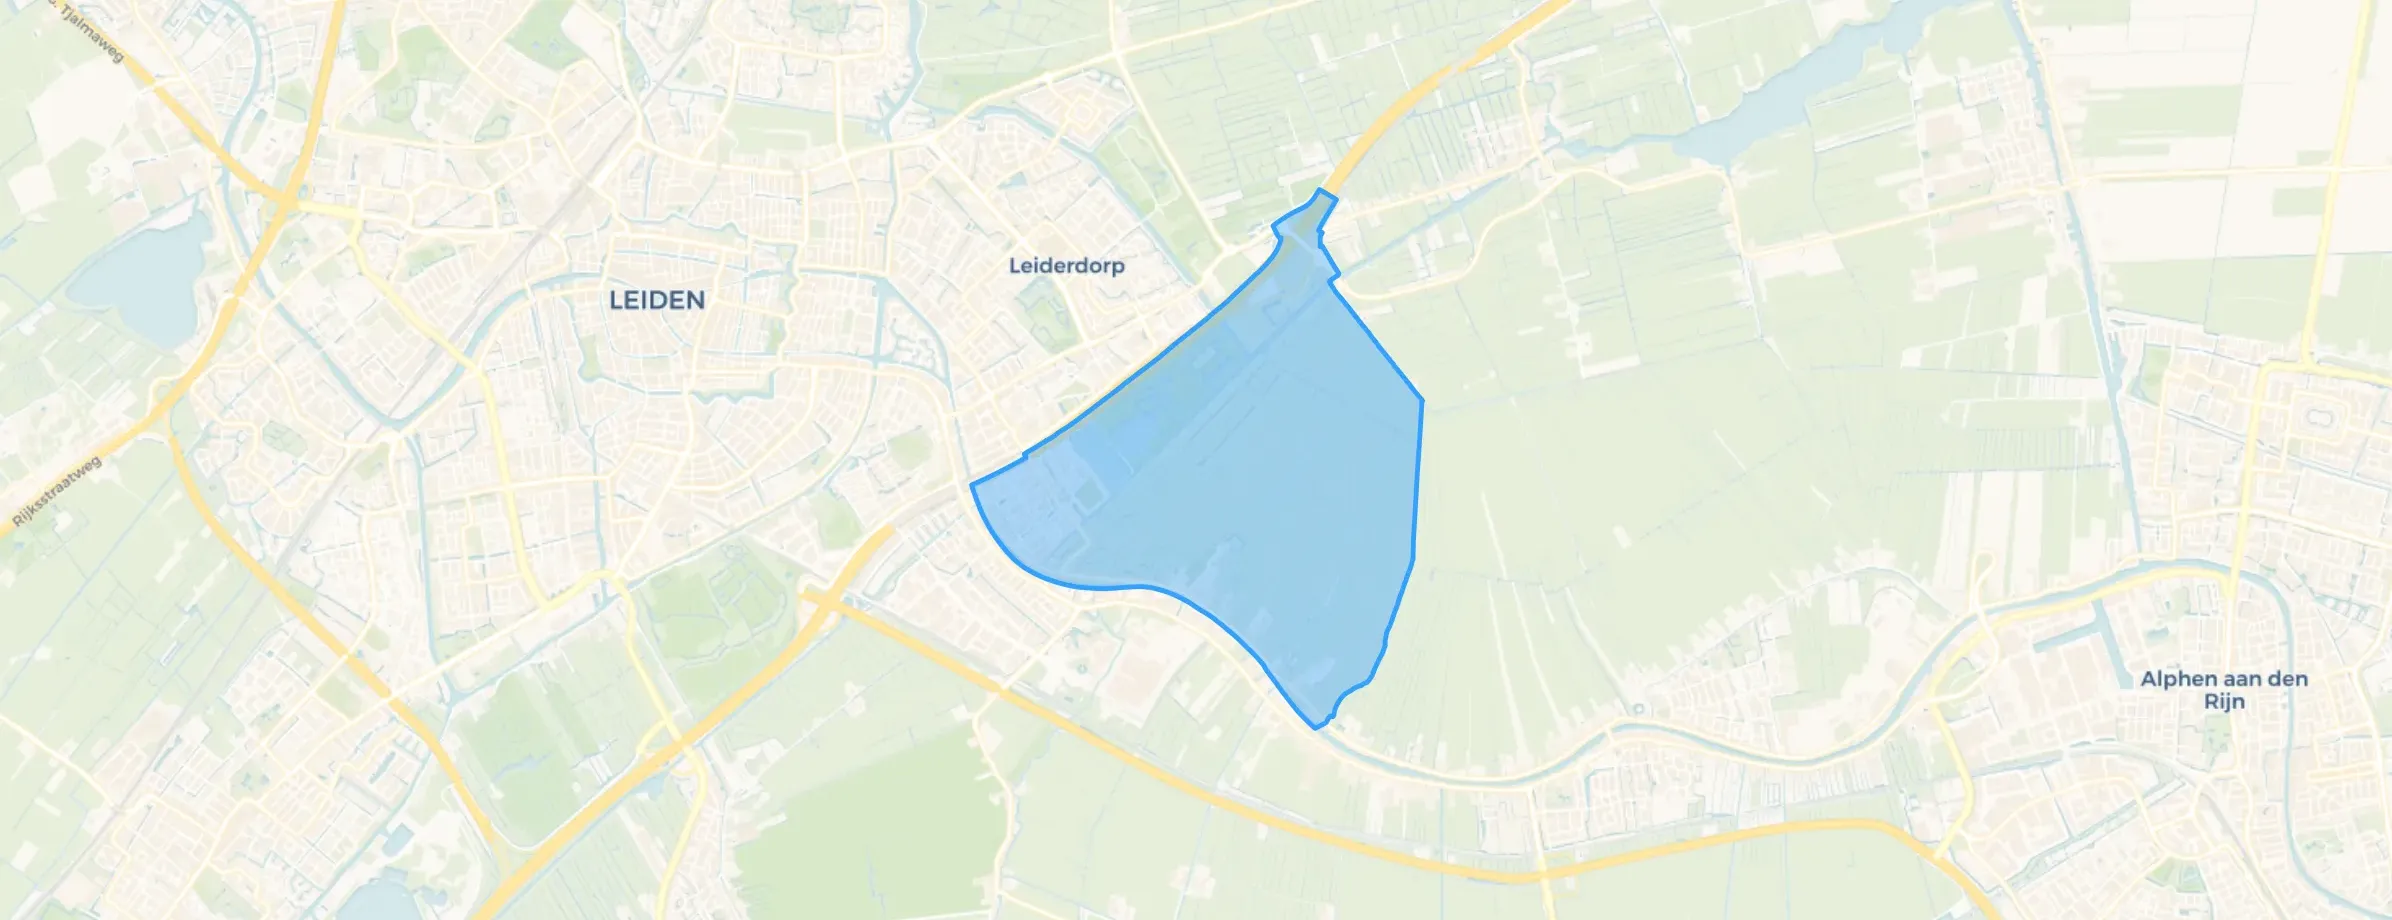
Municipality in Zuid-Holland
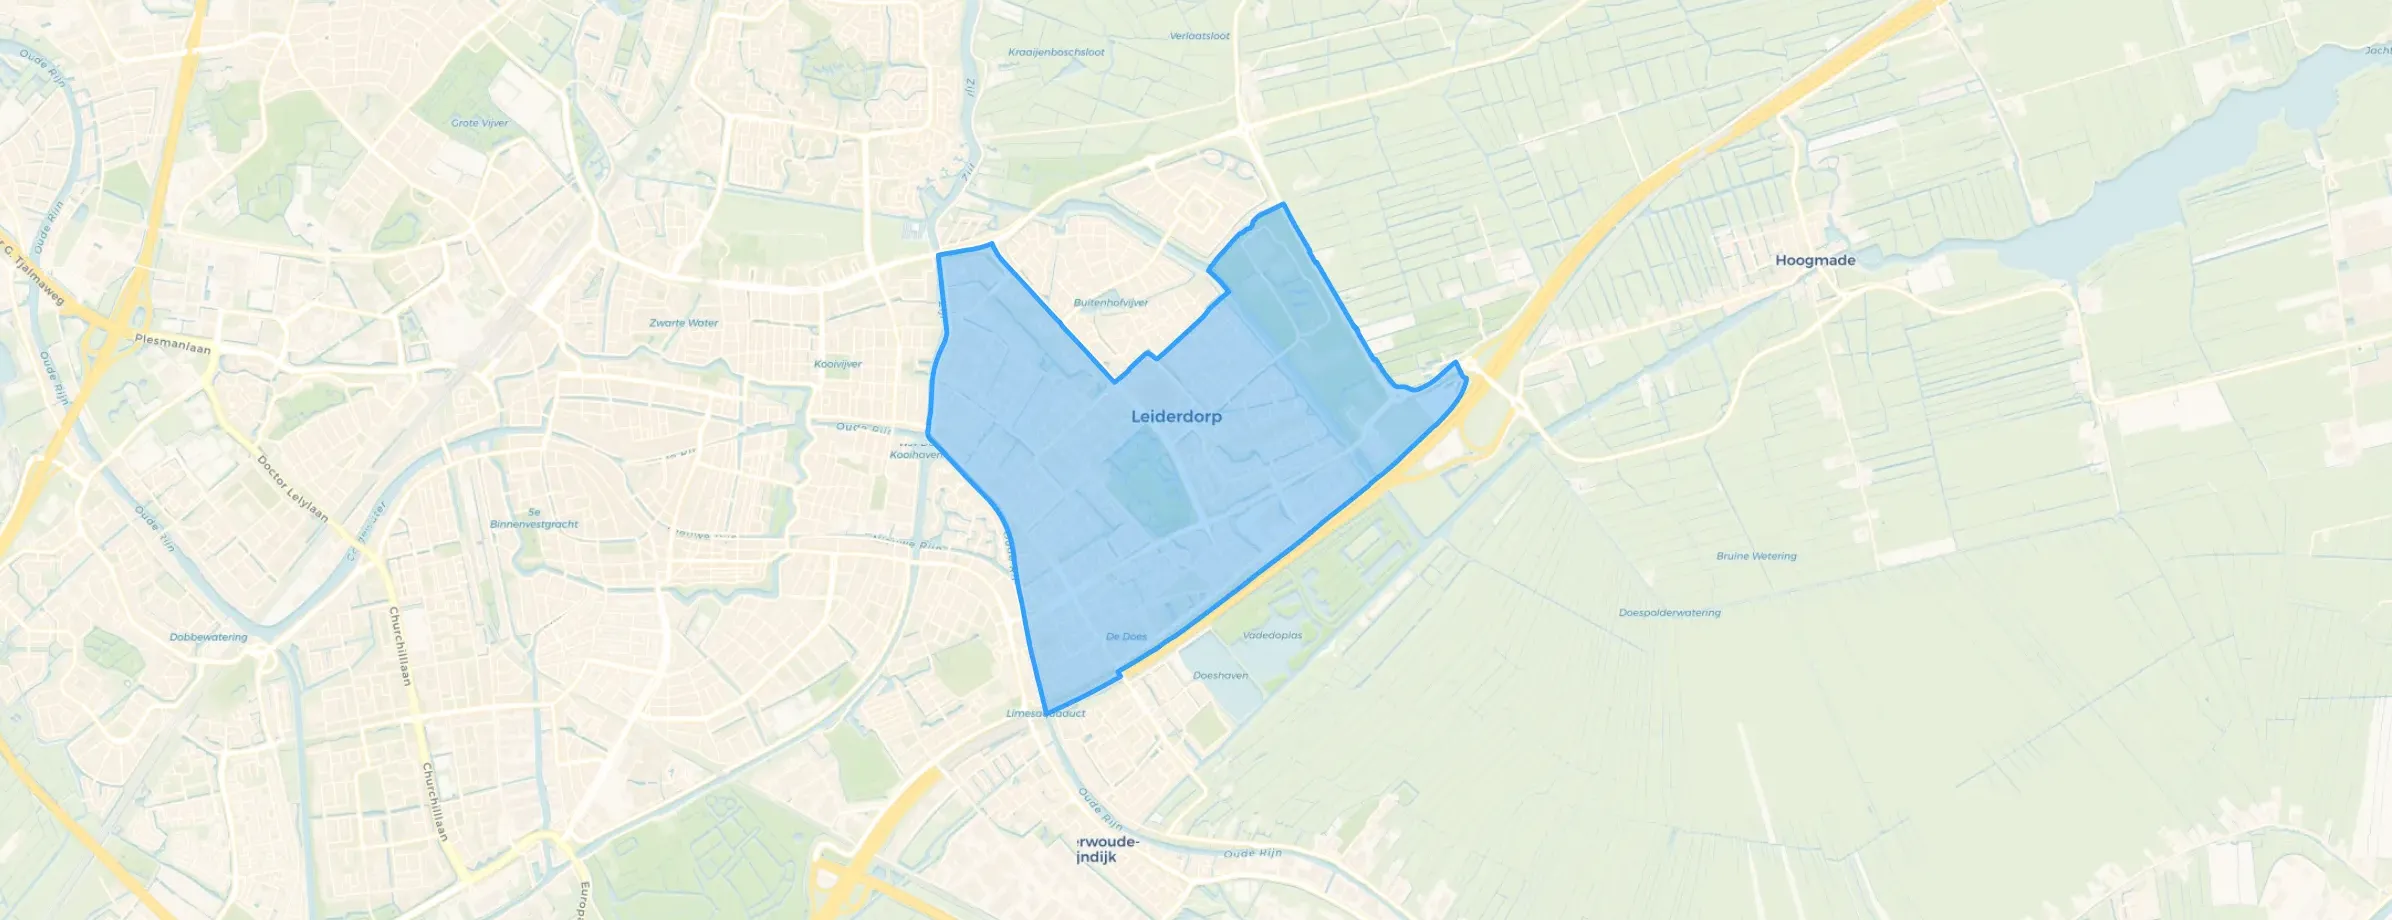
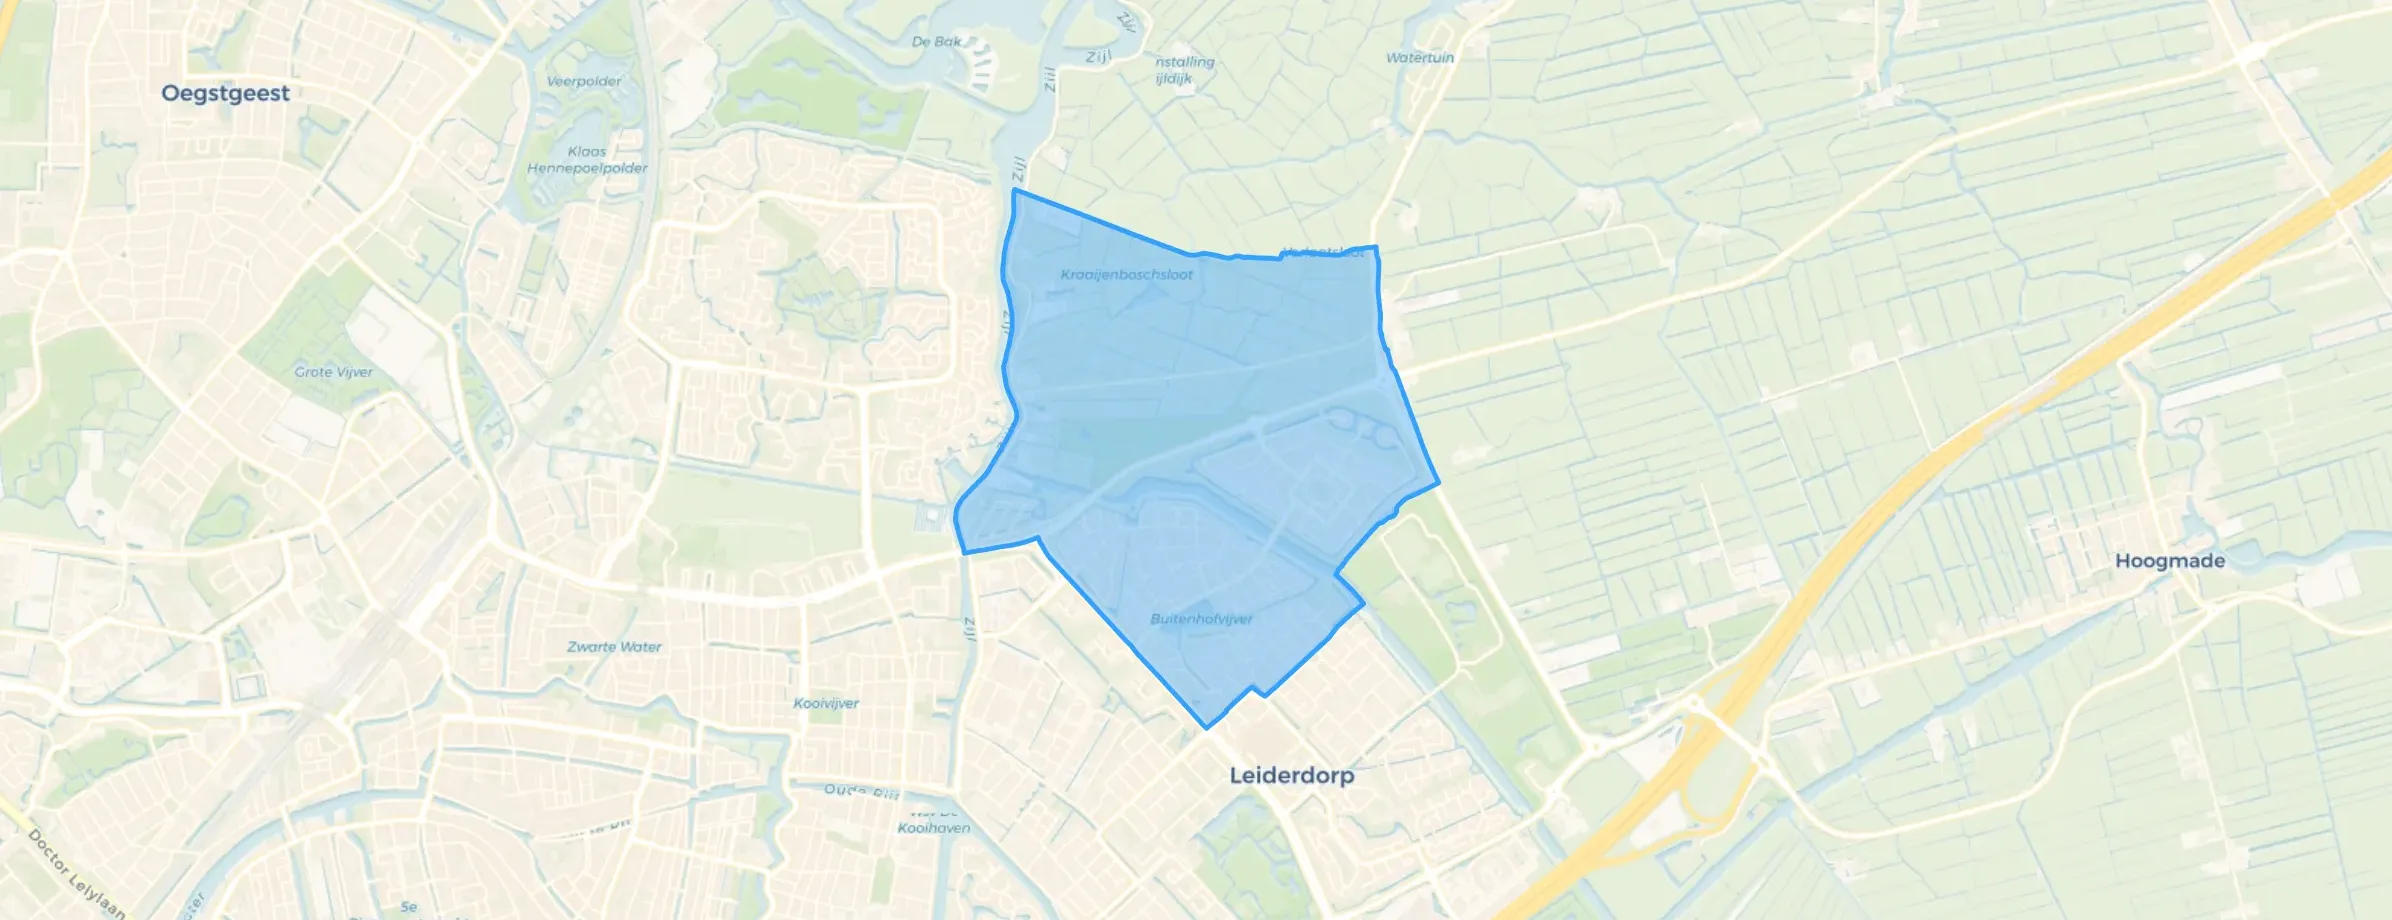
Leiderdorp is located in the province of Zuid-Holland The municipality has a total area of 1.228 hectares, of which 1.150 hectares are land and 78 hectares are water. The municipality is coded as GM0547. The postcode area is 2351AA-2353ZW.
Leiderdorp has 27.751 residents. Of these, 48,7% are men and 51,3% are women. Most residents are 45 to 65 years (26,8%). The other age groups are 23,9% for '65 years or older', 23,0% for '25 to 45 years', 15,6% for '0 to 15 years' and 10,7% for '15 to 25 years'. Of the residents, 46,8% is unmarried, 40,0% is married, 7,7% is divorced and 5,5% is widowed. 20.394 residents originate from the Netherlands, 2.167 come from Europe and 5.190 come from countries outside Europe.
There are 12.717 households in Leiderdorp. 36,8% of these are single-person households, 29,8% households without children and 33,4% households with children. The average household size is 2,2 persons. The national average is 2,1 persons.
In Leiderdorp there are 22.500 income recipients. The average income per income recipient is €45.800, which is €3.600 (9%) higher than the national average of €42.200. Per resident, the average income is €37.800, which is €2.900 (8%) higher than the national average of €34.900. Most residents of Leiderdorp are highly educated. 41,7% have a university or higher professional education (HBO/WO), 37,1% have an intermediate education (HAVO, VWO or MBO 2-4) and 21,2% have a lower education (VMBO or MBO 1).
Of the 27.751 residents, around 73% are in paid employment, which amounts to 20.258 people. This is 1% higher than the national average of 72%. The majority of workers are in salaried employment (85%), while 15% are self-employed. In Leiderdorp, 27% of residents receive a benefit. The largest group is those receiving a state pension (AOW). 5.990 people receive this benefit.
In Leiderdorp there are 12.698 homes with an average assessed value (WOZ) of €450.000. Of these, around 98% are occupied and 2% unoccupied. Most homes are owner-occupied. This amounts to 35% rental homes and 65% owner-occupied homes. Of the homes, 65% privately owned, 24% owned by housing associations and 11% owned by other landlords. The most common construction periods in Leiderdorp are 1950-1970 (26%) and 1970-1980 (25%).
There are currently no homes for sale in Leiderdorp. The most recently listed home is Munnikkenpark 5 by Kerkvliet Makelaars op Funda. No homes were sold in Leiderdorp over the past year.
There are currently no homes for rent in Leiderdorp. The most recent home is Jan de Hartogplein 36, offered by www.hureninhollandrijnland.nl. No homes were let in Leiderdorp over the past year.
No recent rental data available for Leiderdorp.
In Leiderdorp there are 8.344 addresses with a registered energy label. The most common labels are A (31%), C (23%) and B (18%). On average, an address in Leiderdorp uses 2.390 kWh of electricity per year. This is 6% below the national average of 2.550 kWh. With an annual consumption of 730 m³ per address, natural gas consumption is 9% below the national average of 800 m³.

The neighbourhood is well-maintained by both residents and the municipality. There are neighbourhood barbecues and people look out for each other. The neighbourhood is relatively new and most residents here are the first occupants of the houses, which creates a close-knit community. However, we do notice that it is somewhat difficult for newcomers to integrate.
Auto-translated to English by AII don't have much contact with neighbours myself, but everyone is friendly and I feel safe in my neighbourhood. There are several primary schools in the area and secondary schools are not far either.
Auto-translated to English by AIGood place to live
Auto-translated to English by AINice neighbourhood shops within walking distance, good bus traffic and beautiful apartment
Auto-translated to English by AIFun
Auto-translated to English by AII feel safe in the neighbourhood and all amenities are within walking distance. The neighbourhood is cosy and every now and then a neighbourhood drinks party is held at someone's home. It is a very welcoming neighbourhood.
Auto-translated to English by AITidy and quiet neighbourhood. Unfortunately no contact with the neighbours. Plenty of daily shops nearby. Transport is a bit difficult, especially at night and in the evening and early in the morning.
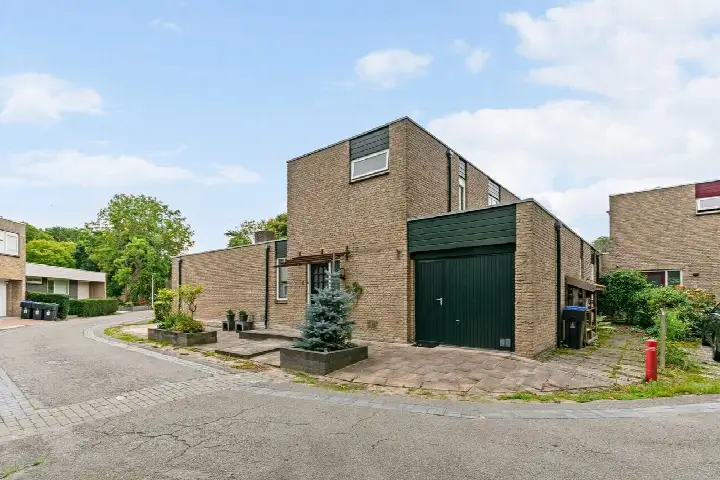
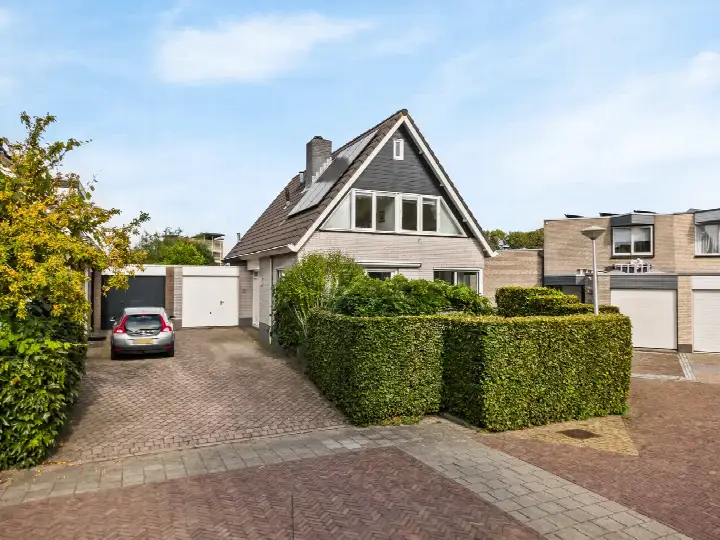
Auto-translated to English by AIThe housing stock is mainly post-war — 68% was built between 1945 and 1990. In addition, the most common type is flats (45%).
Over the past year a home for sale in Leiderdorp was listed for an average of €519,567 (€4,460 per m²). Last quarter prices rose by 11%.
A rental home in Leiderdorp cost an average of €2,132 per month (€17 per m²).
Residents give Leiderdorp a 8.0 out of 10 based on 7 reviews. The strongest score is for nature and greenery (8.7), the weakest for community (6.7).
From Leiderdorp you can on average reach a supermarket at 0.7 km, a GP at 1.0 km, a railway station at 4.4 km, a primary school at 0.6 km (as the crow flies, source: CBS).
Right now you will find 112 homes for sale and 13 homes for rent in Leiderdorp.