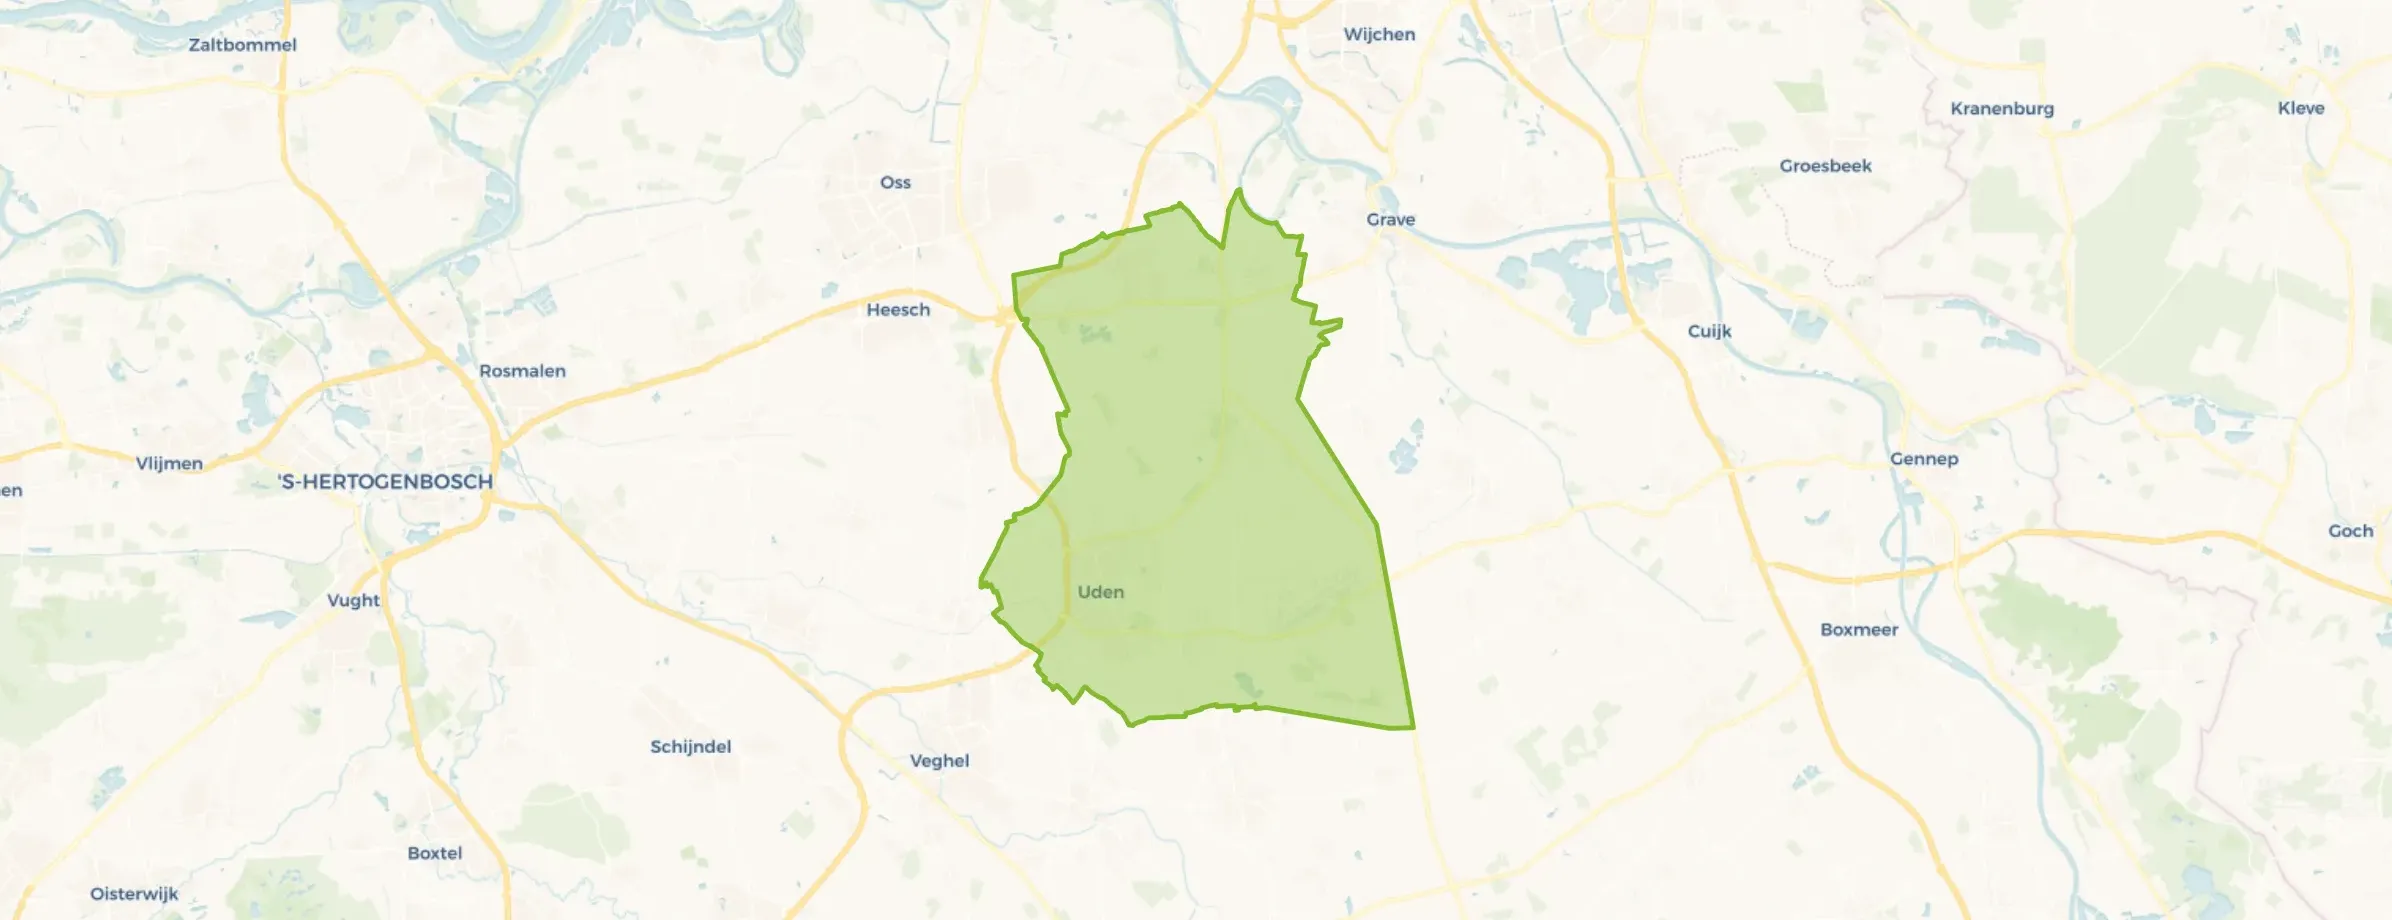
Municipality in Noord-Brabant
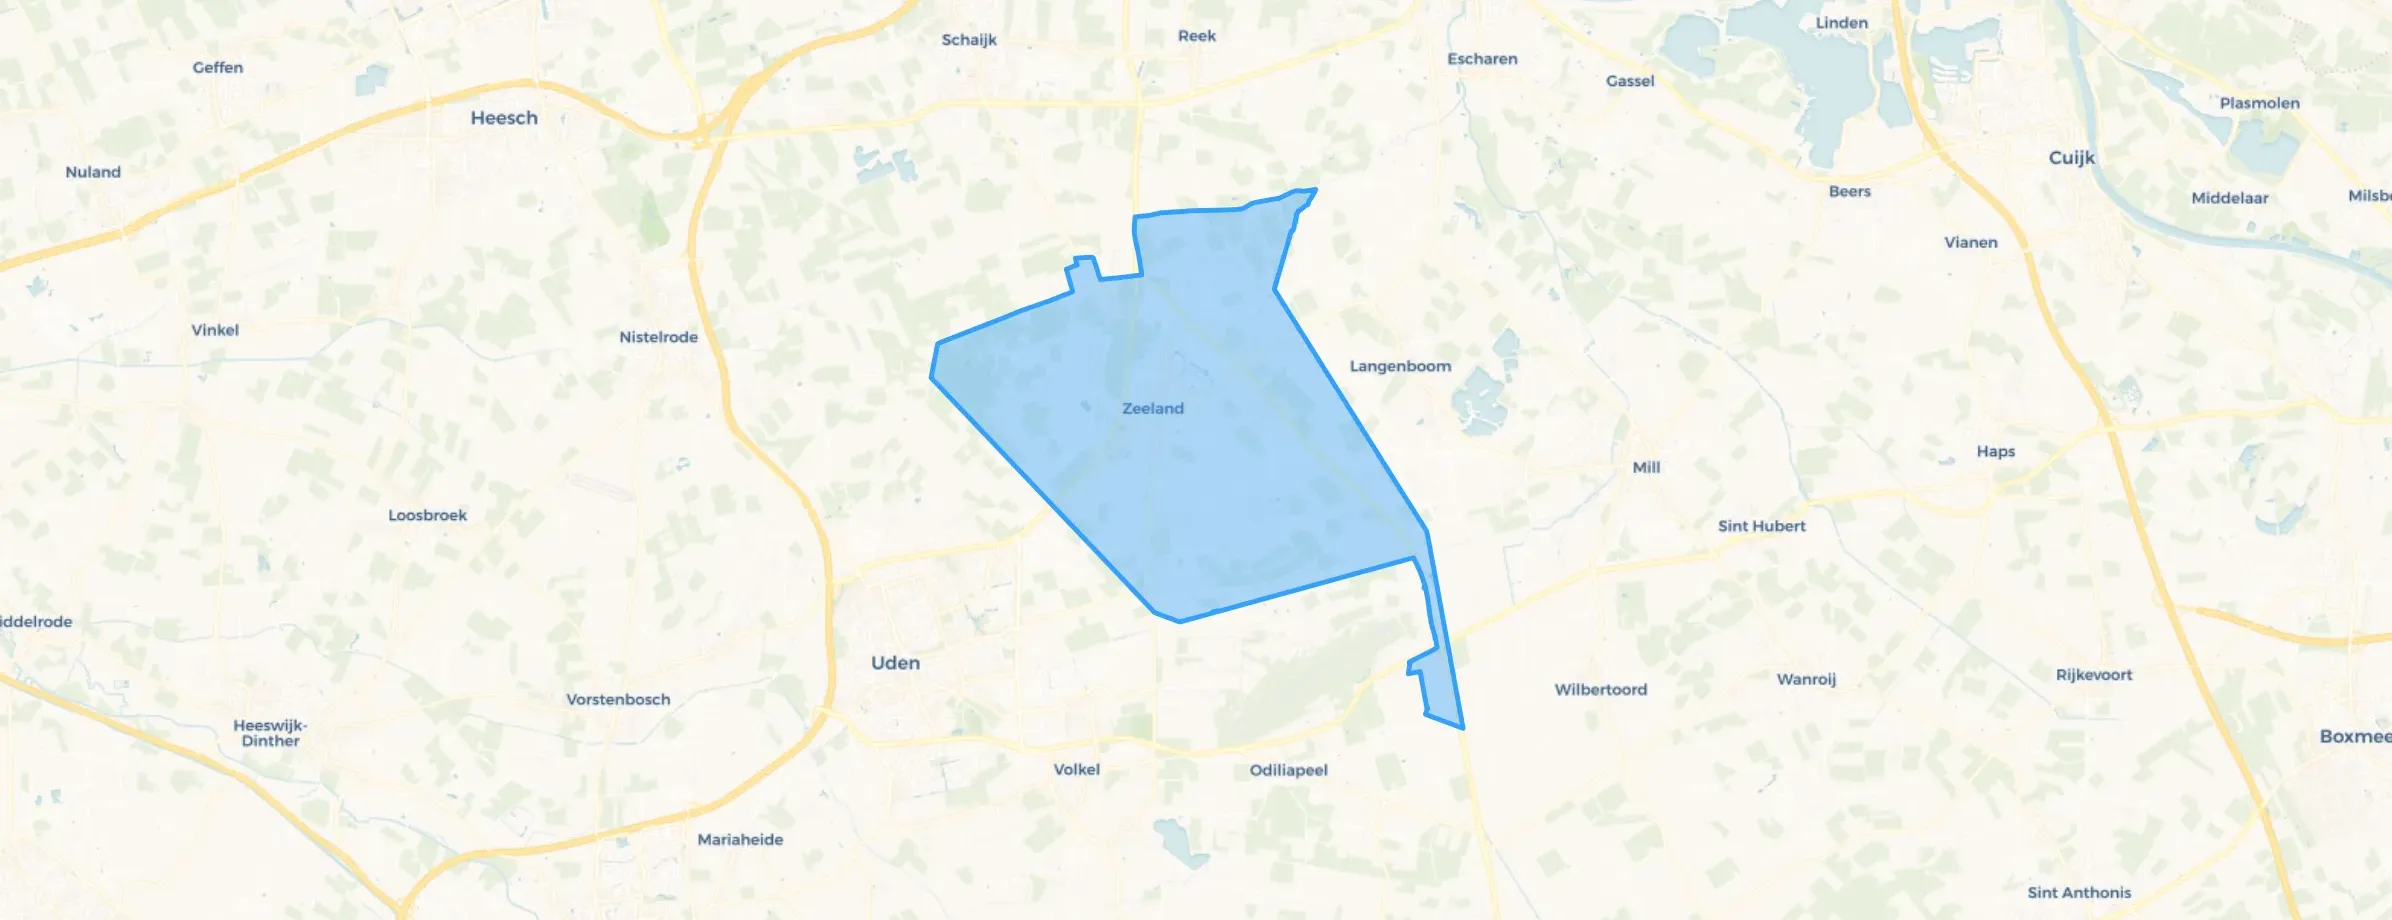
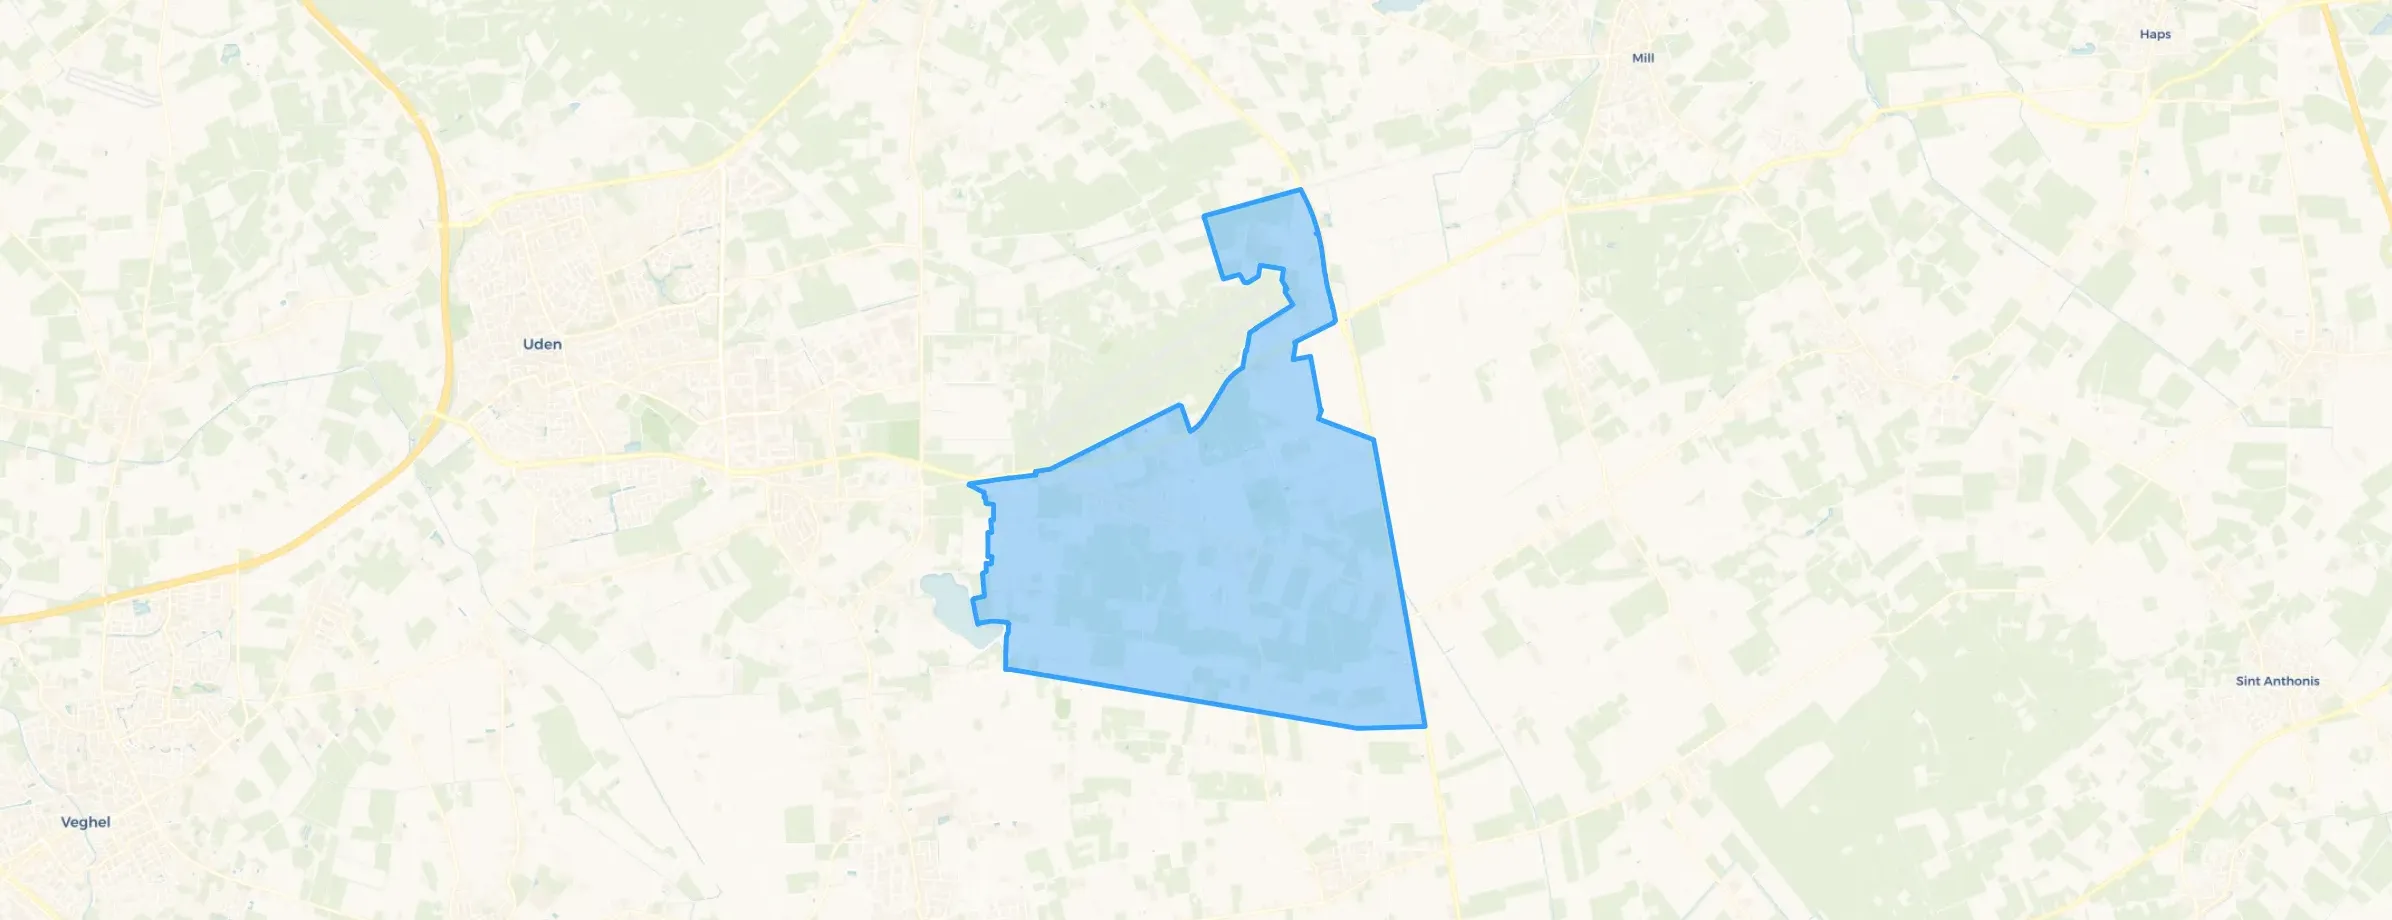
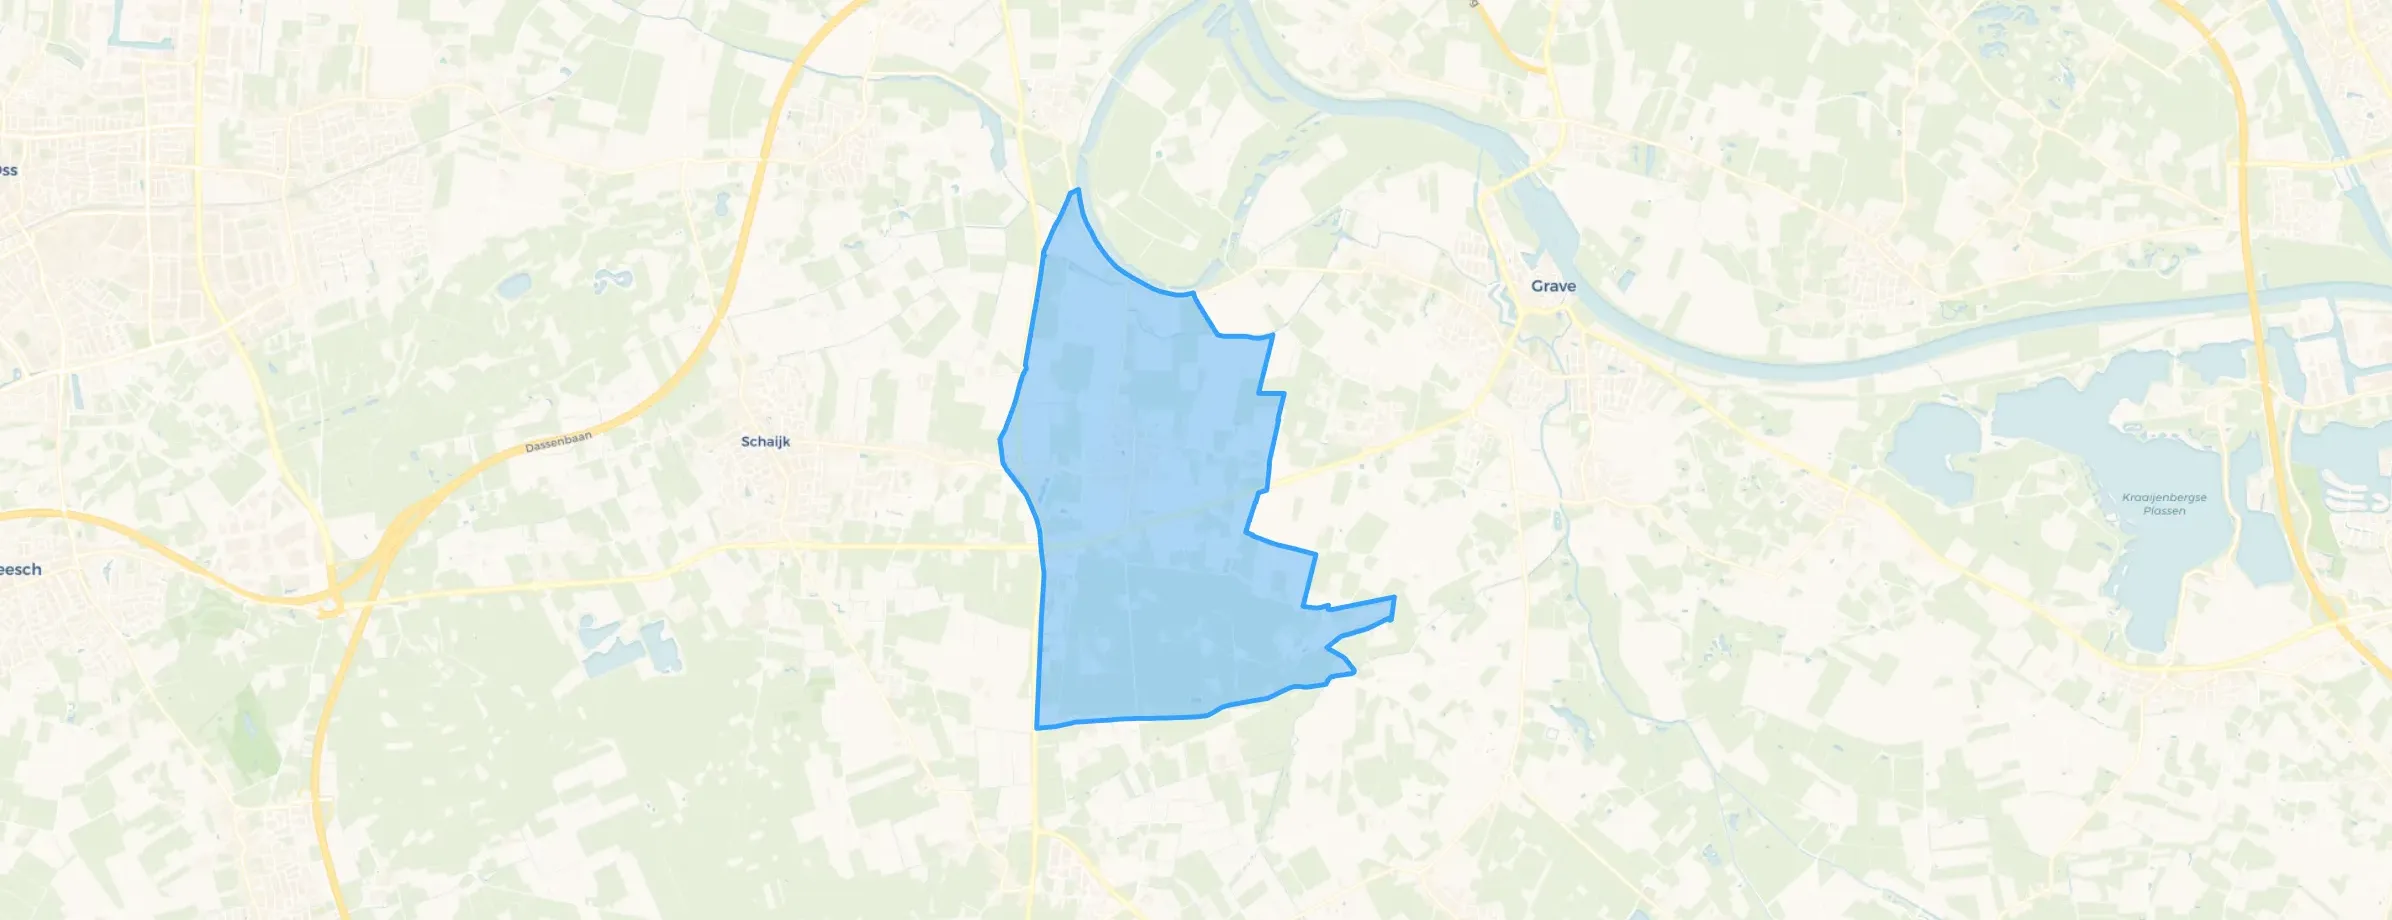
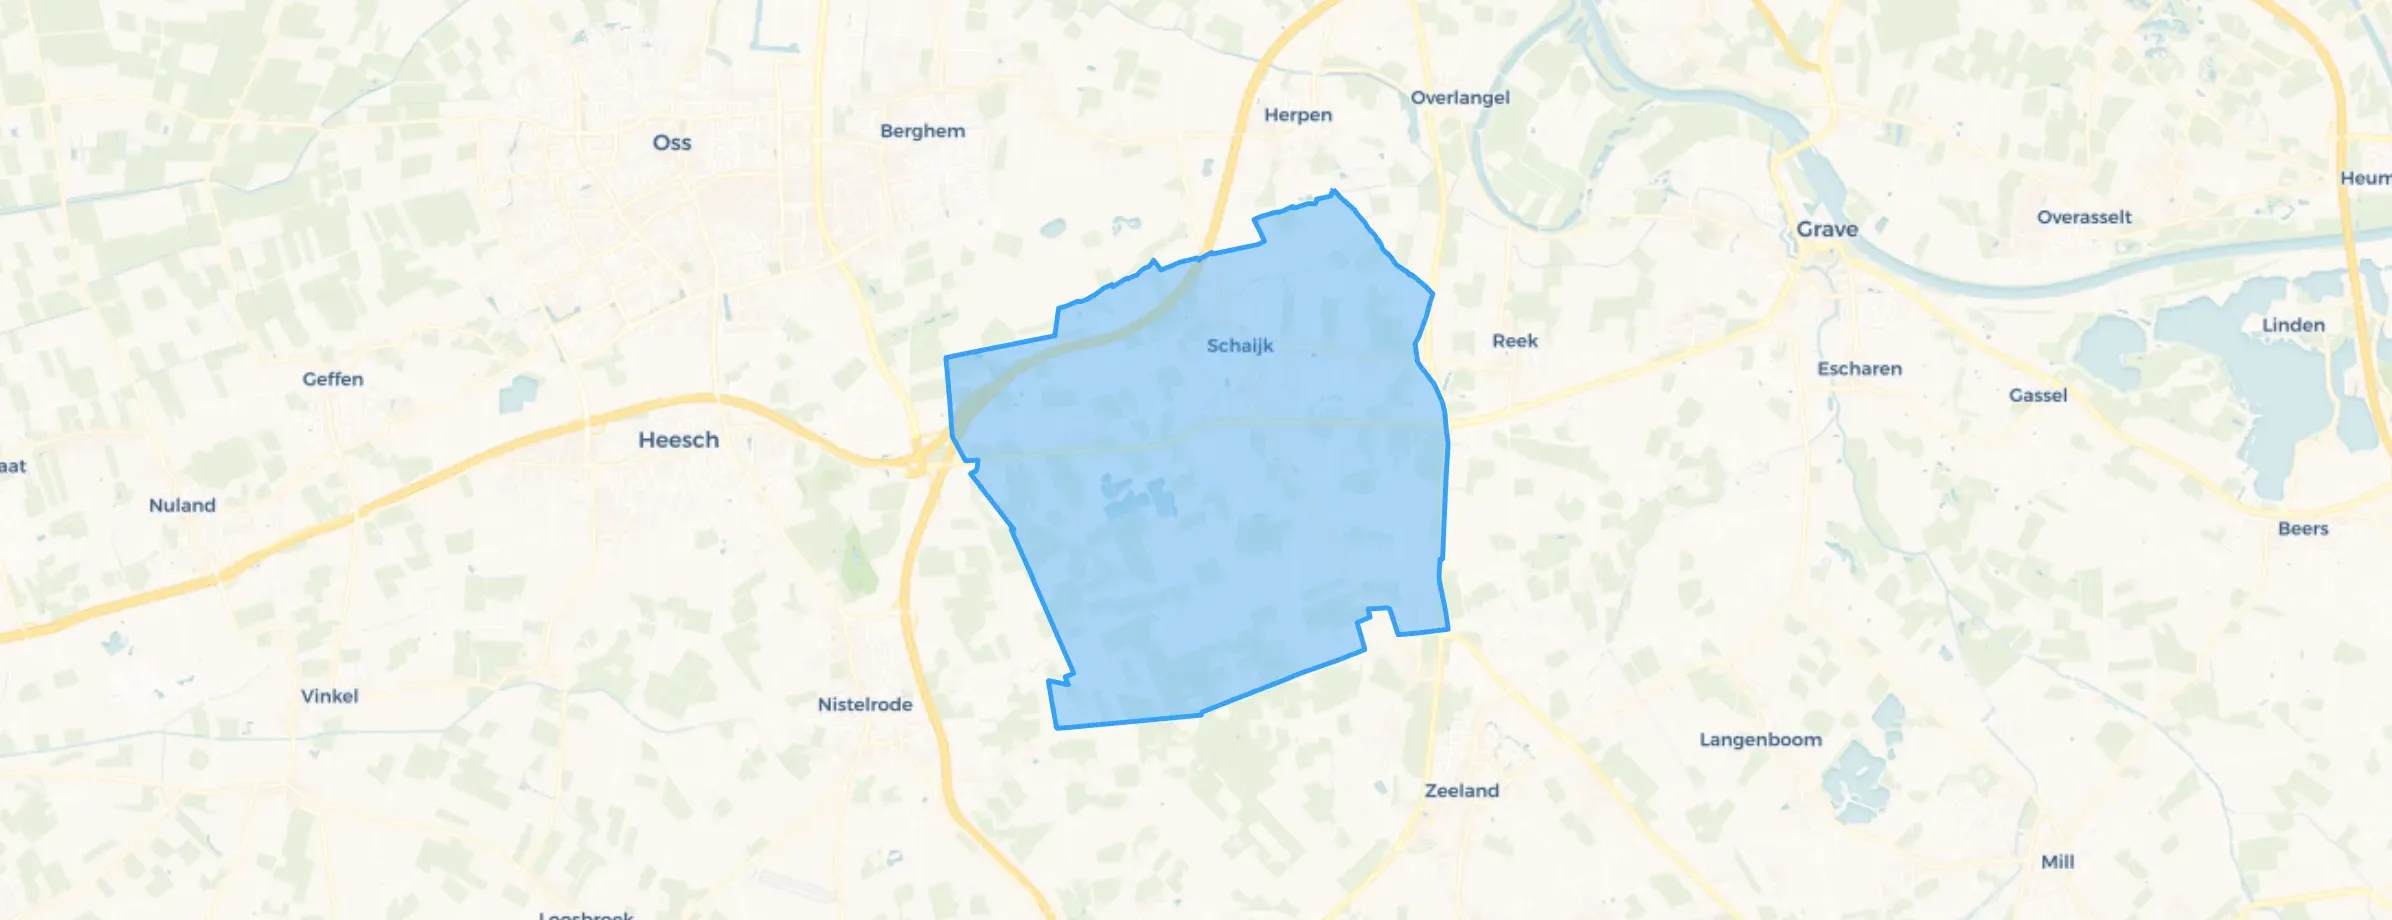
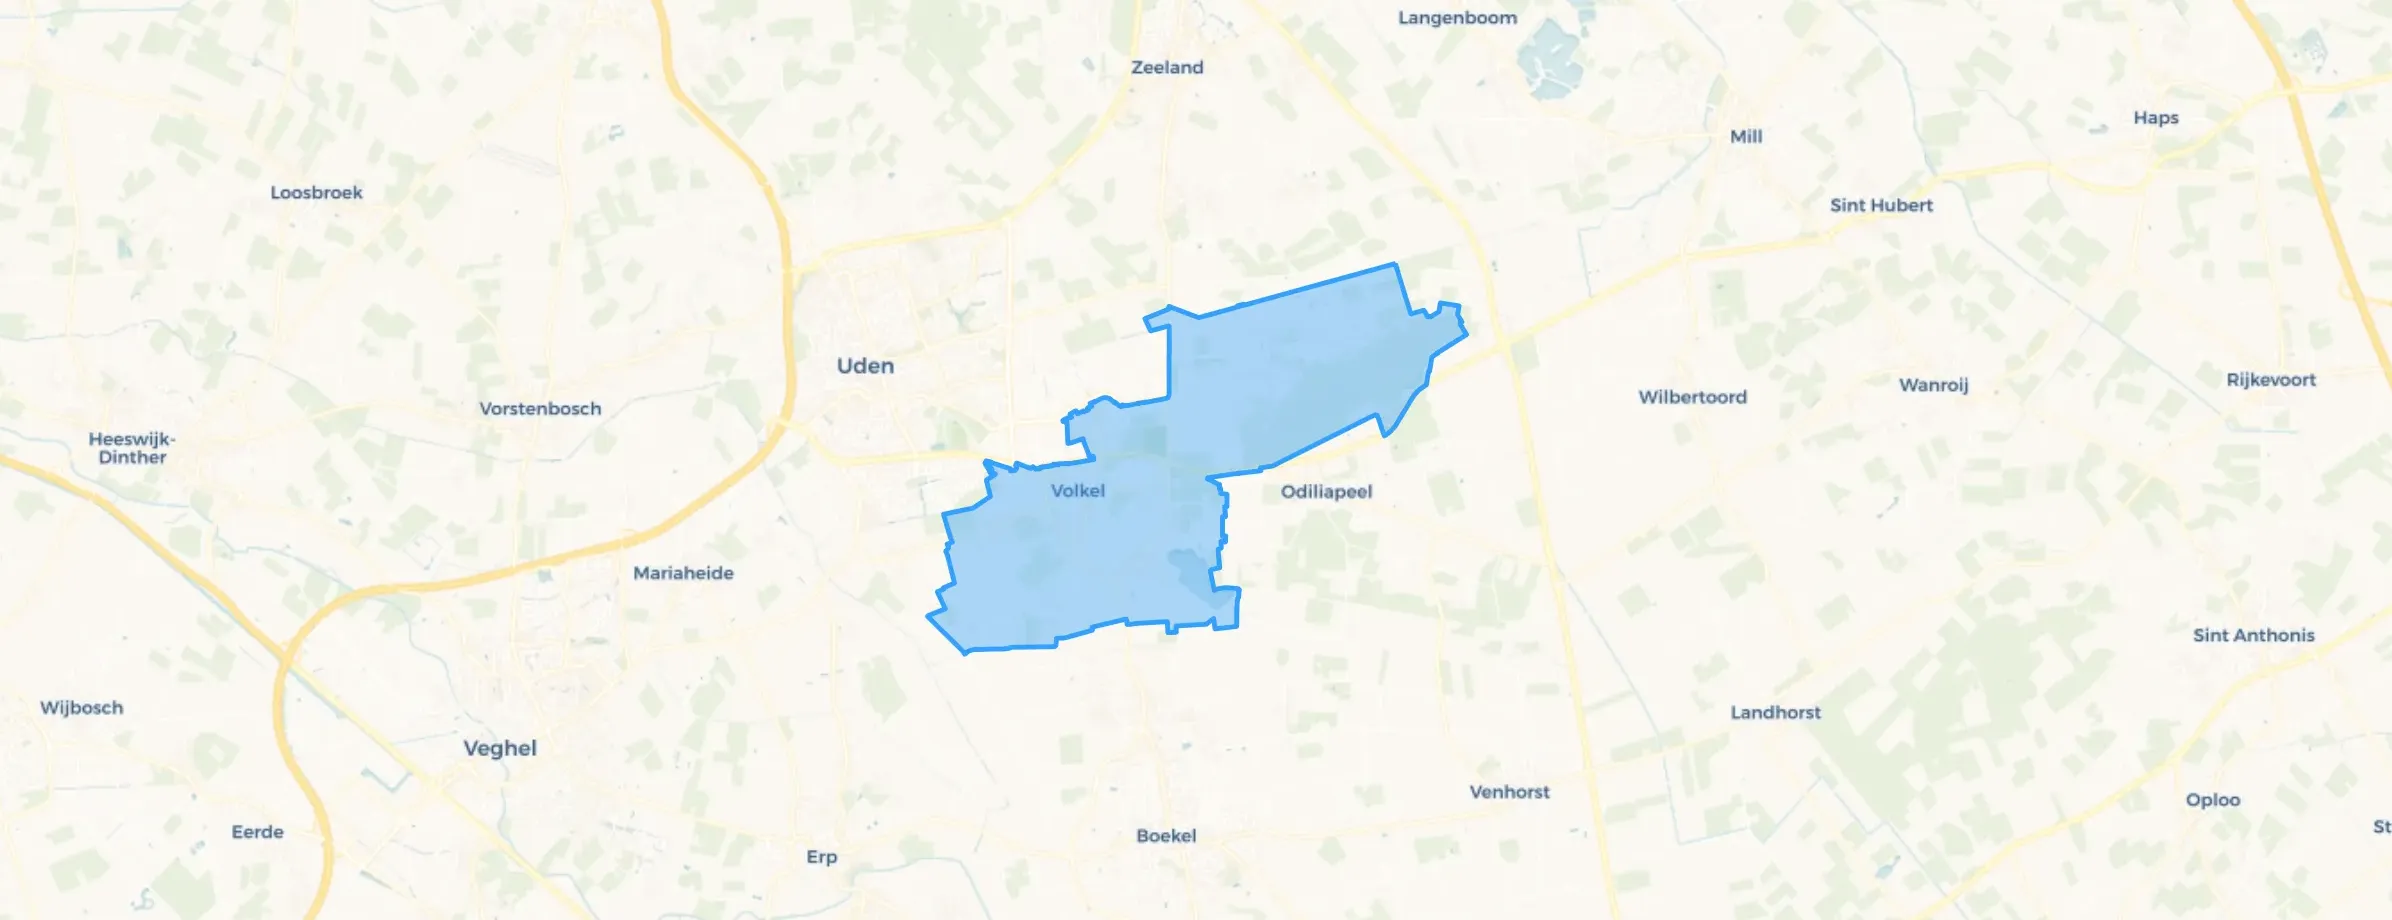
Maashorst is located in the province of Noord-Brabant The municipality has a total area of 13.824 hectares, of which 13.733 hectares are land and 91 hectares are water. The municipality is coded as GM1991. The postcode area is 5374AA-5411VD.
Maashorst has 59.671 residents. Of these, 50,2% are men and 49,8% are women. Most residents are 45 to 65 years (27,2%). The other age groups are 23,6% for '25 to 45 years', 23,2% for '65 years or older', 14,9% for '0 to 15 years' and 11,1% for '15 to 25 years'. Of the residents, 47,2% is unmarried, 39,7% is married, 7,7% is divorced and 5,5% is widowed. 49.135 residents originate from the Netherlands, 4.115 come from Europe and 6.421 come from countries outside Europe.
There are 26.397 households in Maashorst. 34,6% of these are single-person households, 30,9% households without children and 34,5% households with children. The average household size is 2,2 persons. The national average is 2,1 persons.
In Maashorst there are 48.800 income recipients. The average income per income recipient is €40.500, which is €1.700 (4%) lower than the national average of €42.200. Per resident, the average income is €34.000, which is €900 (3%) lower than the national average of €34.900. Most residents of Maashorst are educated to an intermediate level. 44,1% have an intermediate education (HAVO, VWO or MBO 2-4), 28,4% have a university or higher professional education (HBO/WO) and 27,5% have a lower education (VMBO or MBO 1).
Of the 59.671 residents, around 74% are in paid employment, which amounts to 44.157 people. This is 2% higher than the national average of 72%. The majority of workers are in salaried employment (83%), while 17% are self-employed. In Maashorst, 28% of residents receive a benefit. The largest group is those receiving a state pension (AOW). 12.500 people receive this benefit.
In Maashorst there are 26.571 homes with an average assessed value (WOZ) of €423.000. Of these, around 96% are occupied and 4% unoccupied. Most homes are owner-occupied. This amounts to 35% rental homes and 65% owner-occupied homes. Of the homes, 64% privately owned, 26% owned by housing associations and 10% owned by other landlords. The most common construction periods in Maashorst are 1970-1980 (21%) and 1950-1970 (20%).
There are currently no homes for sale in Maashorst. The most recently listed home is Krijten 24 by Van der Krabben Makelaardij Uden op Funda. No homes were sold in Maashorst over the past year.
There are currently no homes for rent in Maashorst. The most recent home is Efferen 325, offered by NMG vastgoed kantoor Eindhoven op Funda. No homes were let in Maashorst over the past year.
No recent rental data available for Maashorst.
In Maashorst there are 17.754 addresses with a registered energy label. The most common labels are A (30%), C (22%) and B (18%). On average, an address in Maashorst uses 2.910 kWh of electricity per year. This is 14% above the national average of 2.550 kWh. Natural gas consumption, at 900 m³ per year, is 13% above the national average of 800 m³.
Wonderful to live here and provide care for the elderly who live here
Auto-translated to English by AIPleasant
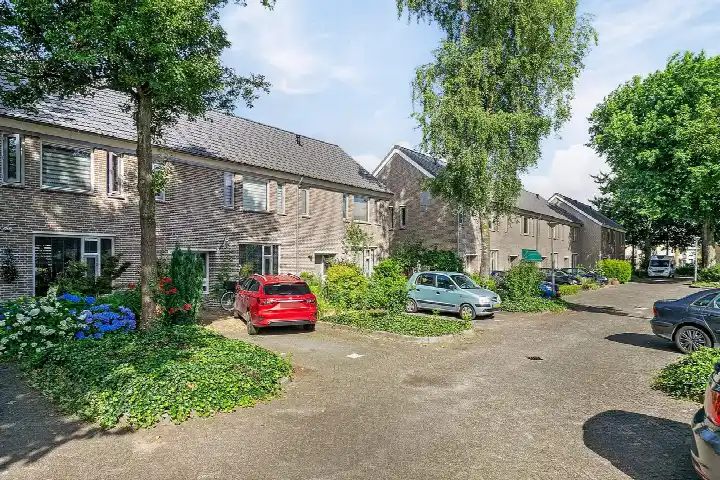
Auto-translated to English by AIWe came to live here on 12 July 2035. Nice, friendly people, neighbourhood close to the centre. No unsafe situations. Supermarket with all kinds of products. GP nearby and pharmacy next to it. Plenty of parking. Lots of greenery.
Auto-translated to English by AINot many families with children live here and there are always a lot of cars driving through the street. Our neighbour also often causes nuisance. However, there is a good school in the neighbourhood and a home for the elderly.
Auto-translated to English by AII live in a corner house in a new-build neighbourhood. This is supposed to become a 'green' neighbourhood. The houses in my neighbourhood have bird nests built in, as well as bat boxes. All kinds of people live here, contact hasn't grown yet. There are a few who still keep an eye on things, including myself. And help where needed. The neighbourhood is close to the motorway, so it's accessible. Close to 2 primary schools in the neighbouring area. A nice emerging neighbourhood.
Auto-translated to English by AIEverything is okay in the neighbourhood except for the asylum seekers' centre with people who have been deported.
Auto-translated to English by AILots of space and friendly people, but little public transport
Auto-translated to English by AIThe housing stock is mainly post-war — 62% was built between 1945 and 1990.
Over the past year a home for sale in Maashorst was listed for an average of €552,662 (€3,937 per m²).
A rental home in Maashorst cost an average of €1,473 per month (€15 per m²). That is 32% below the national average.
Residents give Maashorst a 7.7 out of 10 based on 7 reviews. The strongest score is for nature and greenery (8.3), the weakest for community (6.6).
Gemeente Maashorst has 59,671 residents. Many families: 35% of the households have children.
The housing supply in Maashorst is remarkably efficient: 59% has an A, A+ or B label. The average natural gas consumption per household is 900 m³ per year.
From Maashorst you can on average reach a supermarket at 0.9 km, a GP at 1.3 km, a railway station at 14.0 km, a primary school at 0.8 km (as the crow flies, source: CBS).
Right now you will find 293 homes for sale and 21 homes for rent in Maashorst.