Municipality in Zuid-Holland
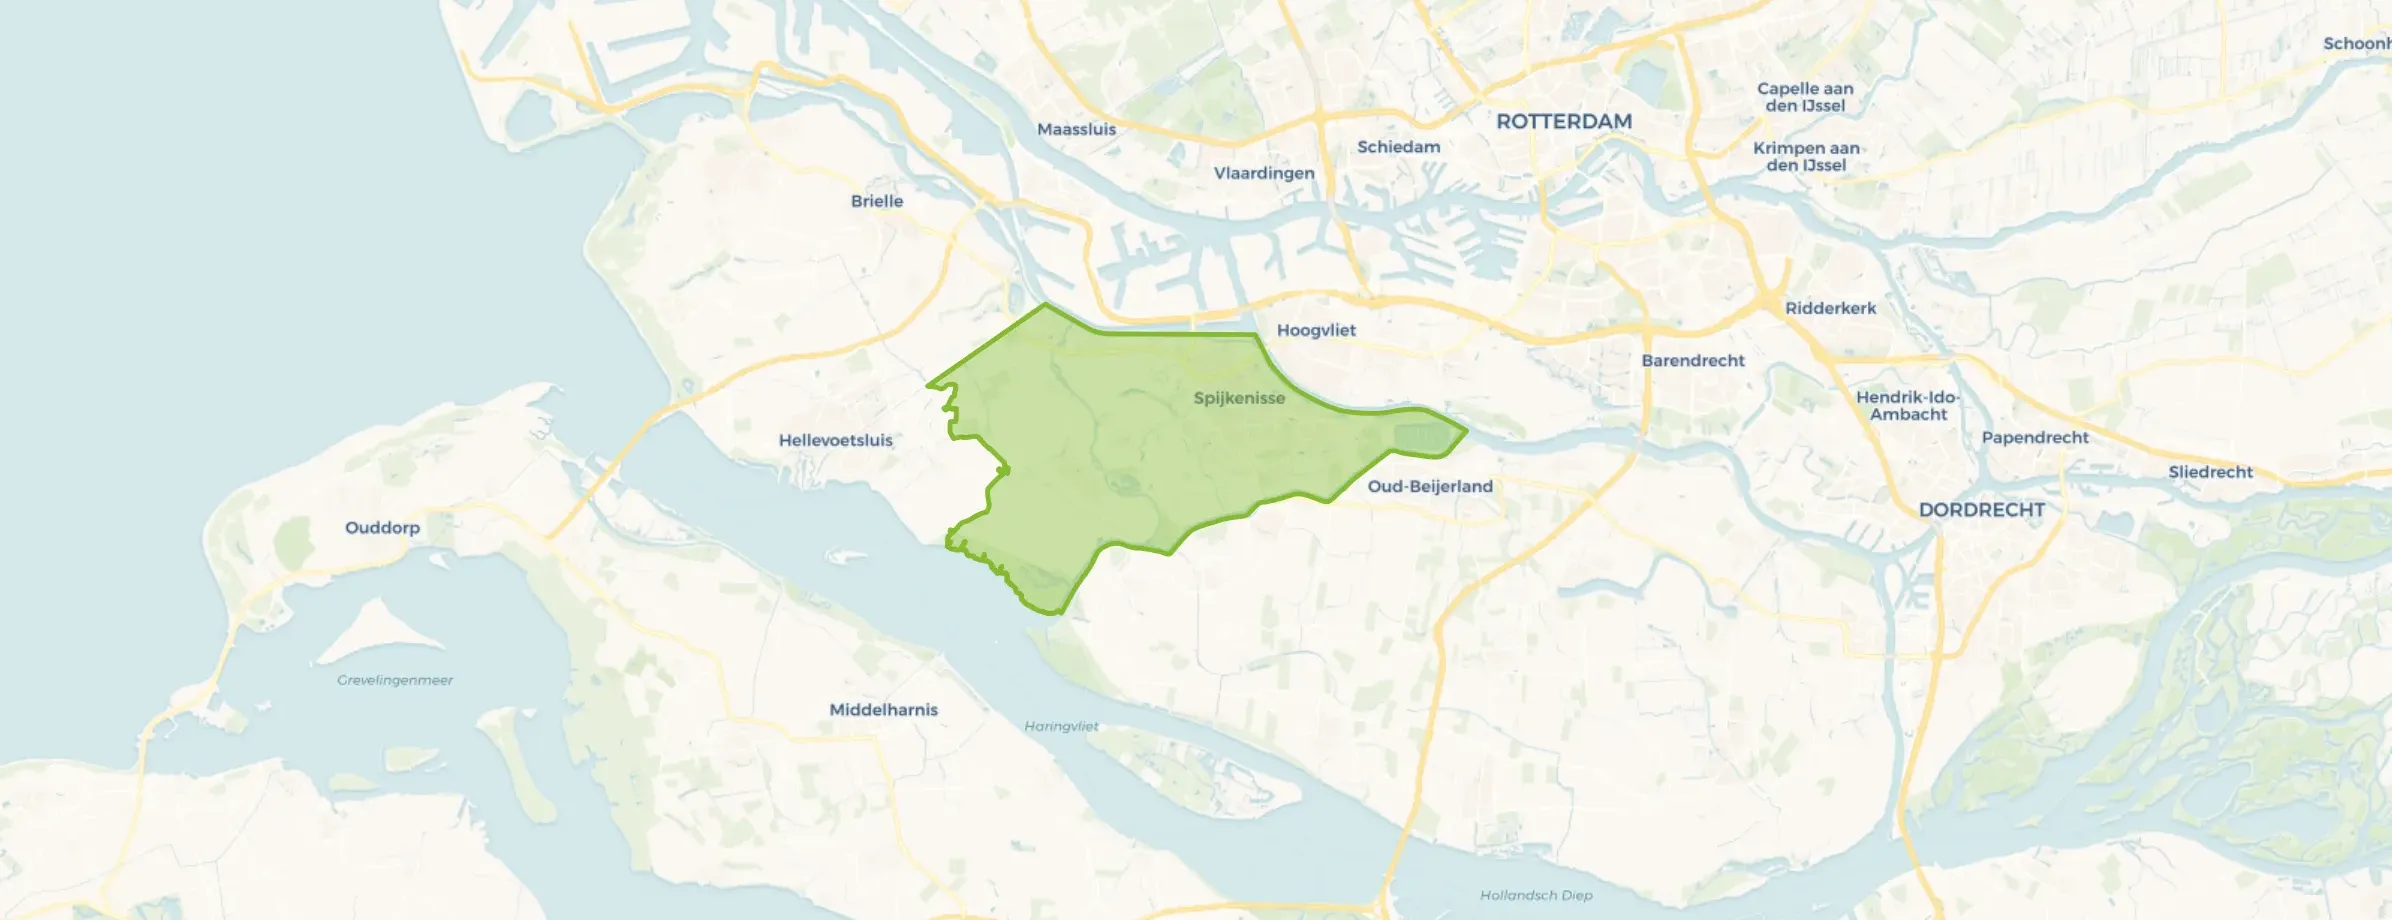
Nissewaard is located in the province of Zuid-Holland The municipality has a total area of 8.379 hectares, of which 7.331 hectares are land and 1.048 hectares are water. The municipality is coded as GM1930. The postcode area is 3201AA-3218XW.
Nissewaard has 88.341 residents. Of these, 49,1% are men and 50,9% are women. Most residents are 45 to 65 years (25,9%). The other age groups are 25,7% for '25 to 45 years', 21,8% for '65 years or older', 15,8% for '0 to 15 years' and 10,7% for '15 to 25 years'. Of the residents, 46,6% is unmarried, 39,6% is married, 8,8% is divorced and 5,0% is widowed. 61.037 residents originate from the Netherlands, 7.570 come from Europe and 19.734 come from countries outside Europe.
There are 40.096 households in Nissewaard. 34,9% of these are single-person households, 29,4% households without children and 35,7% households with children. The average household size is 2,2 persons. The national average is 2,1 persons.
In Nissewaard there are 70.300 income recipients. The average income per income recipient is €41.700, which is €500 (1%) lower than the national average of €42.200. Per resident, the average income is €34.000, which is €900 (3%) lower than the national average of €34.900. Most residents of Nissewaard are educated to an intermediate level. 48,0% have an intermediate education (HAVO, VWO or MBO 2-4), 30,9% have a lower education (VMBO or MBO 1) and 21,2% have a university or higher professional education (HBO/WO).
Of the 88.341 residents, around 69% are in paid employment, which amounts to 60.955 people. This is 3% lower than the national average of 72%. The majority of workers are in salaried employment (88%), while 12% are self-employed. In Nissewaard, 27% of residents receive a benefit. The largest group is those receiving a state pension (AOW). 17.150 people receive this benefit.
In Nissewaard there are 40.514 homes with an average assessed value (WOZ) of €308.000. Of these, around 97% are occupied and 3% unoccupied. Most homes are owner-occupied. This amounts to 41% rental homes and 59% owner-occupied homes. Of the homes, 59% privately owned, 36% owned by housing associations and 5% owned by other landlords. The most common construction periods in Nissewaard are 1980-1990 (35%) and 1950-1970 (18%).
There are currently no homes for sale in Nissewaard. The most recently listed home is Olijfgaard 17 by Domek Real Estate op Funda. No homes were sold in Nissewaard over the past year.
There are currently no homes for rent in Nissewaard. The most recent home is Phobospad 1, offered by www.wittewoningmakelaars.nl. No homes were let in Nissewaard over the past year.
No recent rental data available for Nissewaard.
In Nissewaard there are 28.169 addresses with a registered energy label. The most common labels are A (28%), C (28%) and B (22%). On average, an address in Nissewaard uses 2.590 kWh of electricity per year. This is 2% above the national average of 2.550 kWh. With an annual consumption of 720 m³ per address, natural gas consumption is 10% below the national average of 800 m³.

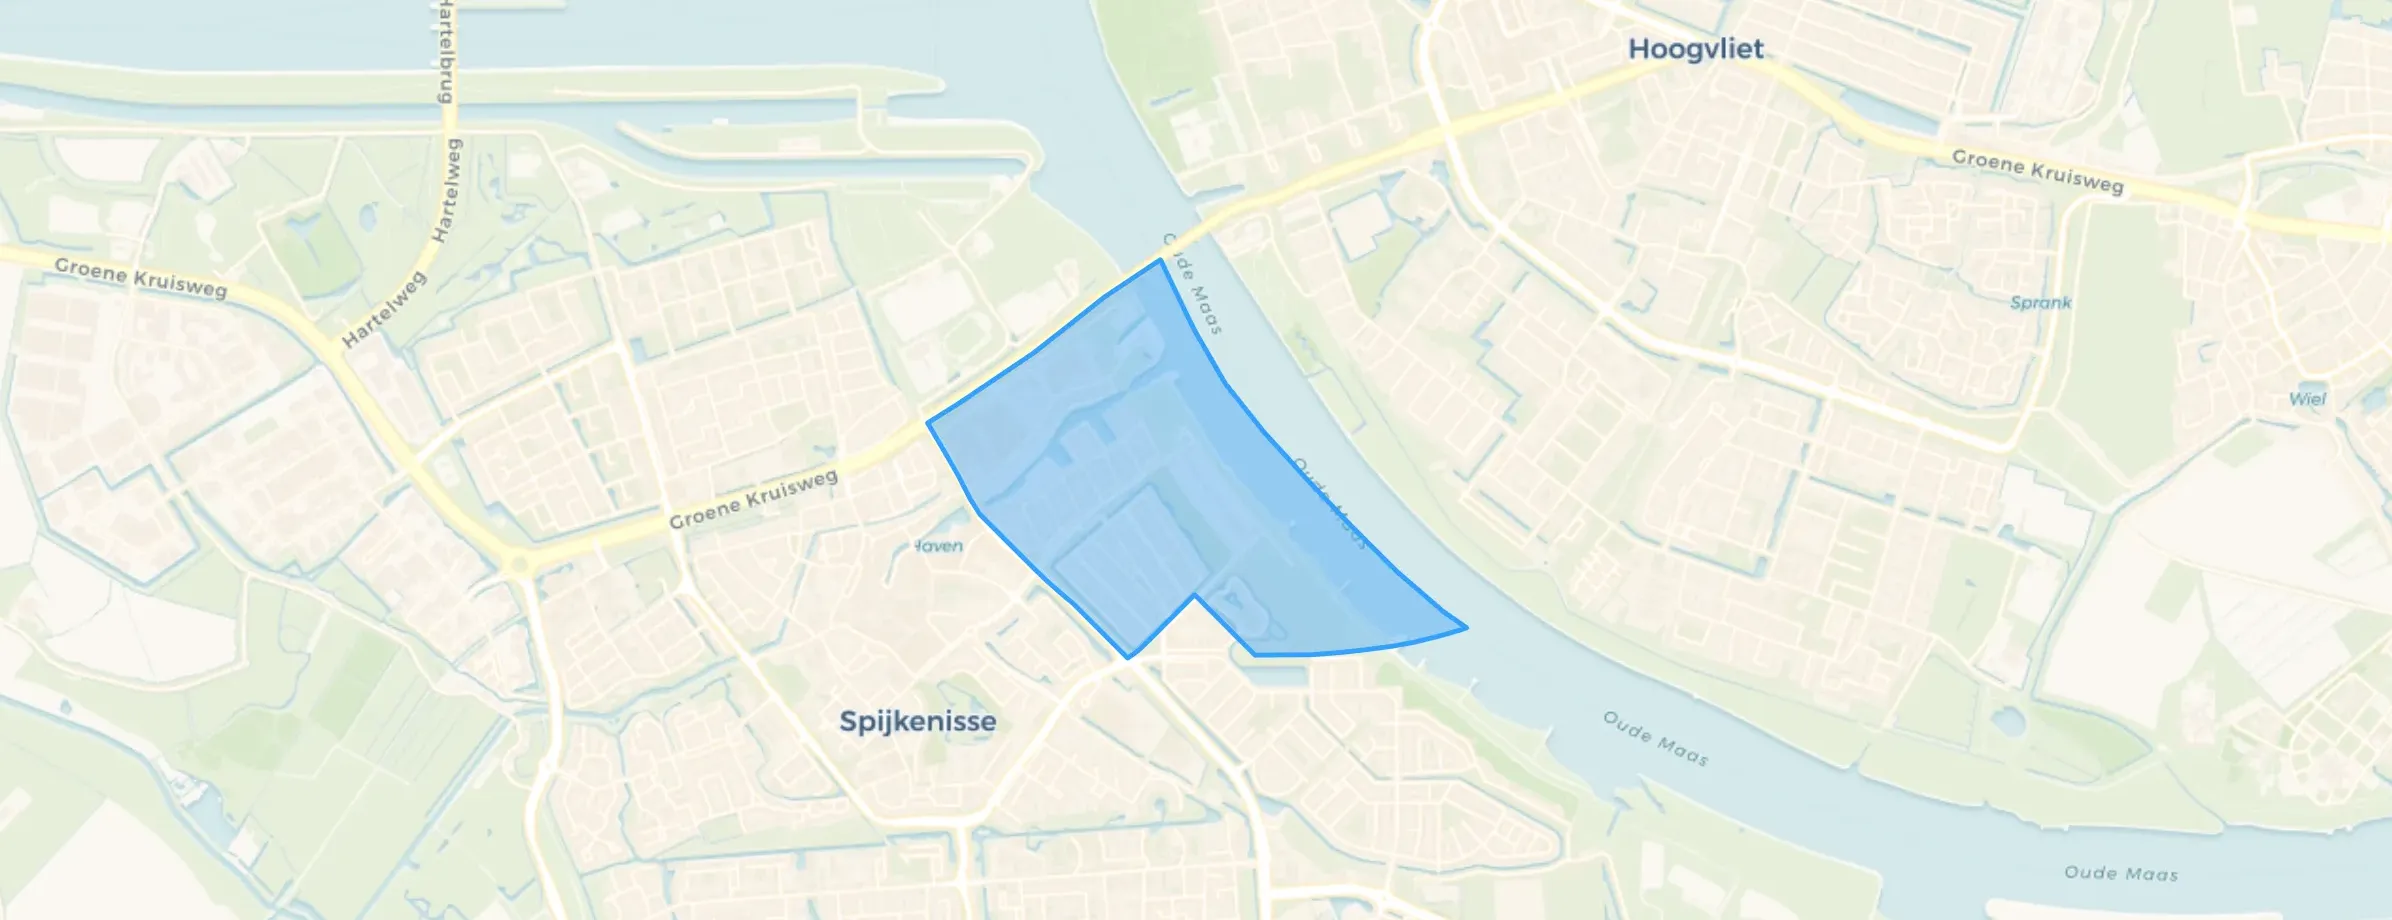

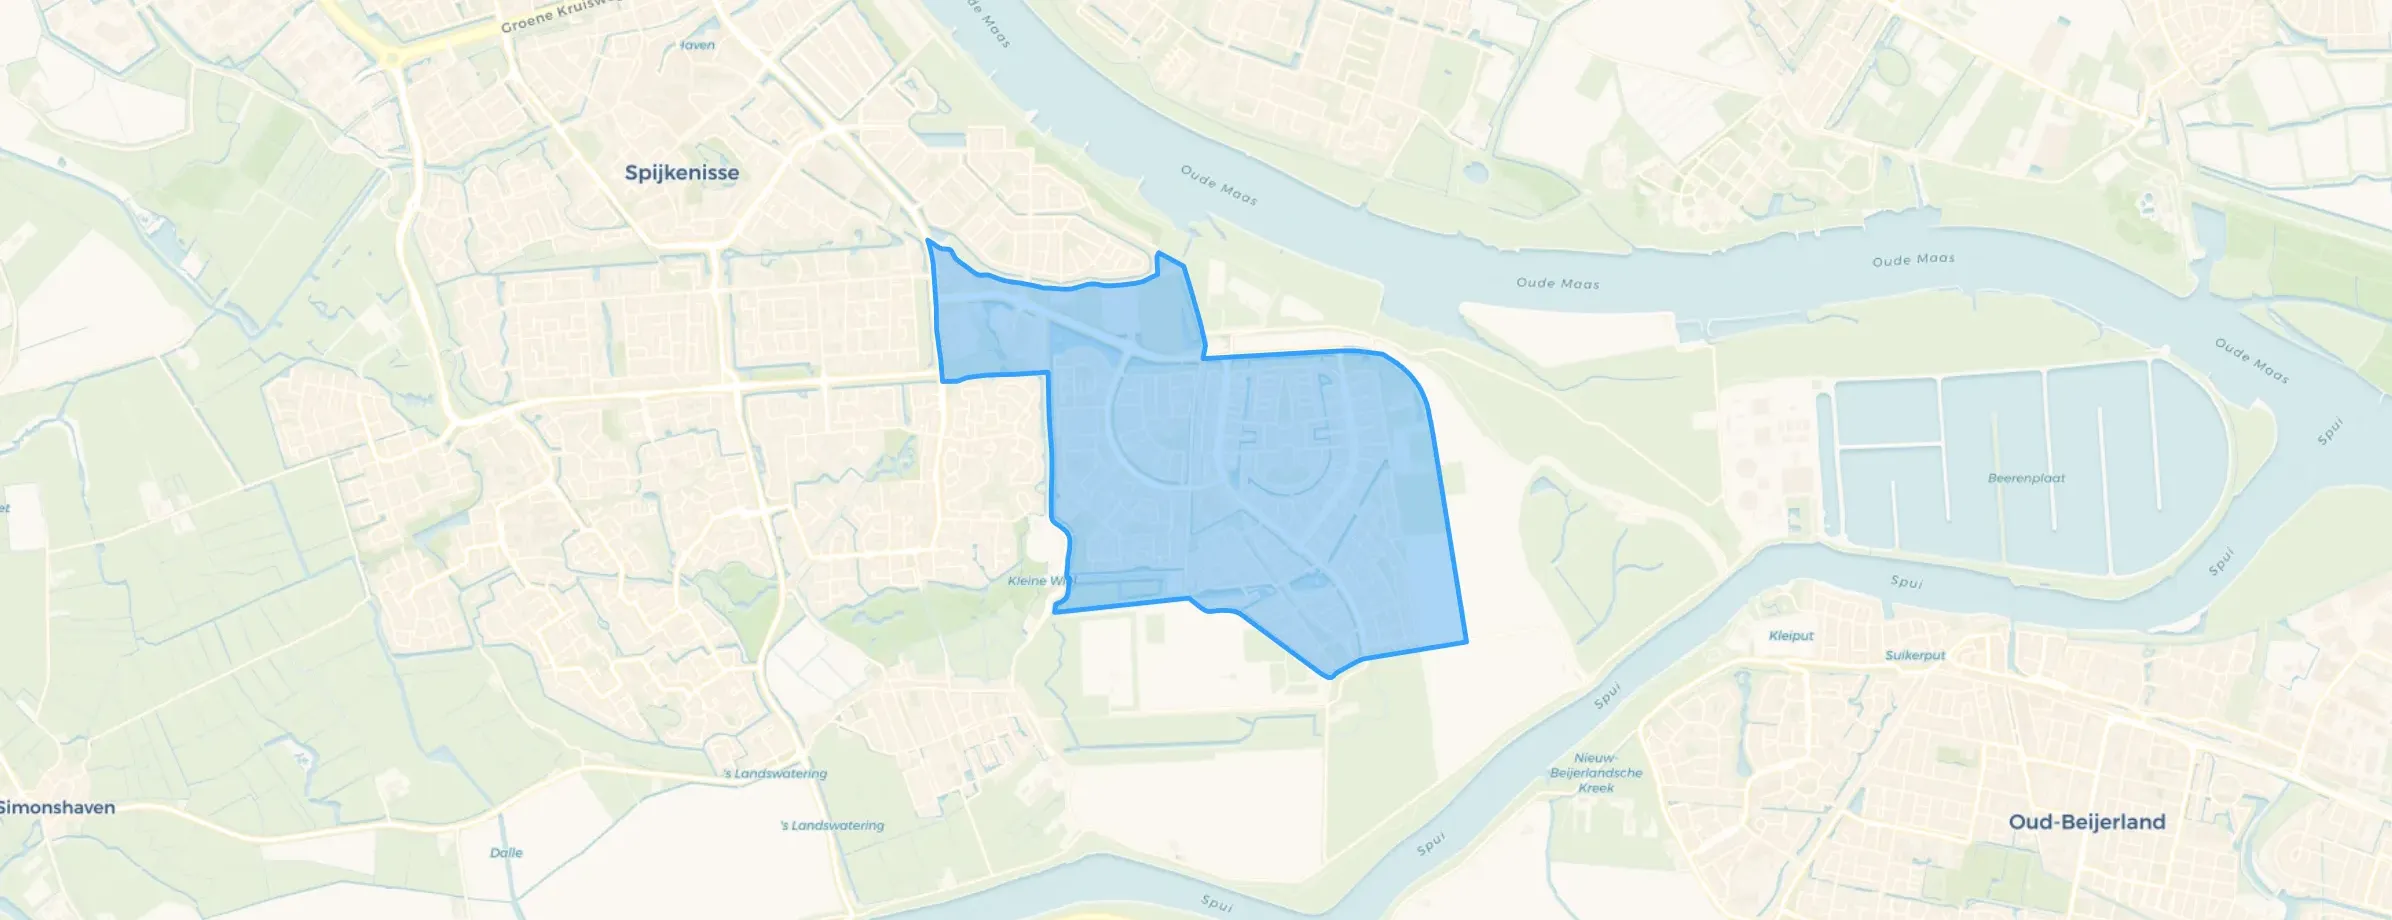
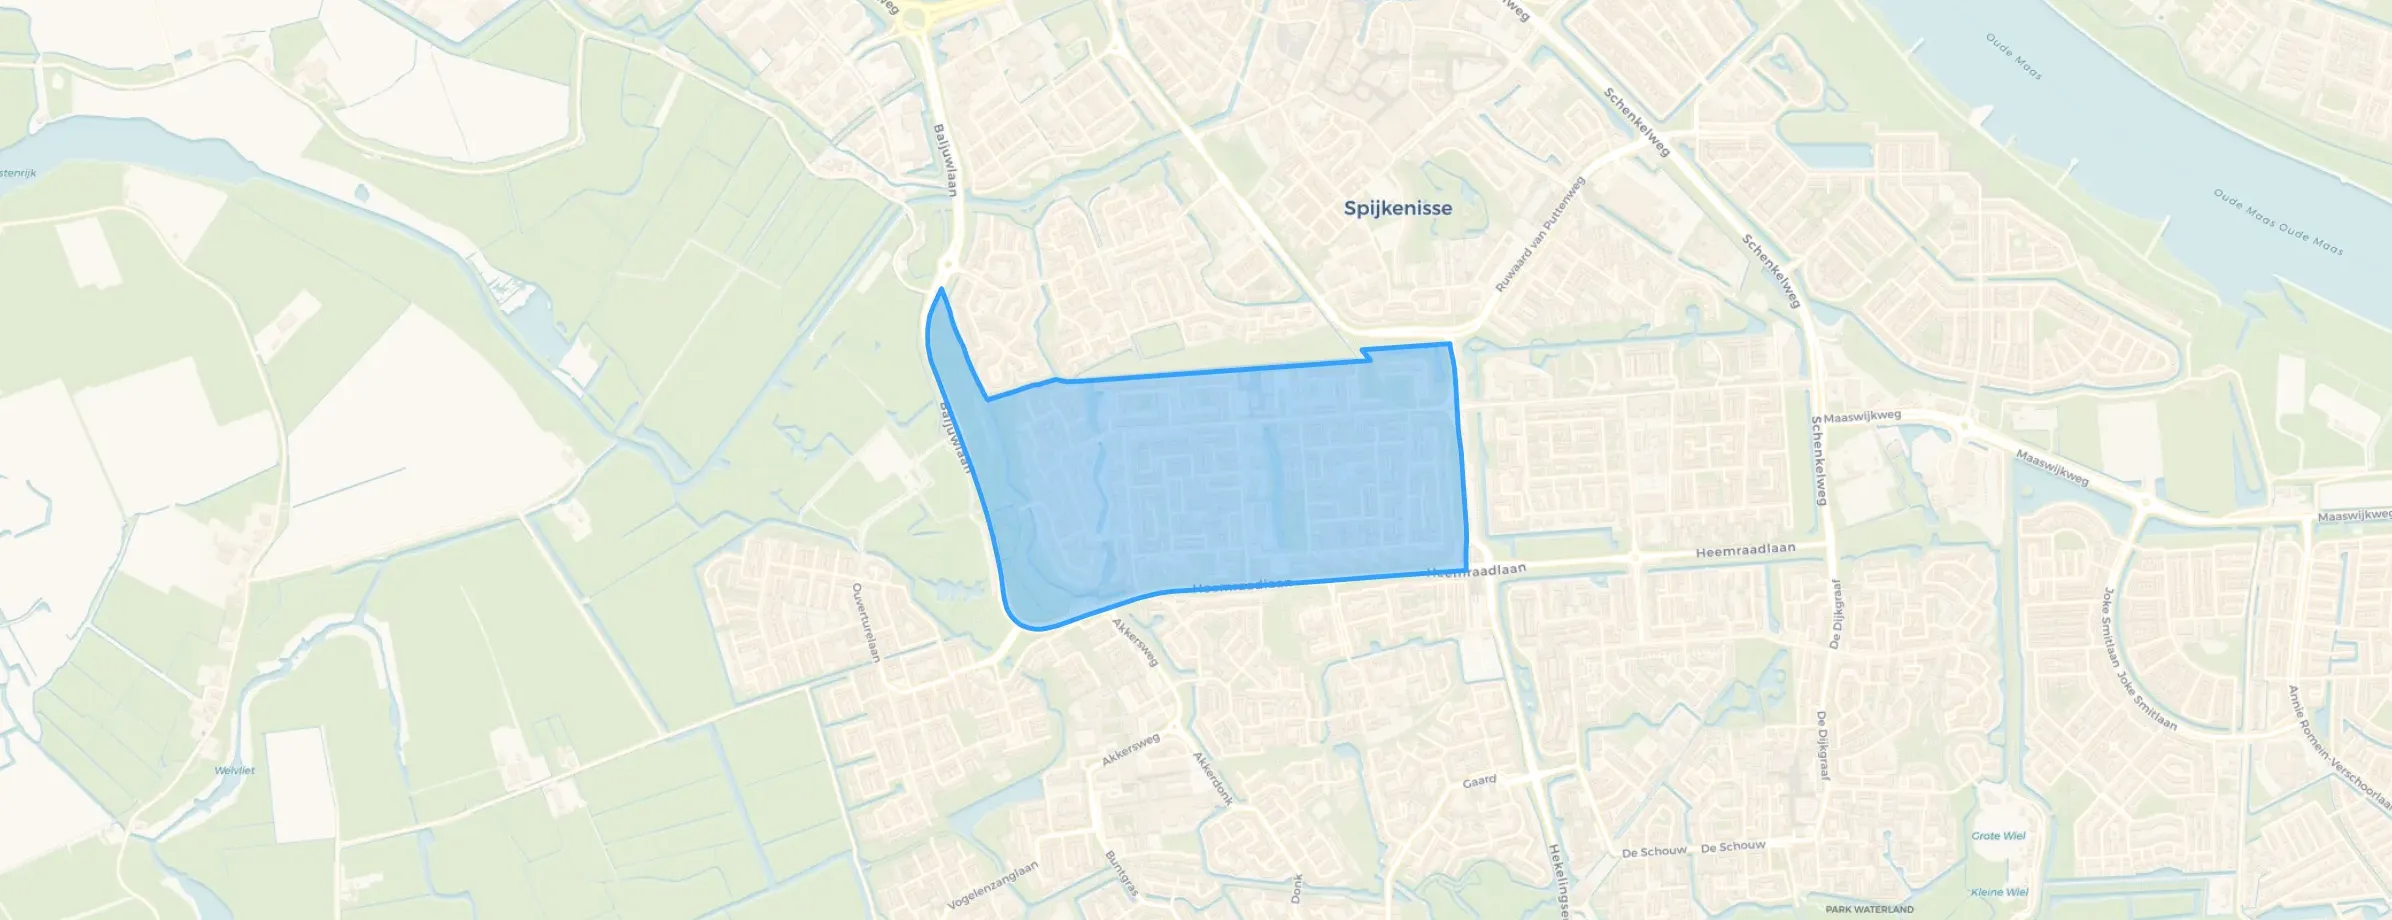
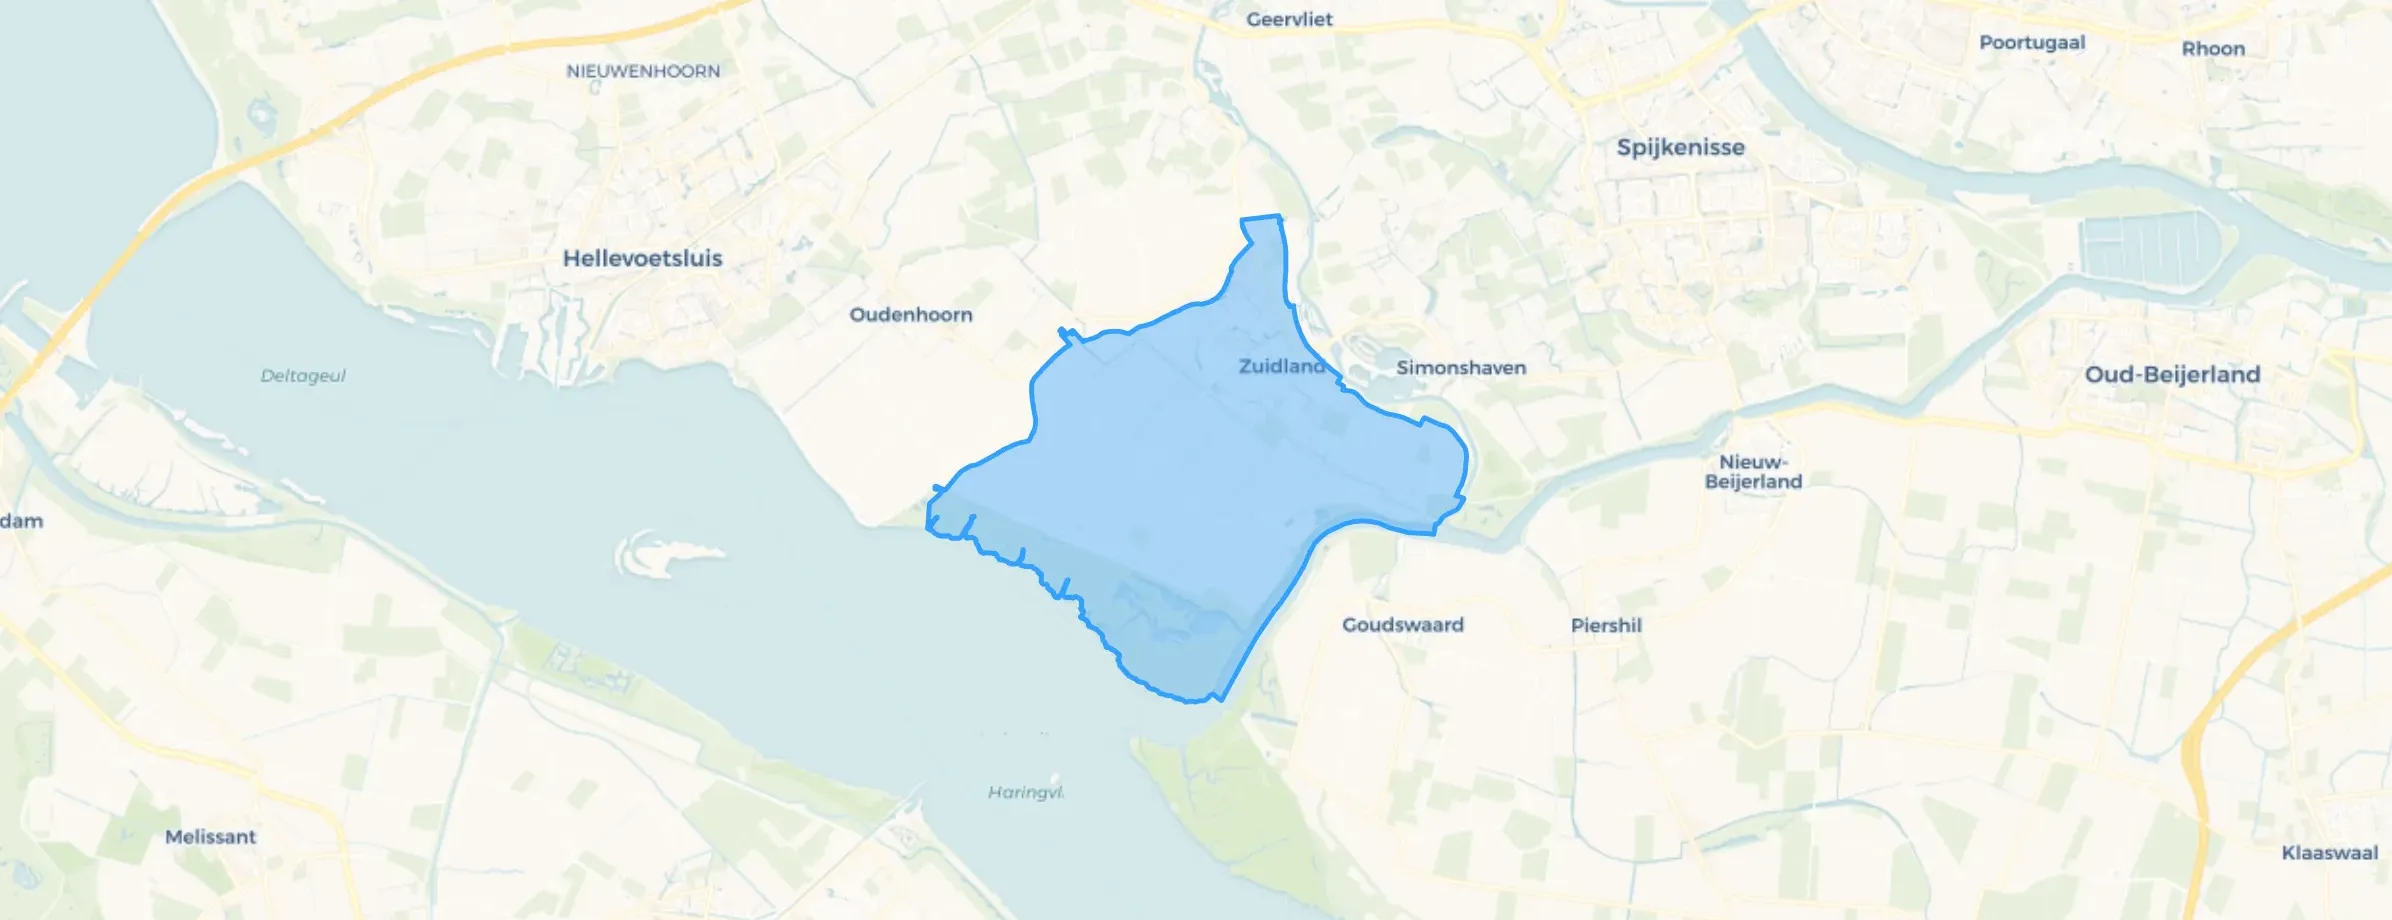
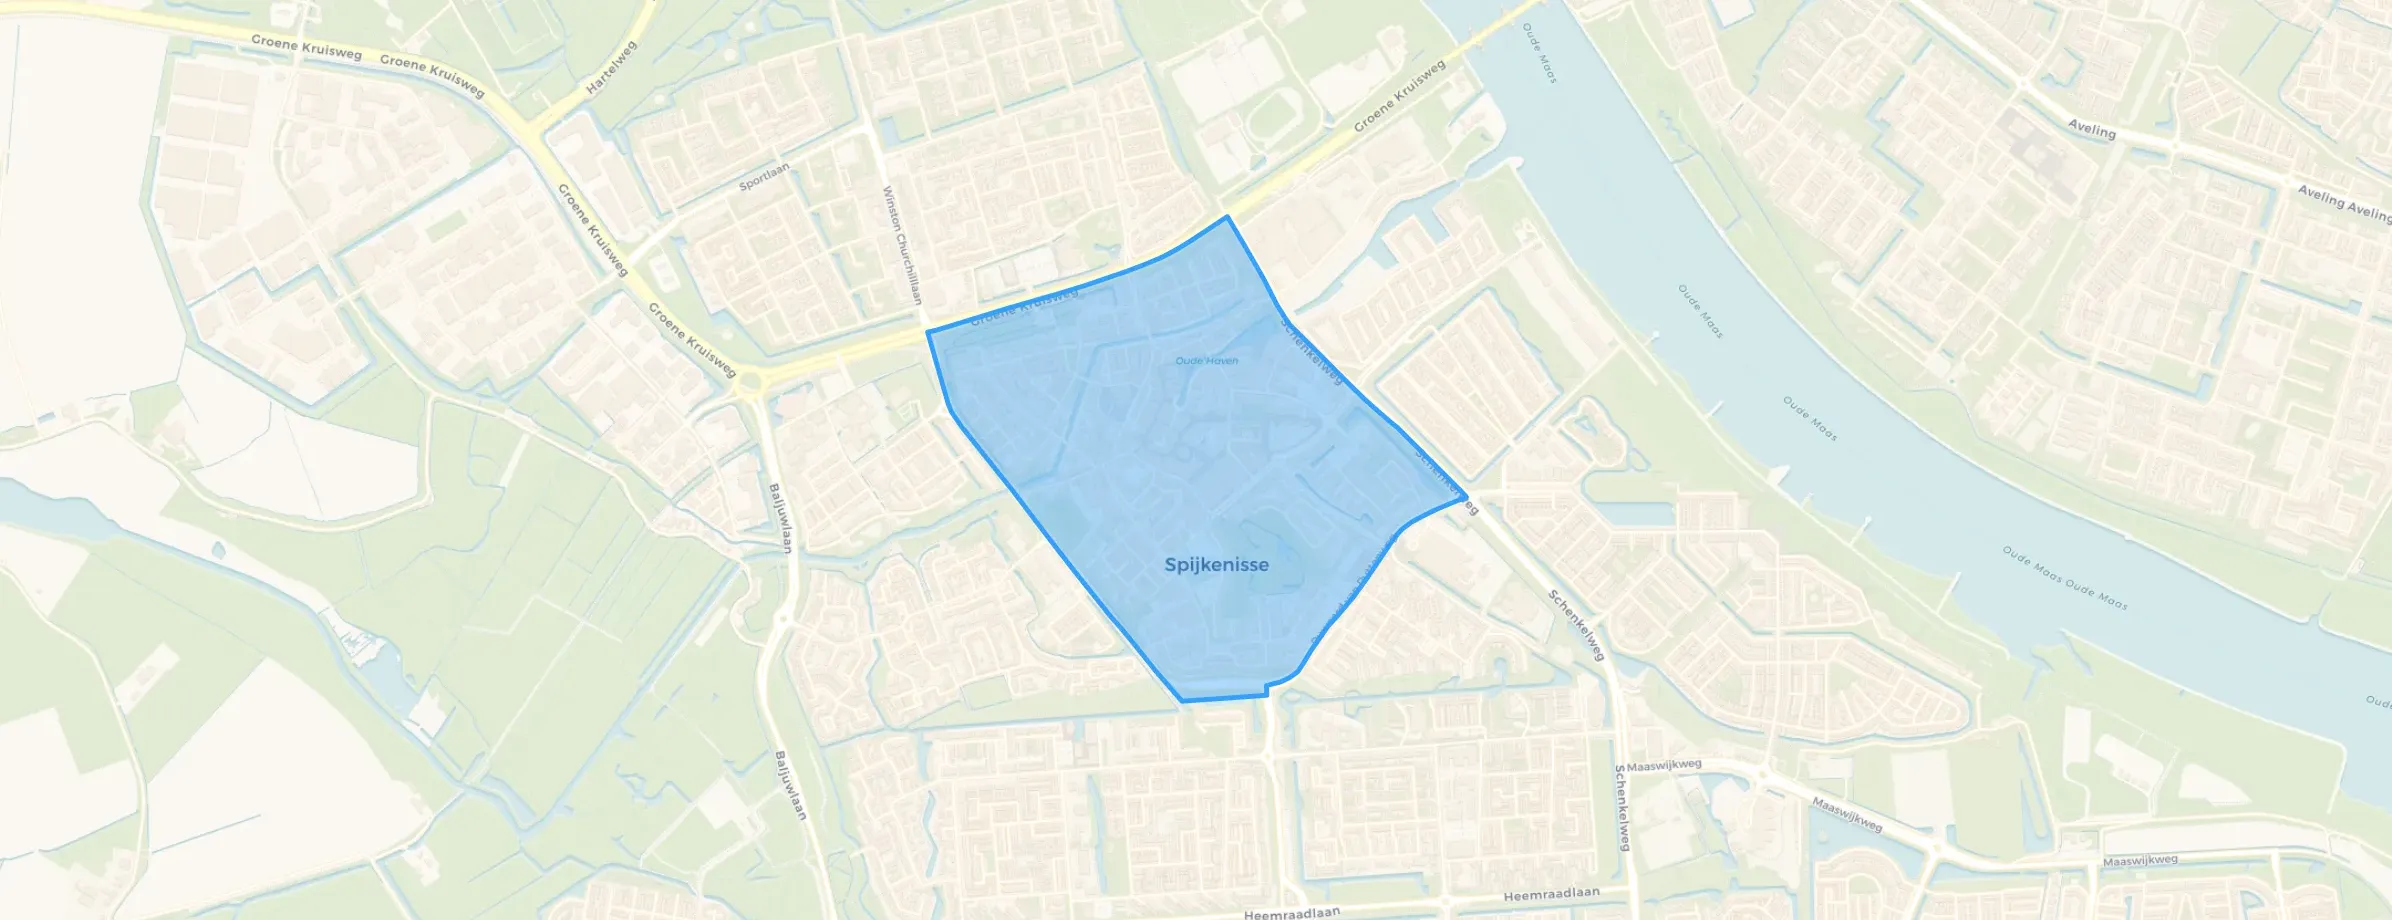
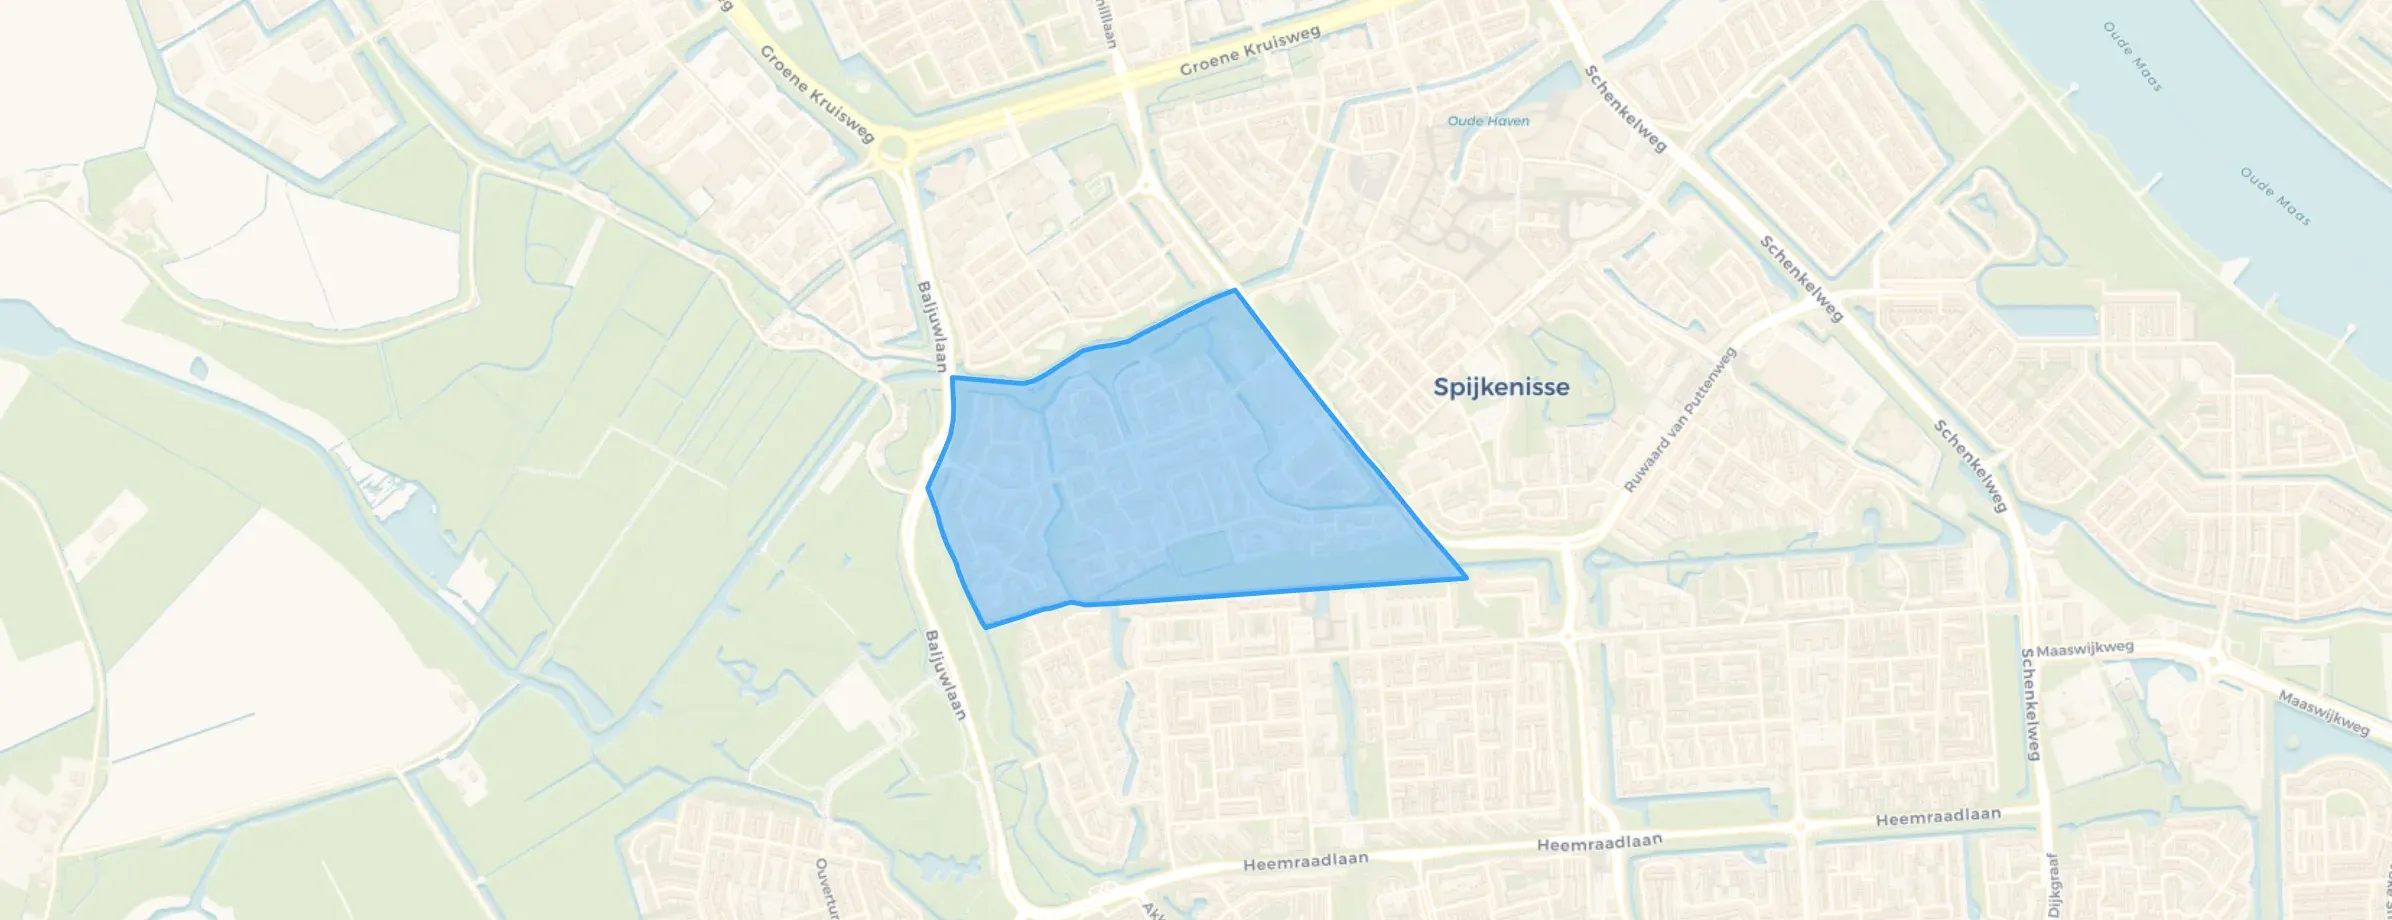
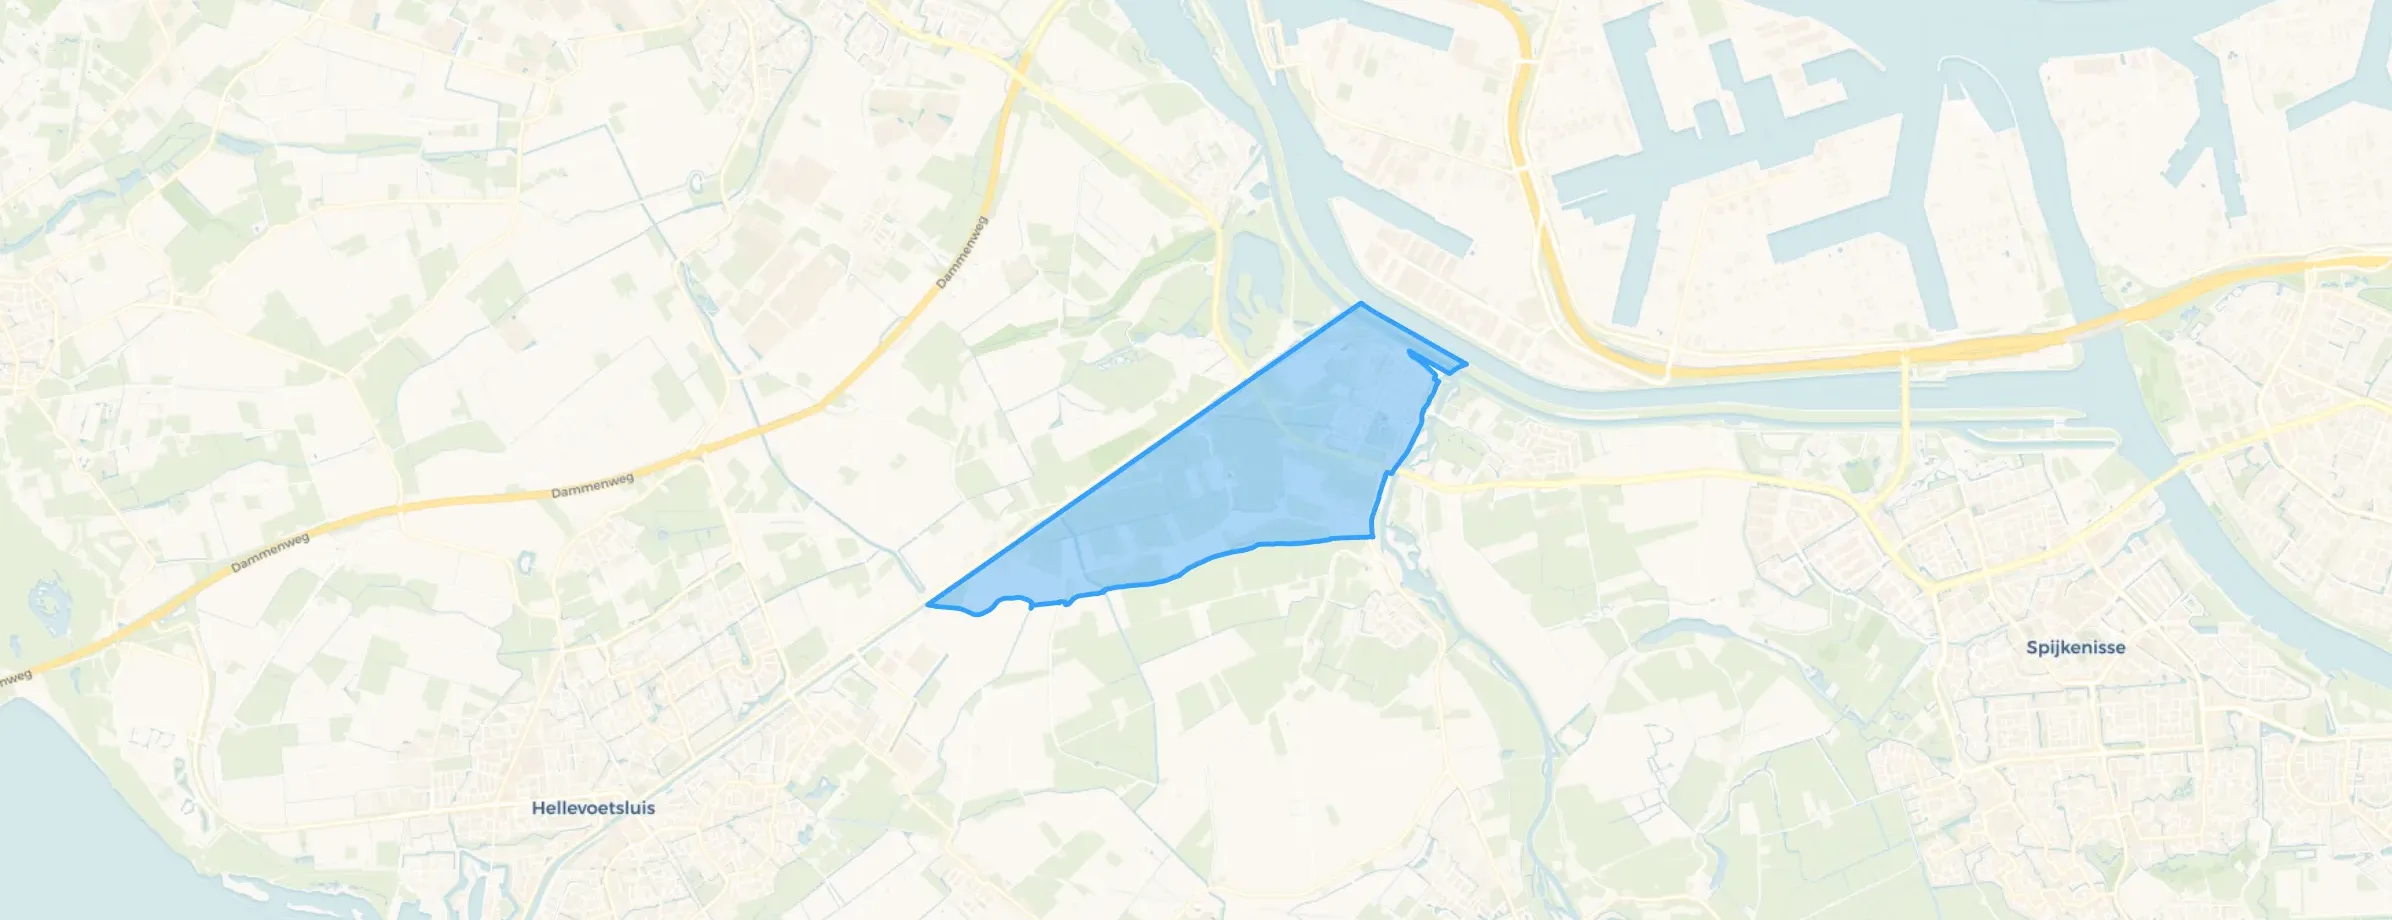
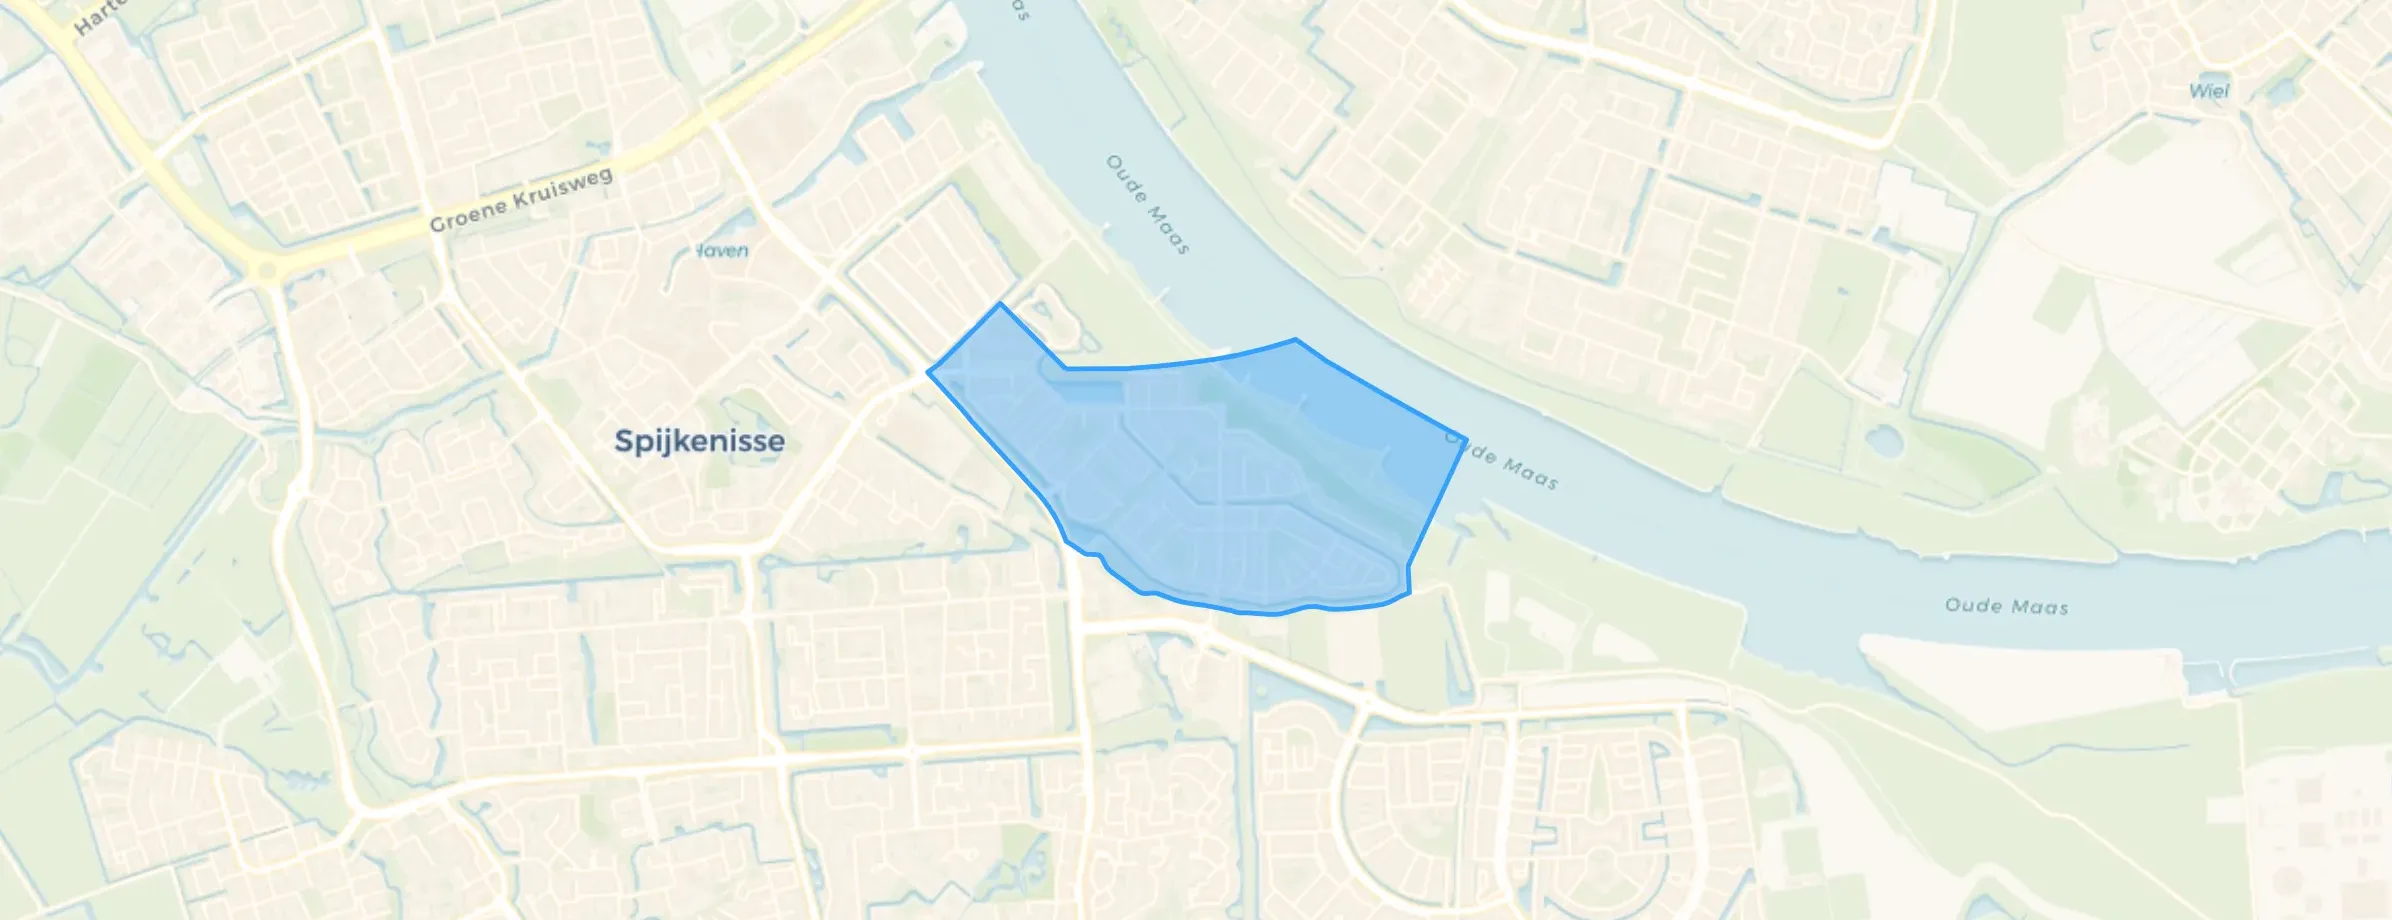
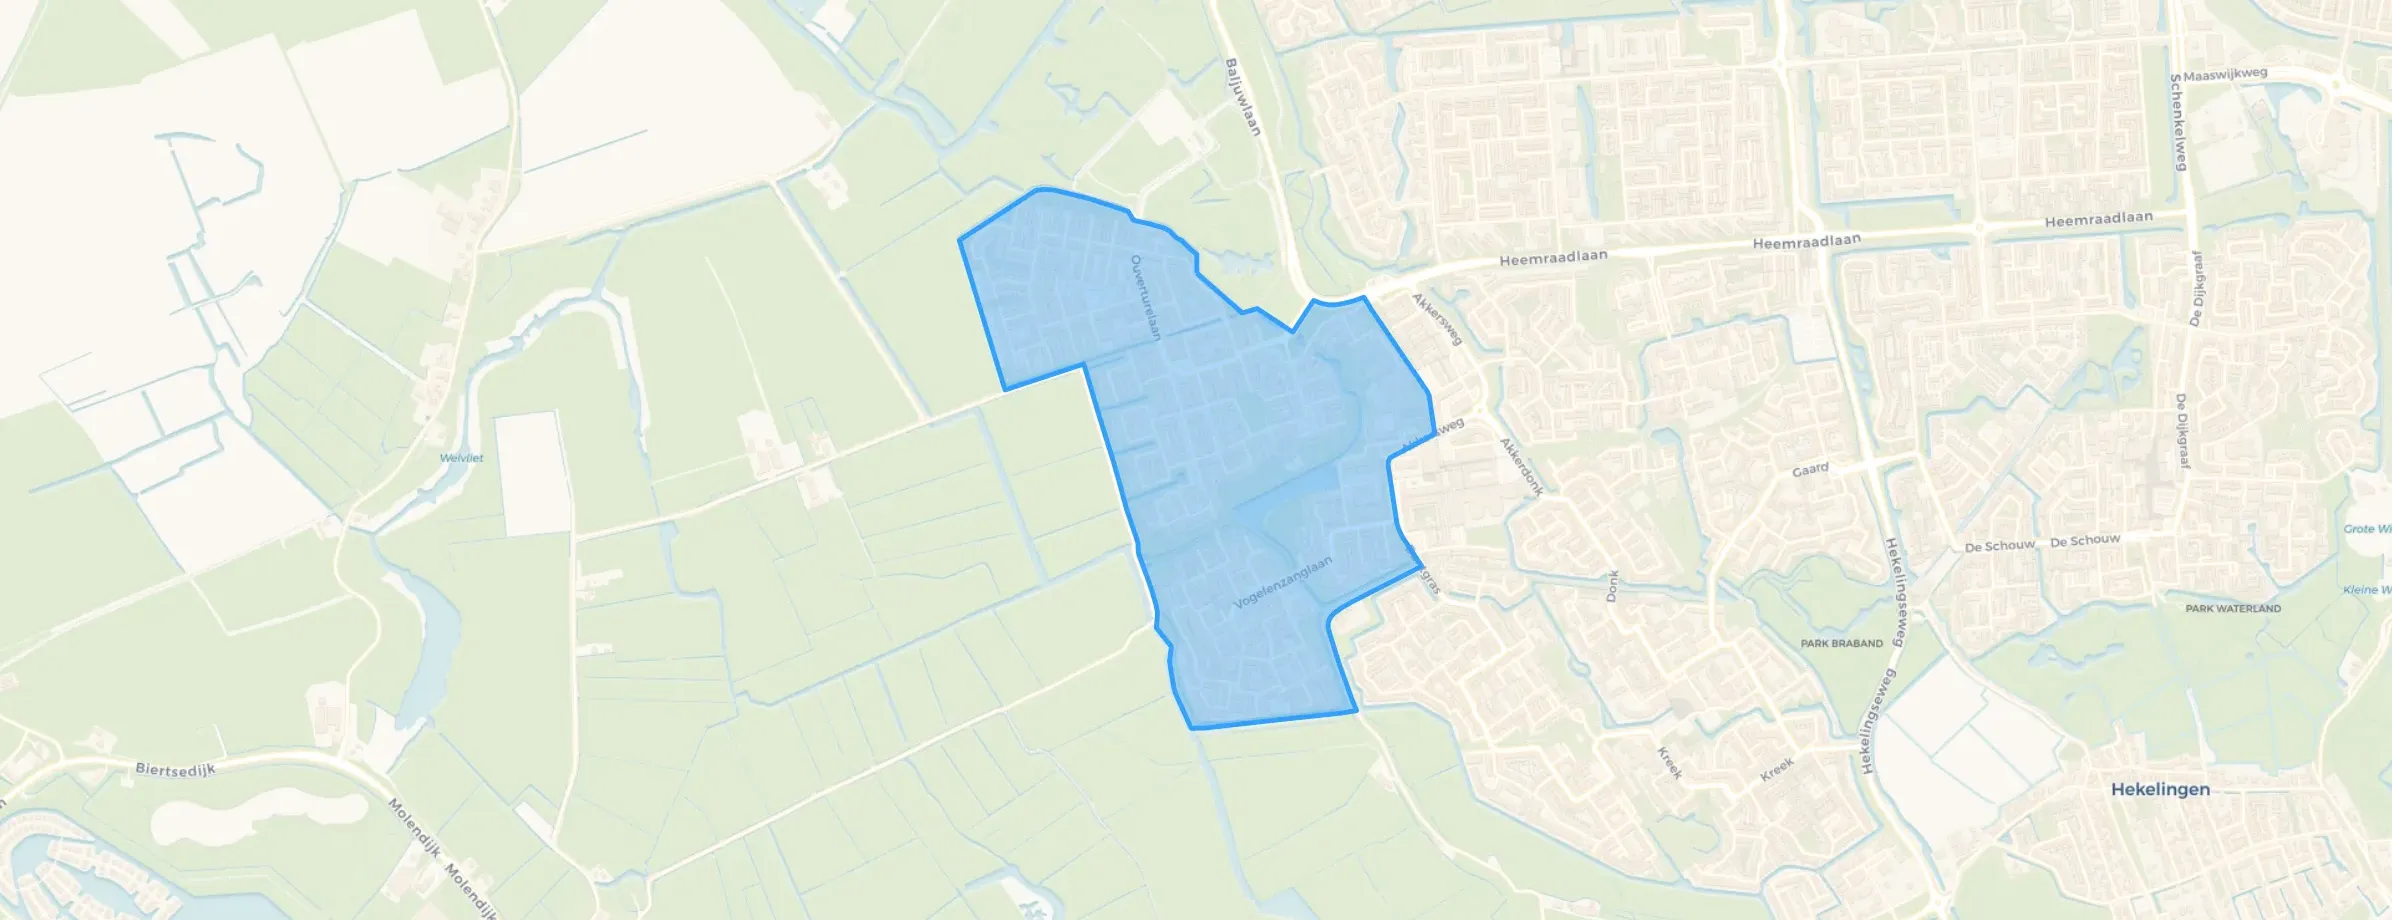

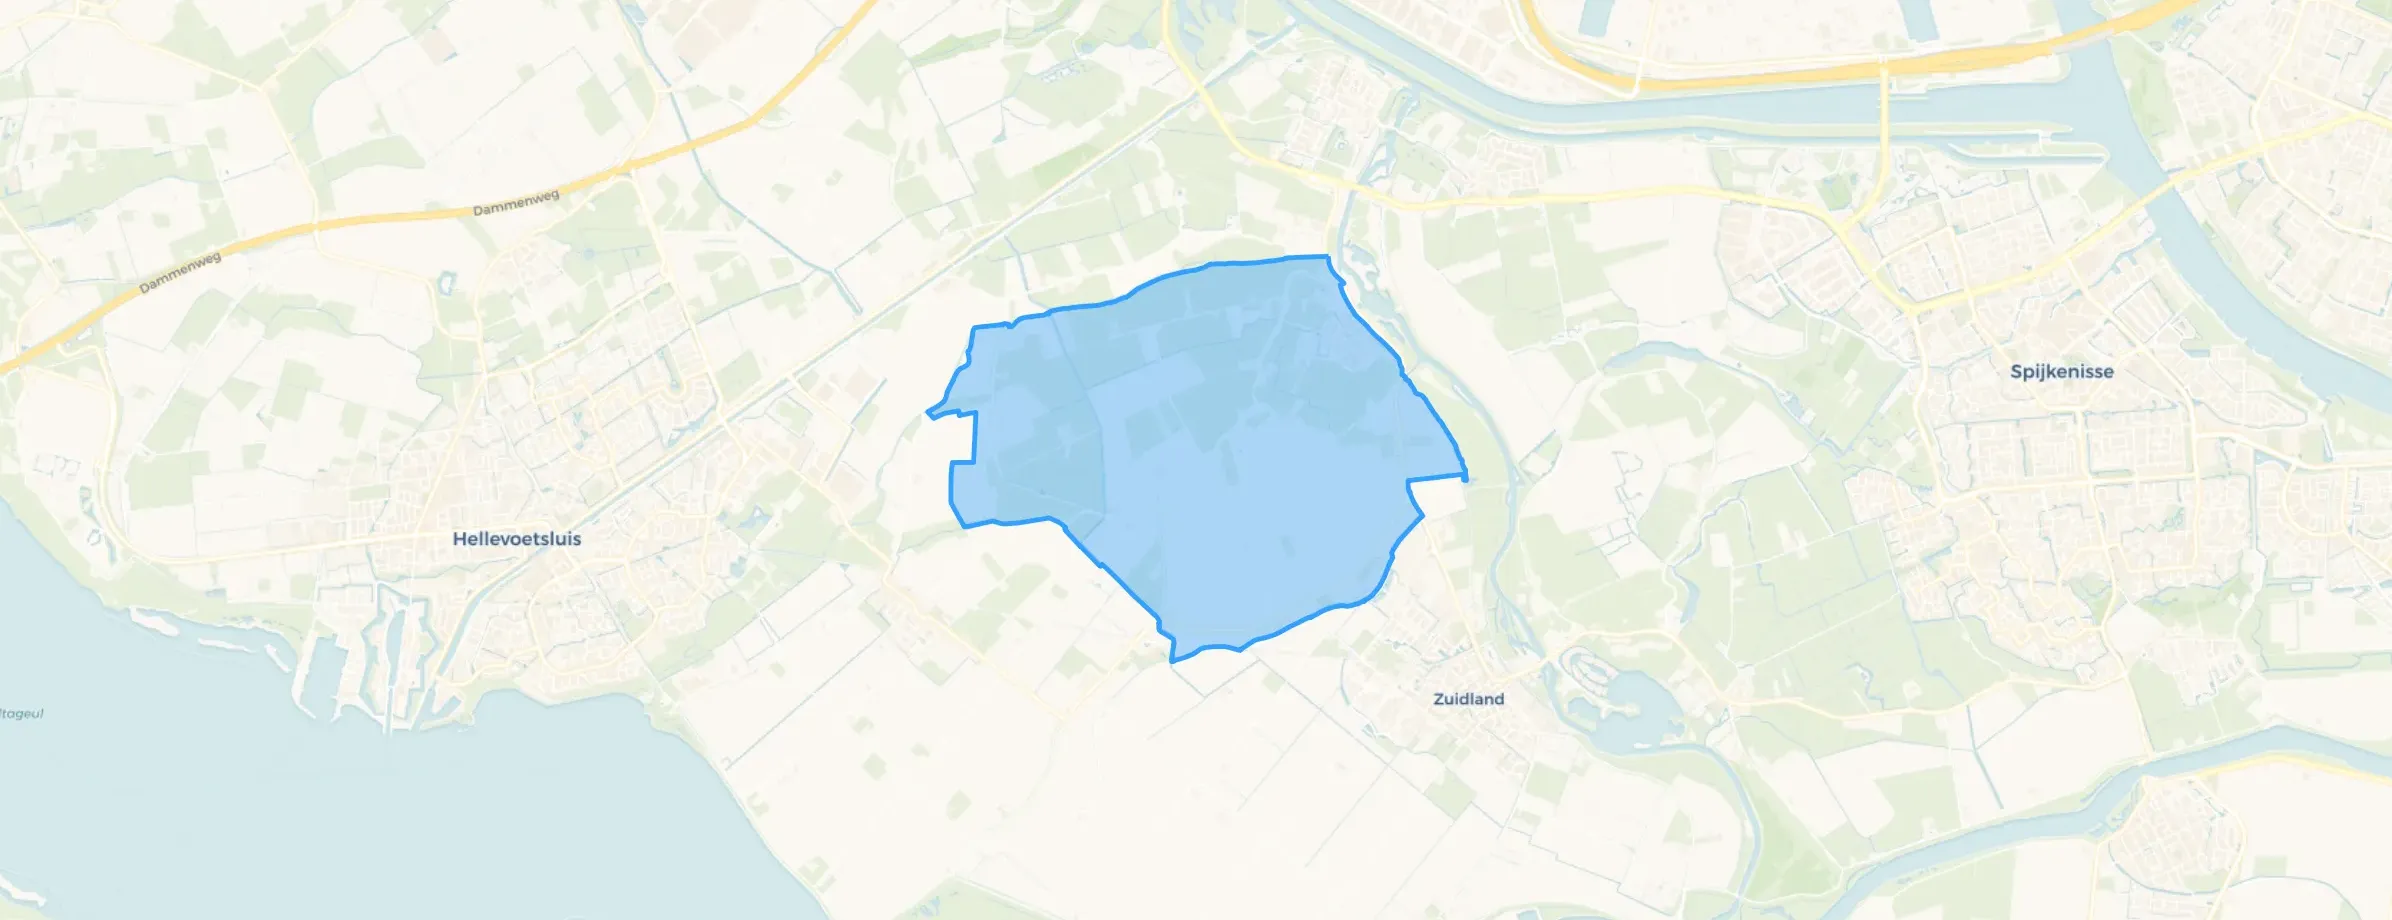
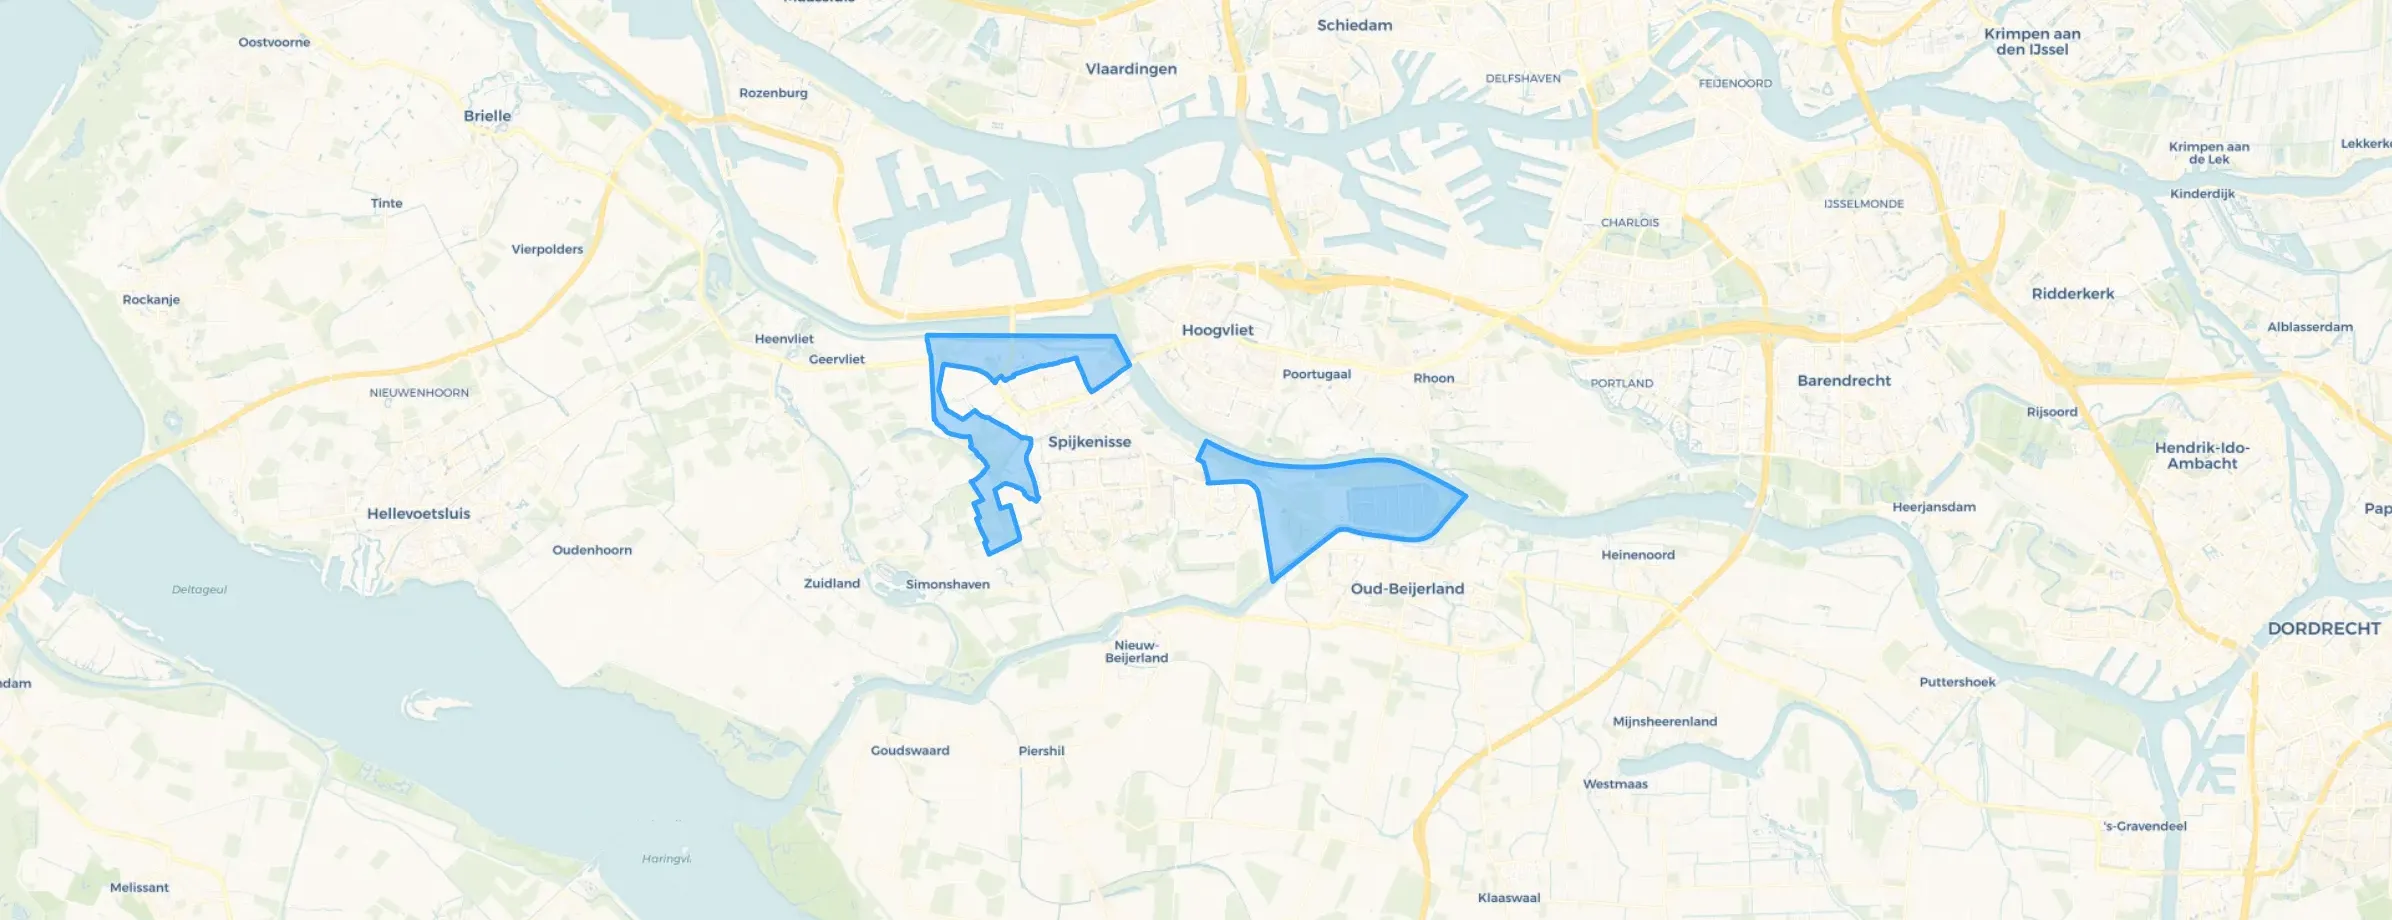
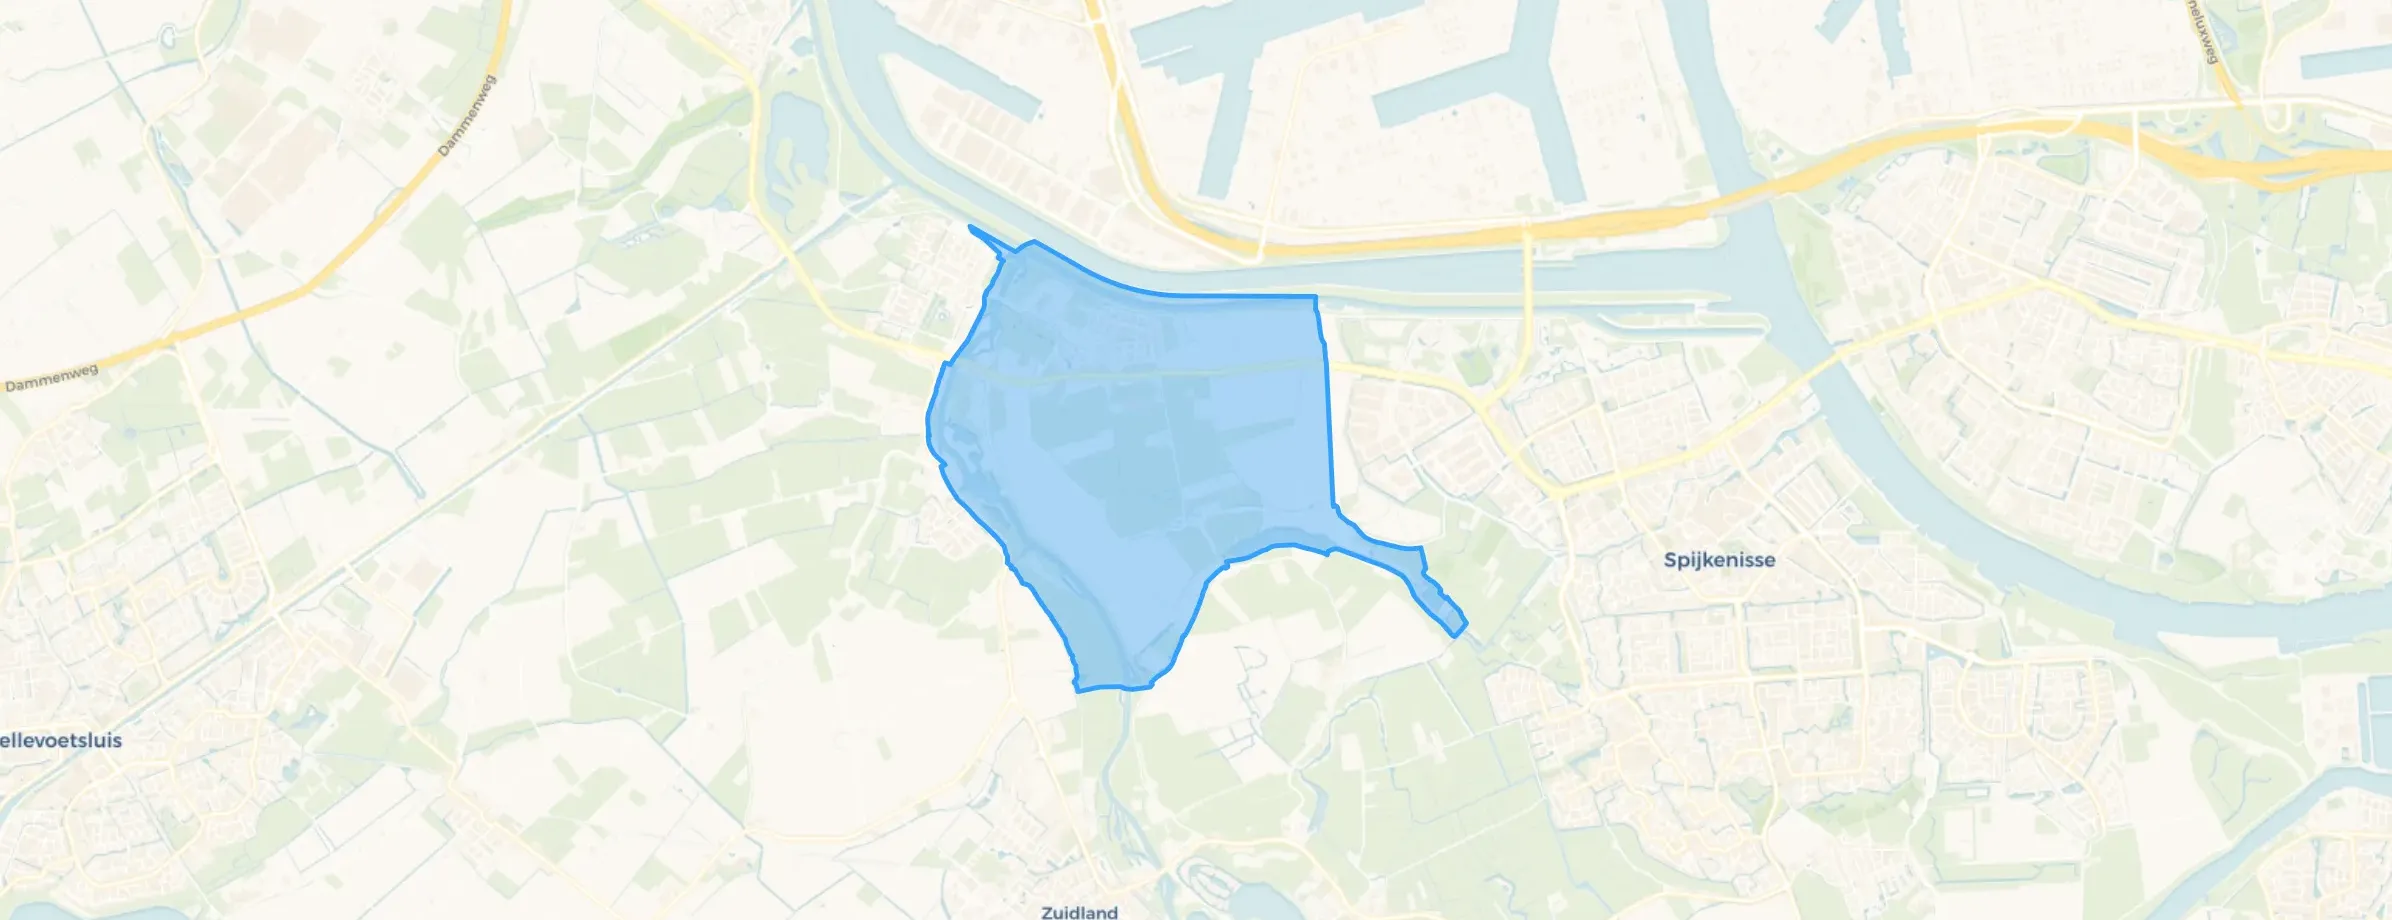
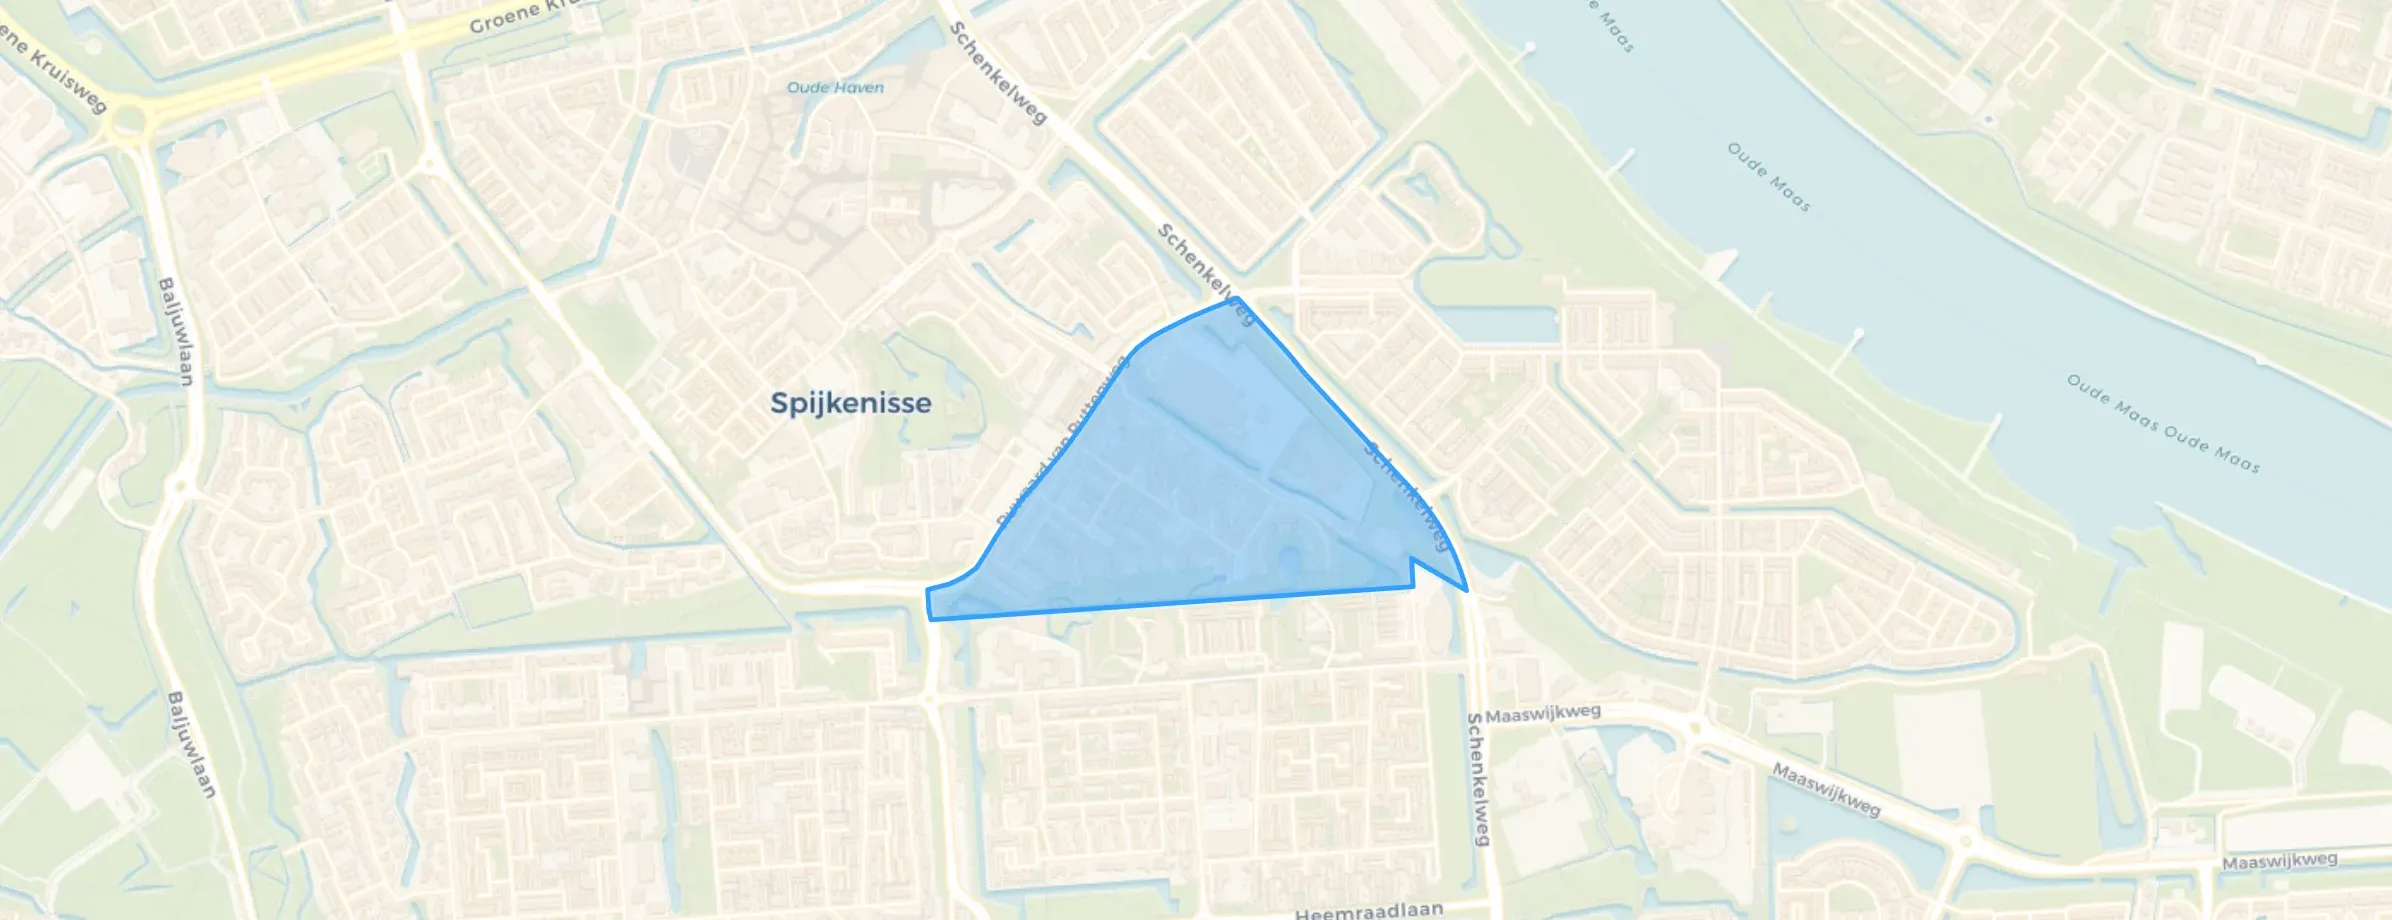
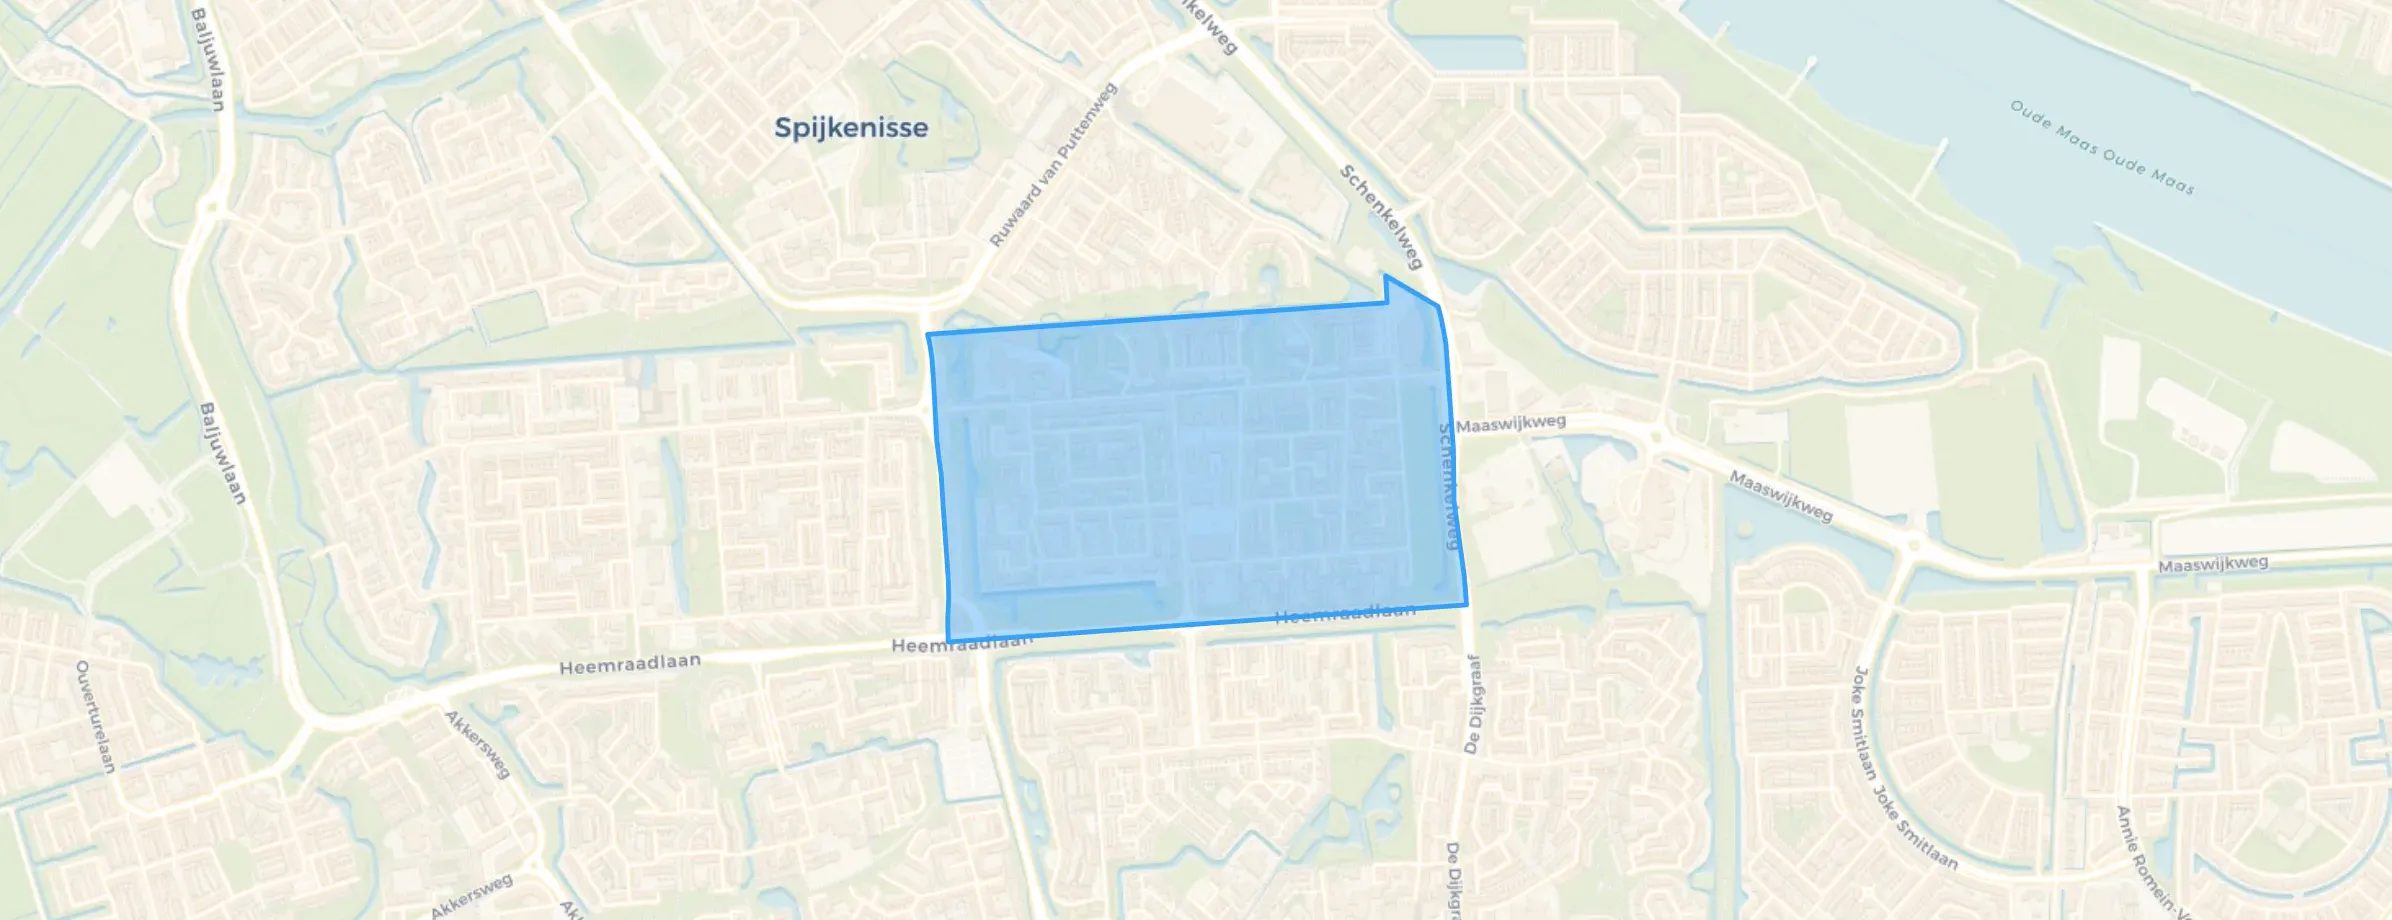
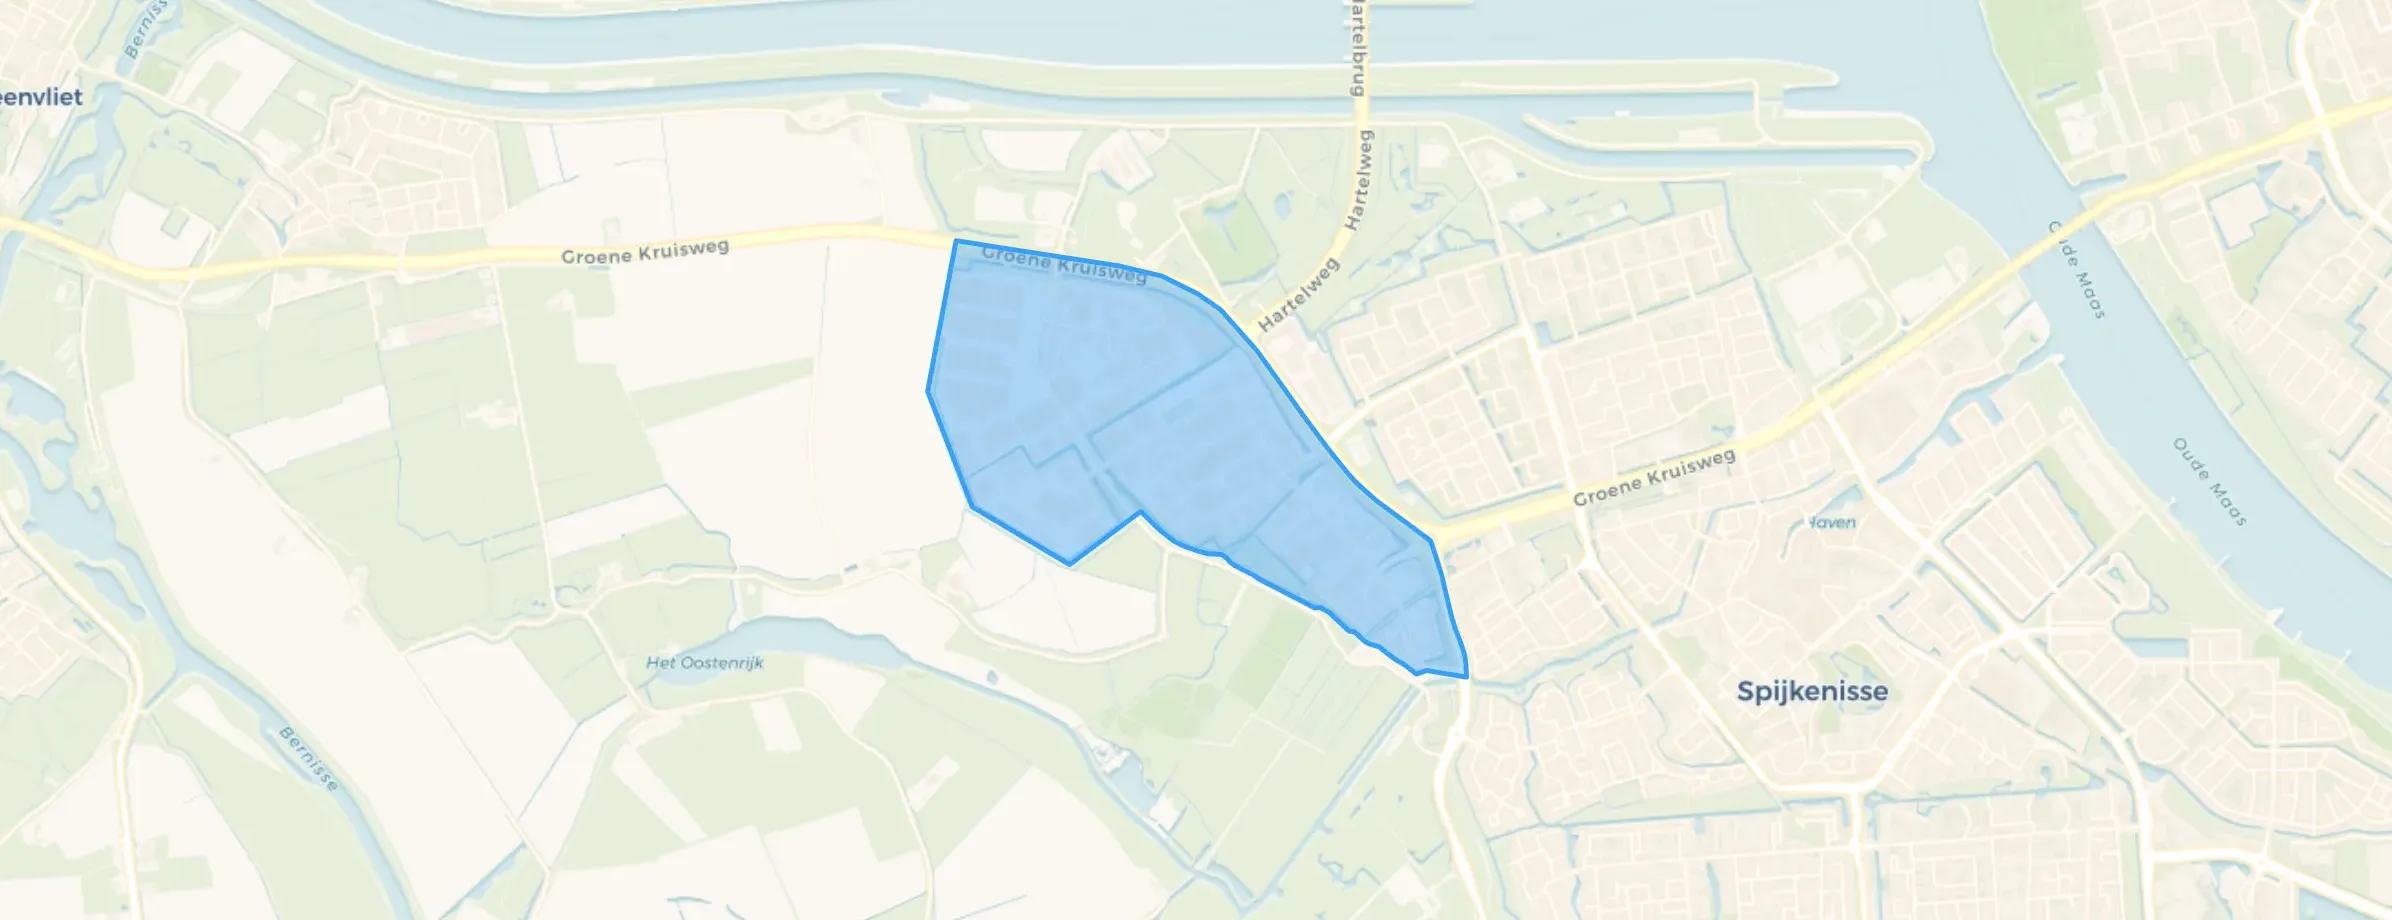
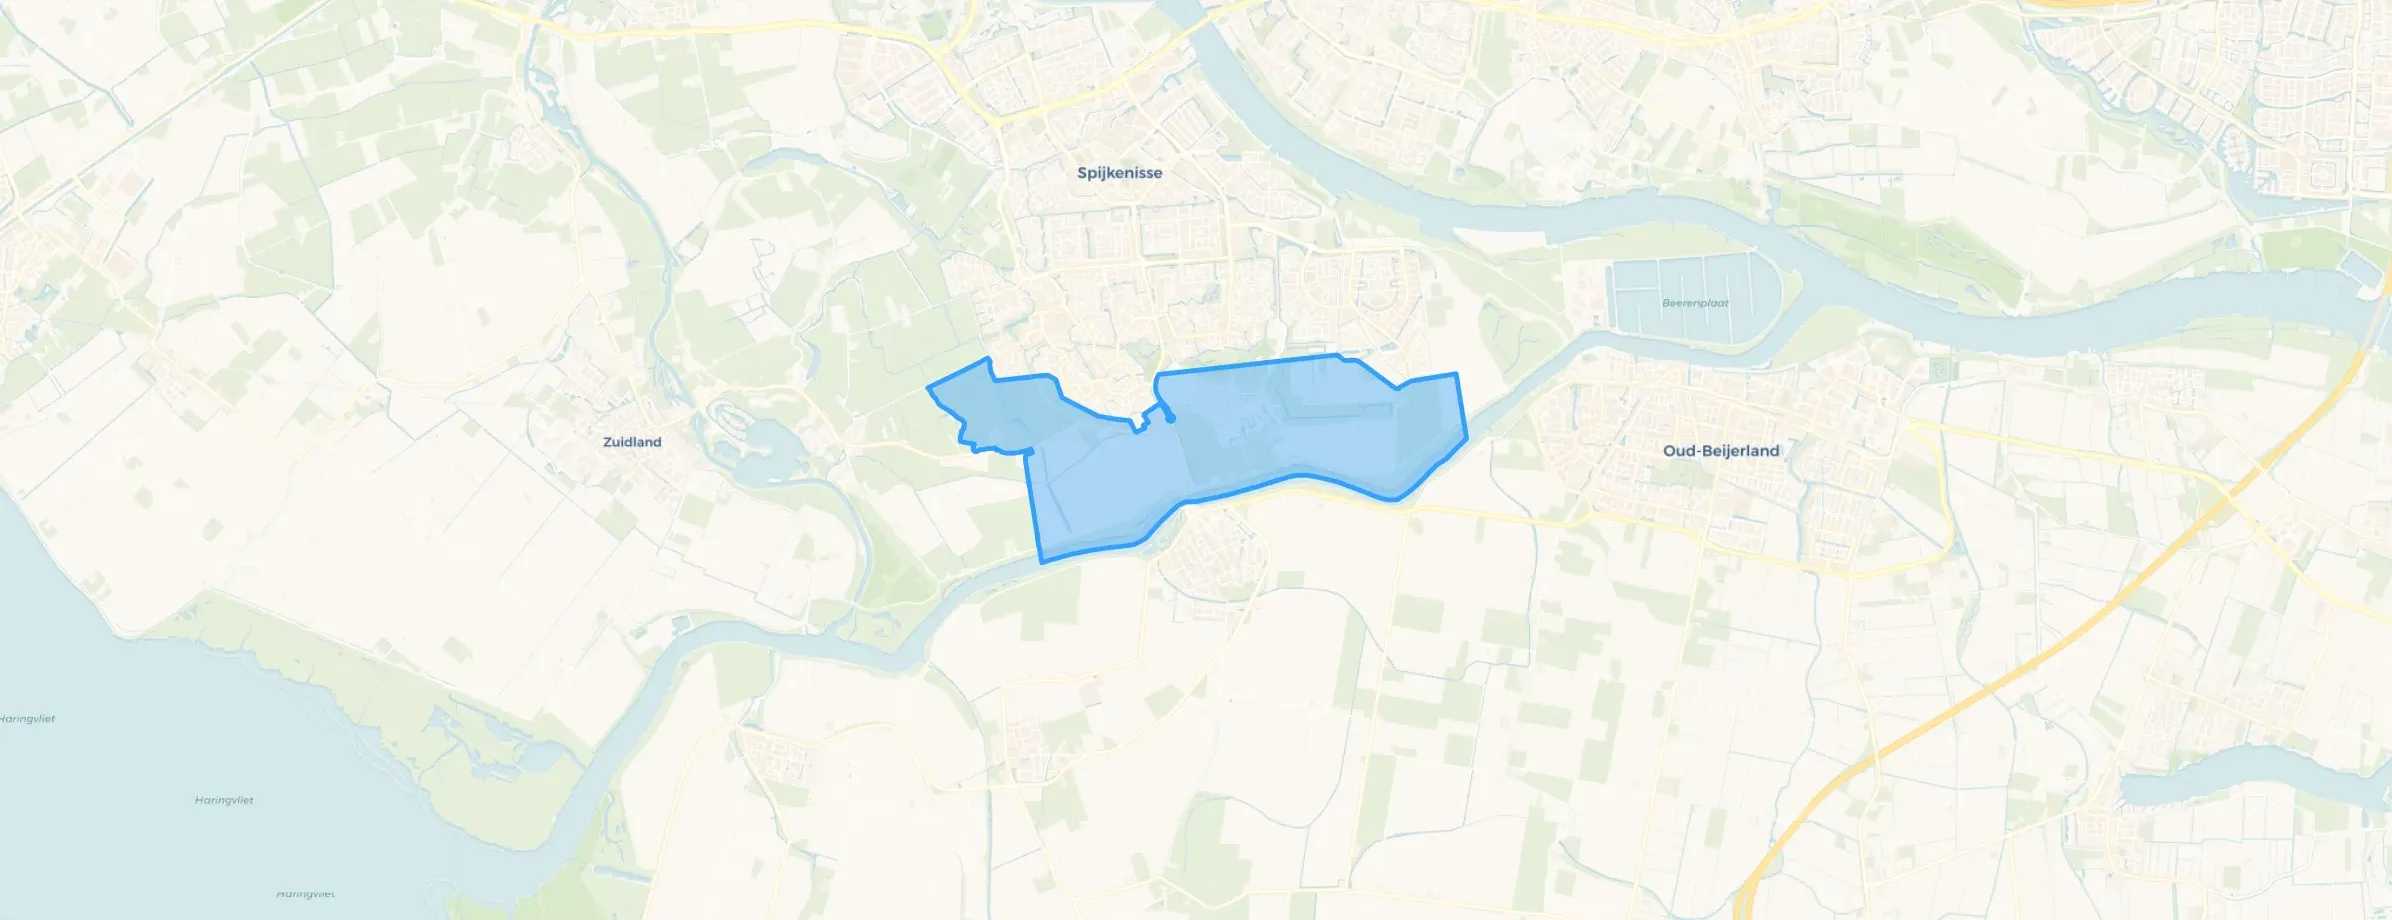

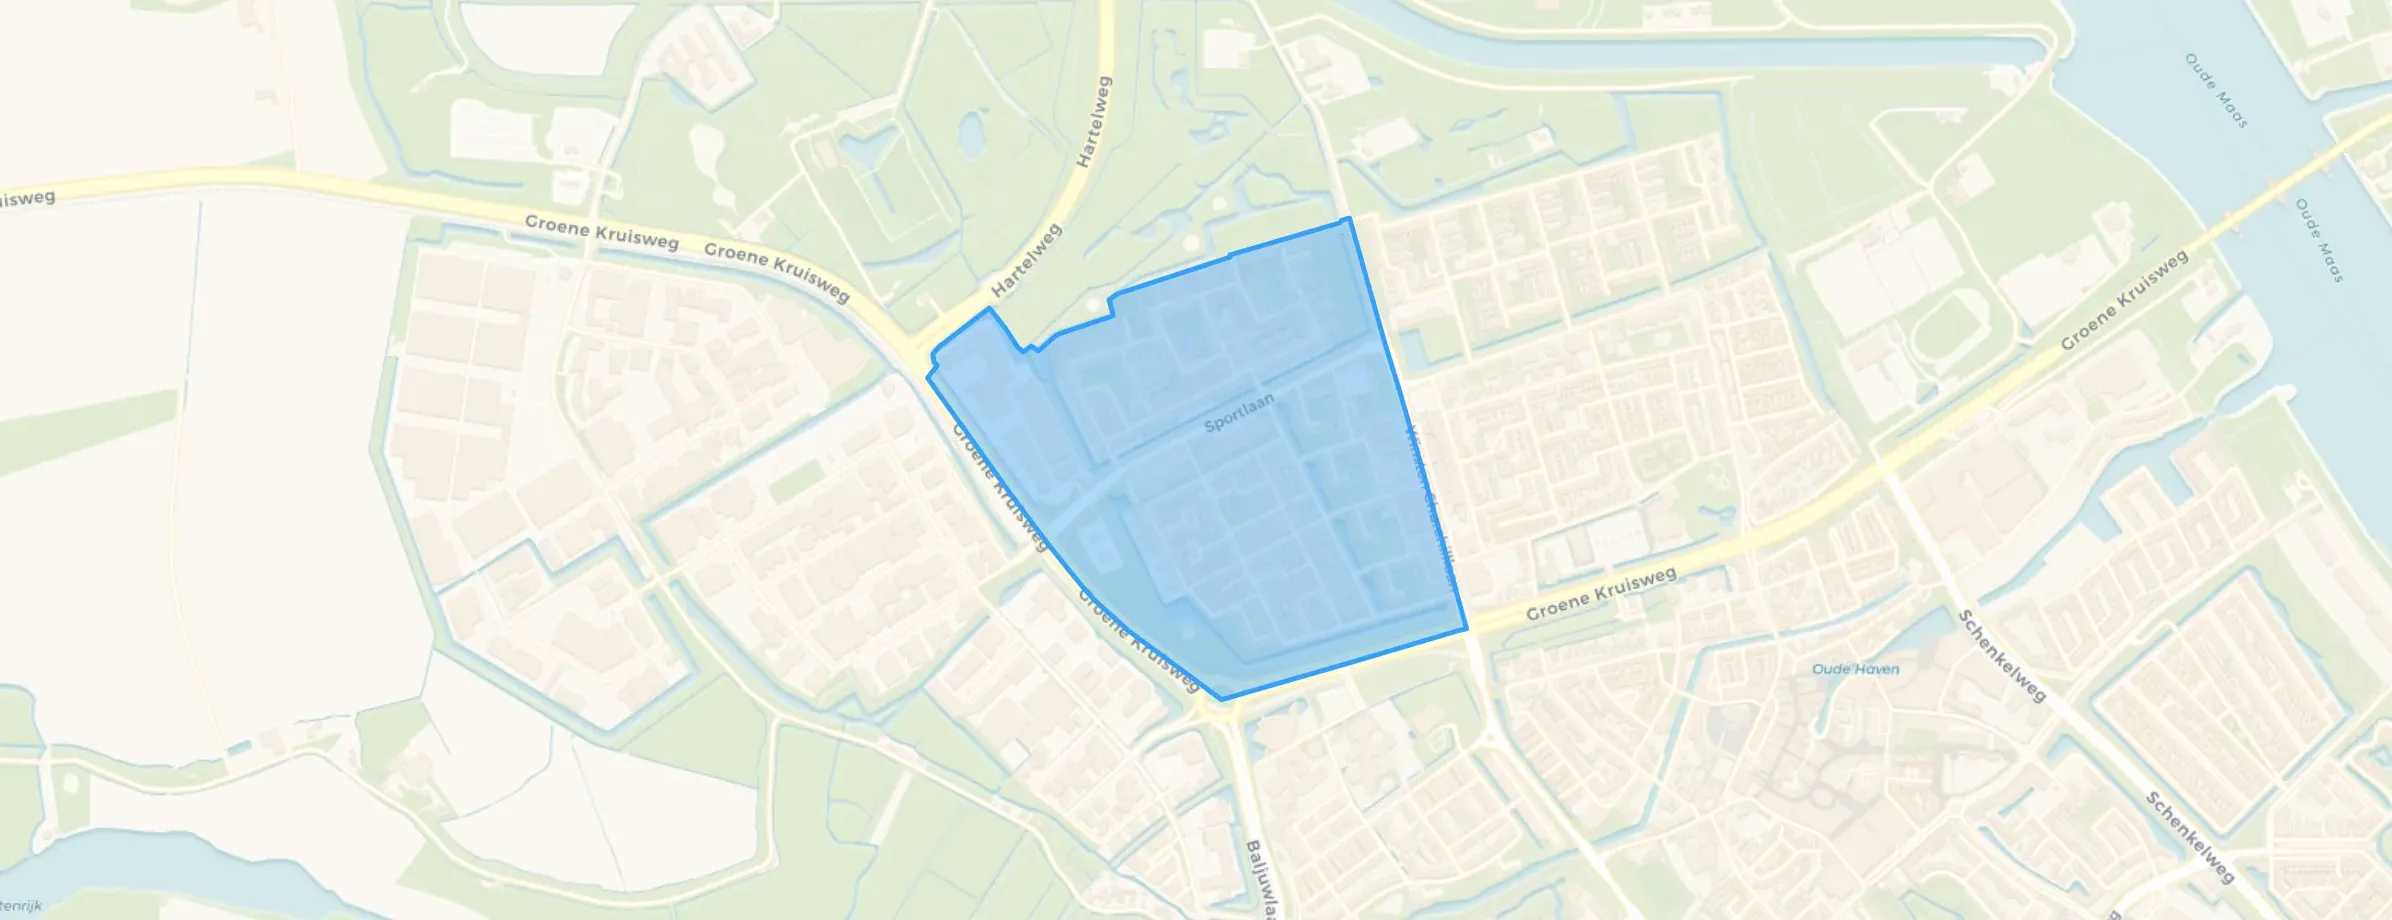
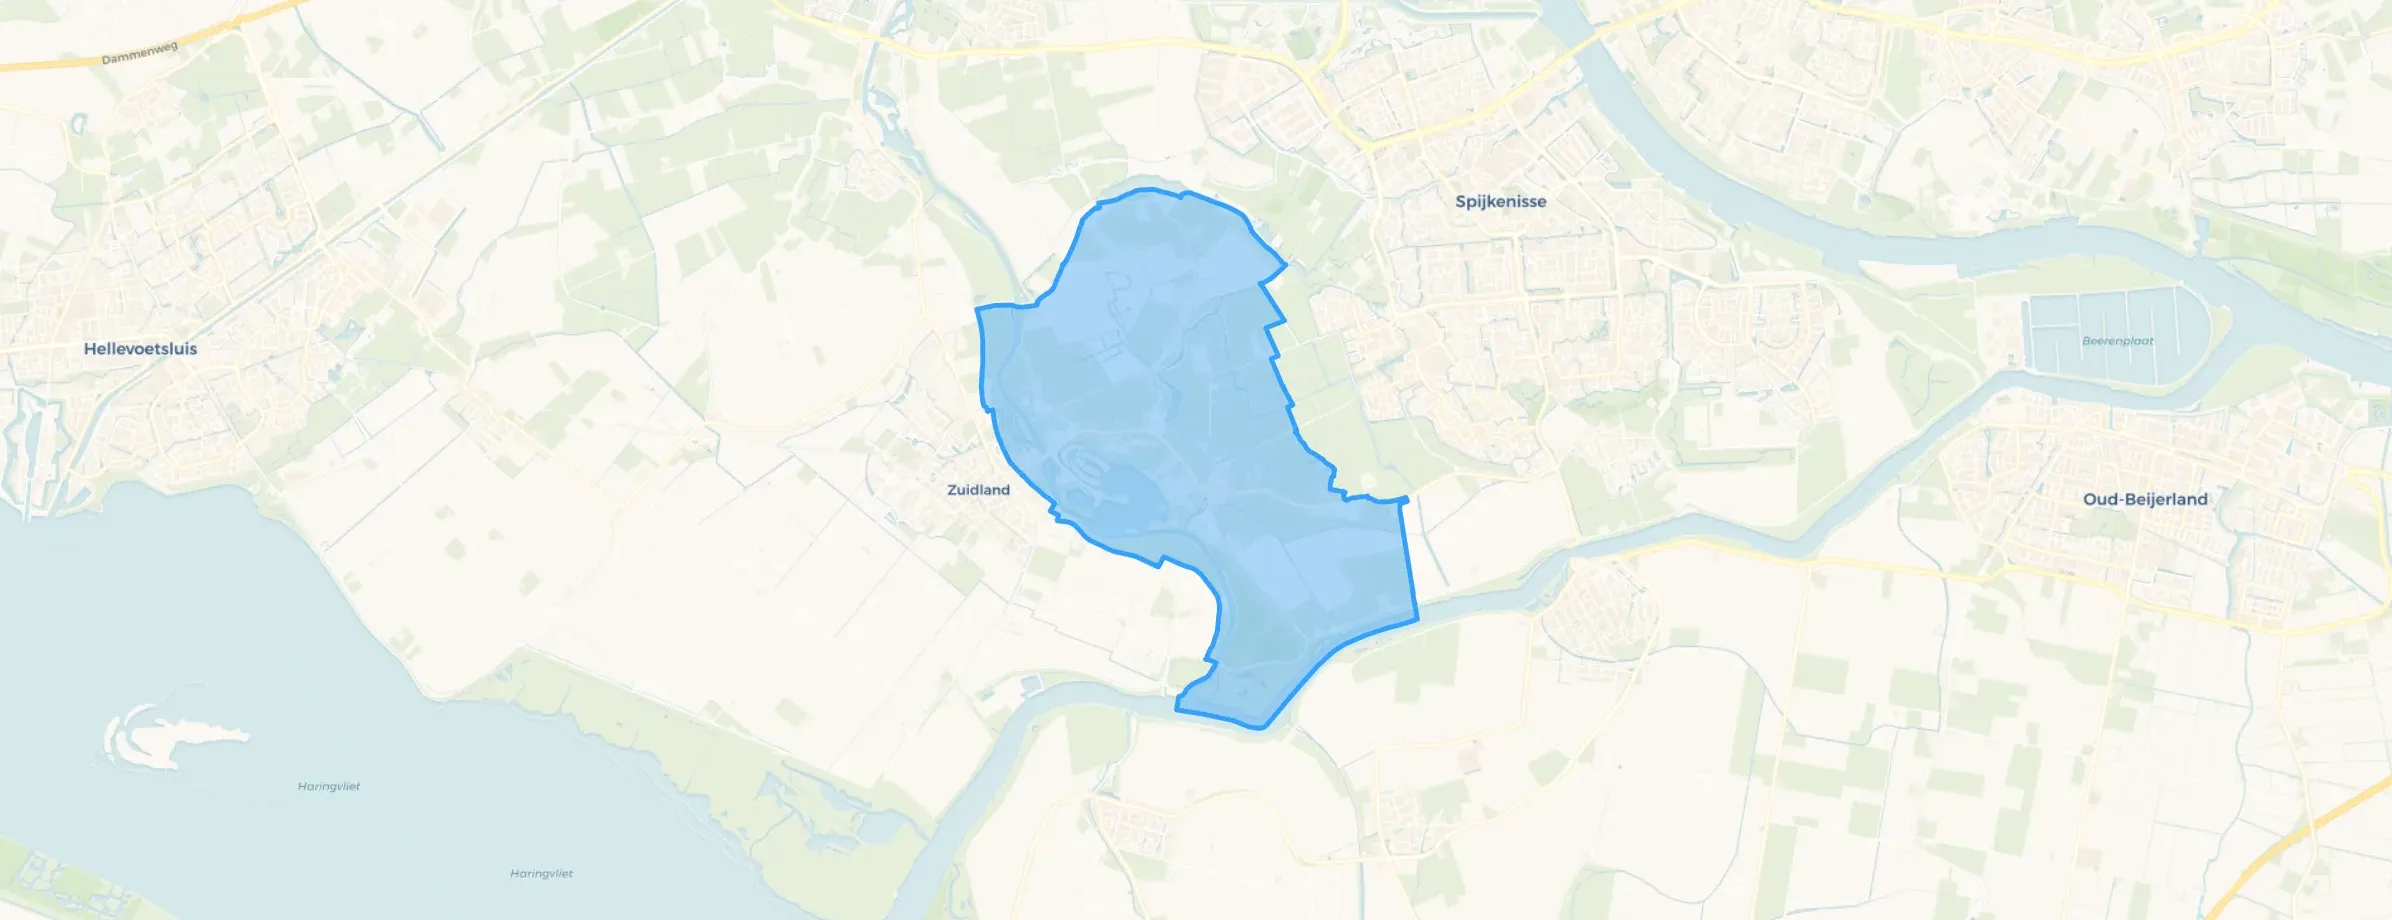

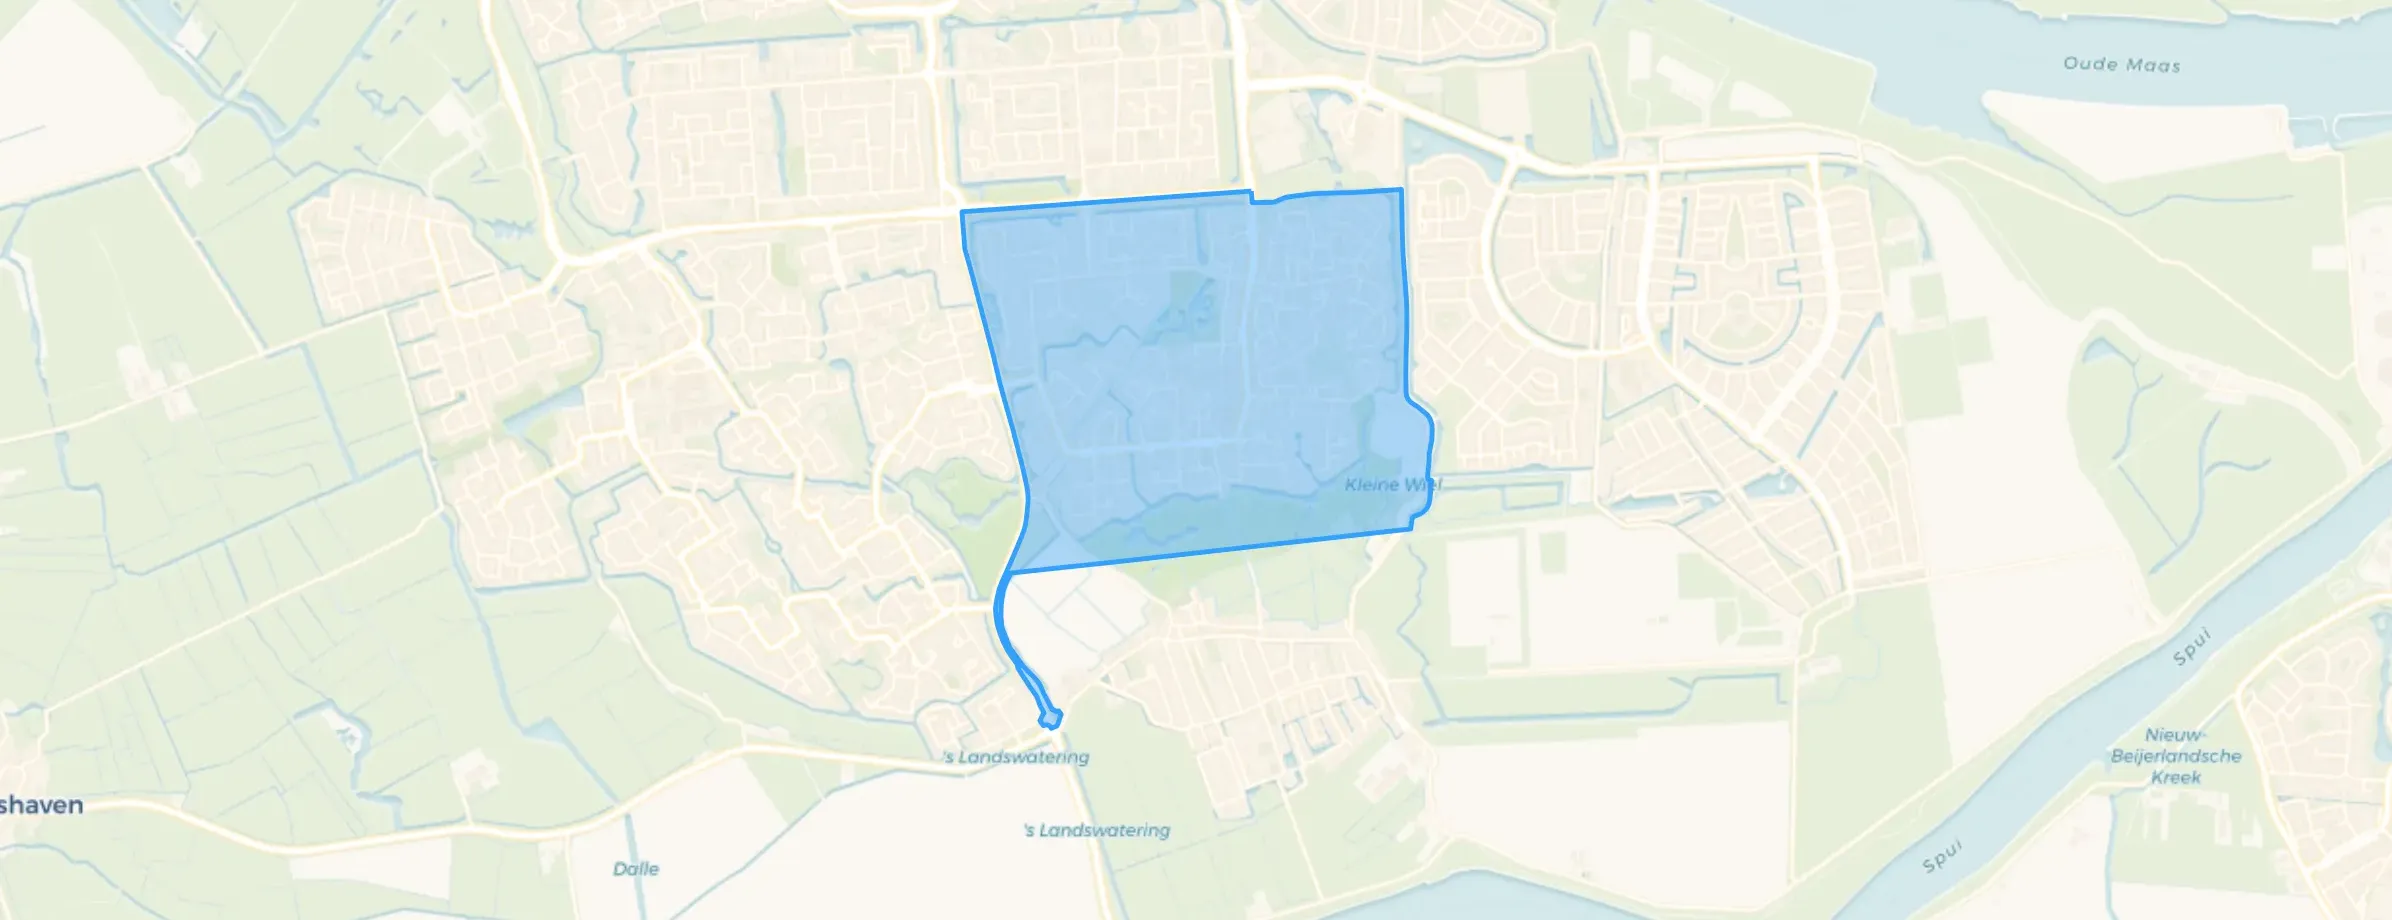
Nice residential area for families. All amenities present.
Auto-translated to English by AIPeople have tried to break in, attack me, and pelt me with chemicals… the police are fortunately quick to arrive every time, but that still doesn't make the neighbourhood safe. A neighbour's house burned down in August and several homes are already under anti-squat management. Many loitering youths all day long because of the petrol station on the street, and they leave a lot of litter lying around. The area is nicely green and close to the Old Meuse.
Auto-translated to English by AIGood fun
Auto-translated to English by AIVery good, plain and simple. I grew up here without any hassle.
Auto-translated to English by AIShops within walking distance. Reasonably green area. Get along well with my neighbours.
Auto-translated to English by AIit's a nice neighbourhood and all amenities are easily accessible
Auto-translated to English by AII recently started living on my own here in de Kerckhoek. For friends who want to visit without a driver's license, it's not always easy to get here. There are buses to and from Zuidland every half hour or every hour, but from the bus station it's a 15-minute walk to reach de Kerckhoek.
Auto-translated to English by AII've lived here for 11 years. Everyone is kind to me. I am disabled myself but everyone is nice to me and helps where needed. We know almost everyone and are good friends with each other. Safety is quite good, not much happens and the kids are safe on the street. Also in terms of hygiene, I don't have much to complain about, maybe some young people making a mess but that is cleaned up well by the municipality. The housing is fine. The education is good. Lots of nature within a short walking distance. The facilities are good and the accessibility is great.
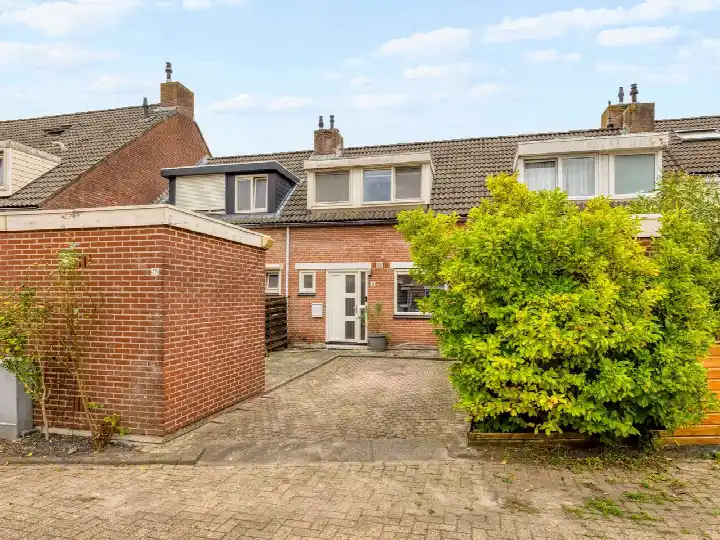
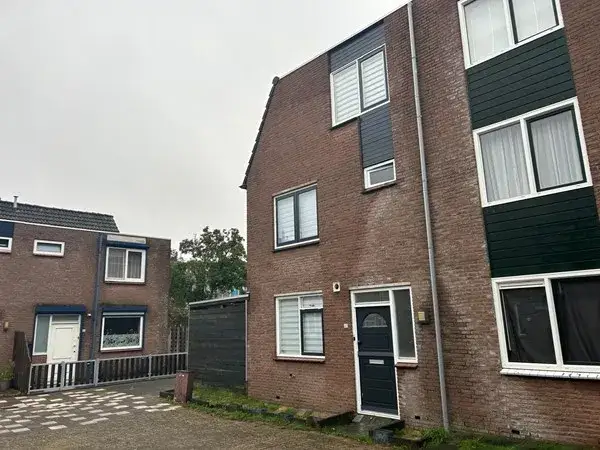
Auto-translated to English by AIThe housing stock is mainly post-war — 66% was built between 1945 and 1990. In addition, the most common type is terraced houses (41%).
Over the past year a home for sale in Nissewaard was listed for an average of €413,997 (€3,920 per m²). That is 21% below the Dutch national average. Last quarter prices rose by 17%.
A rental home in Nissewaard cost an average of €1,997 per month (€21 per m²).
Residents give Nissewaard a 7.4 out of 10 based on 17 reviews. Nature and greenery stands out with a 7.8; community lags behind with a 6.9.
Gemeente Nissewaard has 88,341 residents. Many families: 36% of the households have children.
The housing supply in Nissewaard is remarkably efficient: 60% has an A, A+ or B label. The average natural gas consumption per household is 720 m³ per year.
From Nissewaard you can on average reach a supermarket at 0.9 km, a GP at 0.8 km, a railway station at 17.7 km, a primary school at 0.7 km (as the crow flies, source: CBS).
Right now you will find 464 homes for sale and 18 homes for rent in Nissewaard.