Municipality in Zuid-Holland
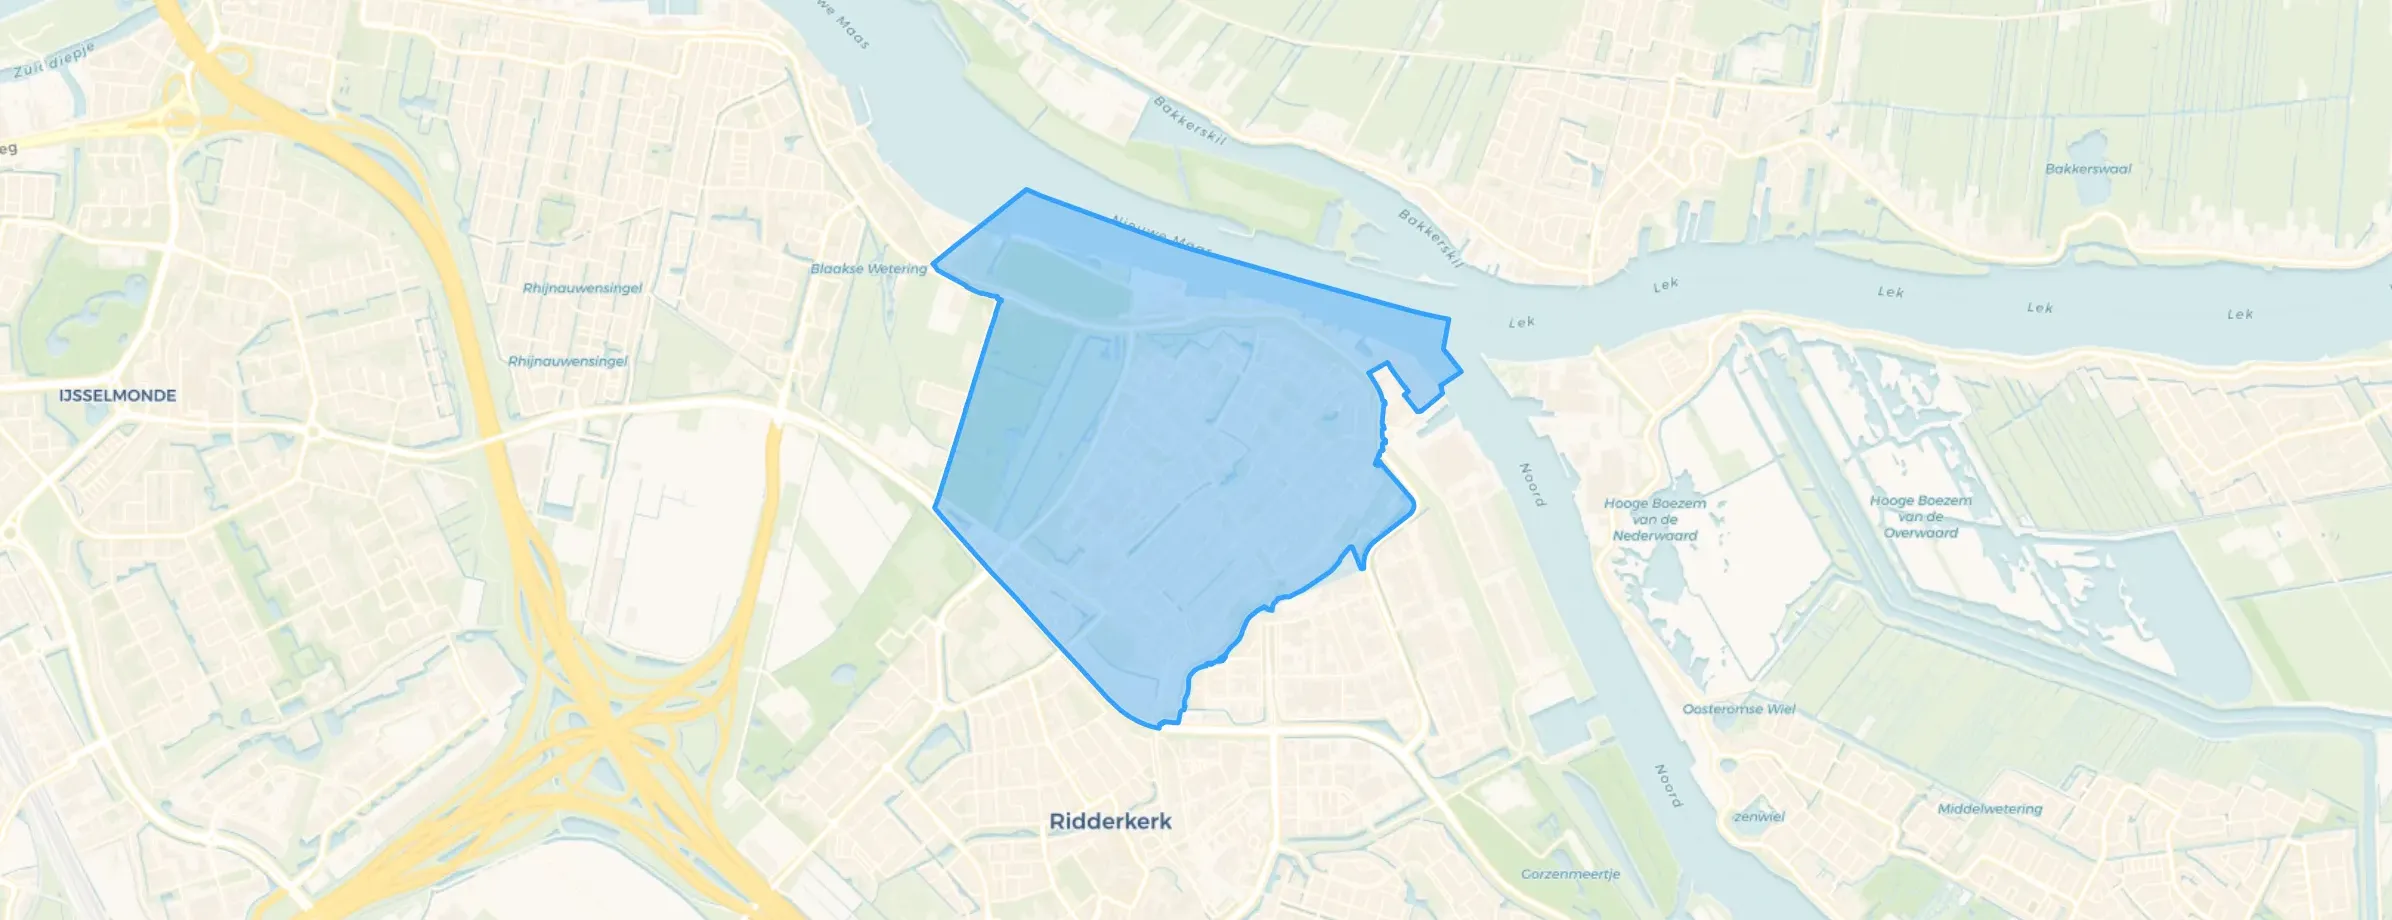
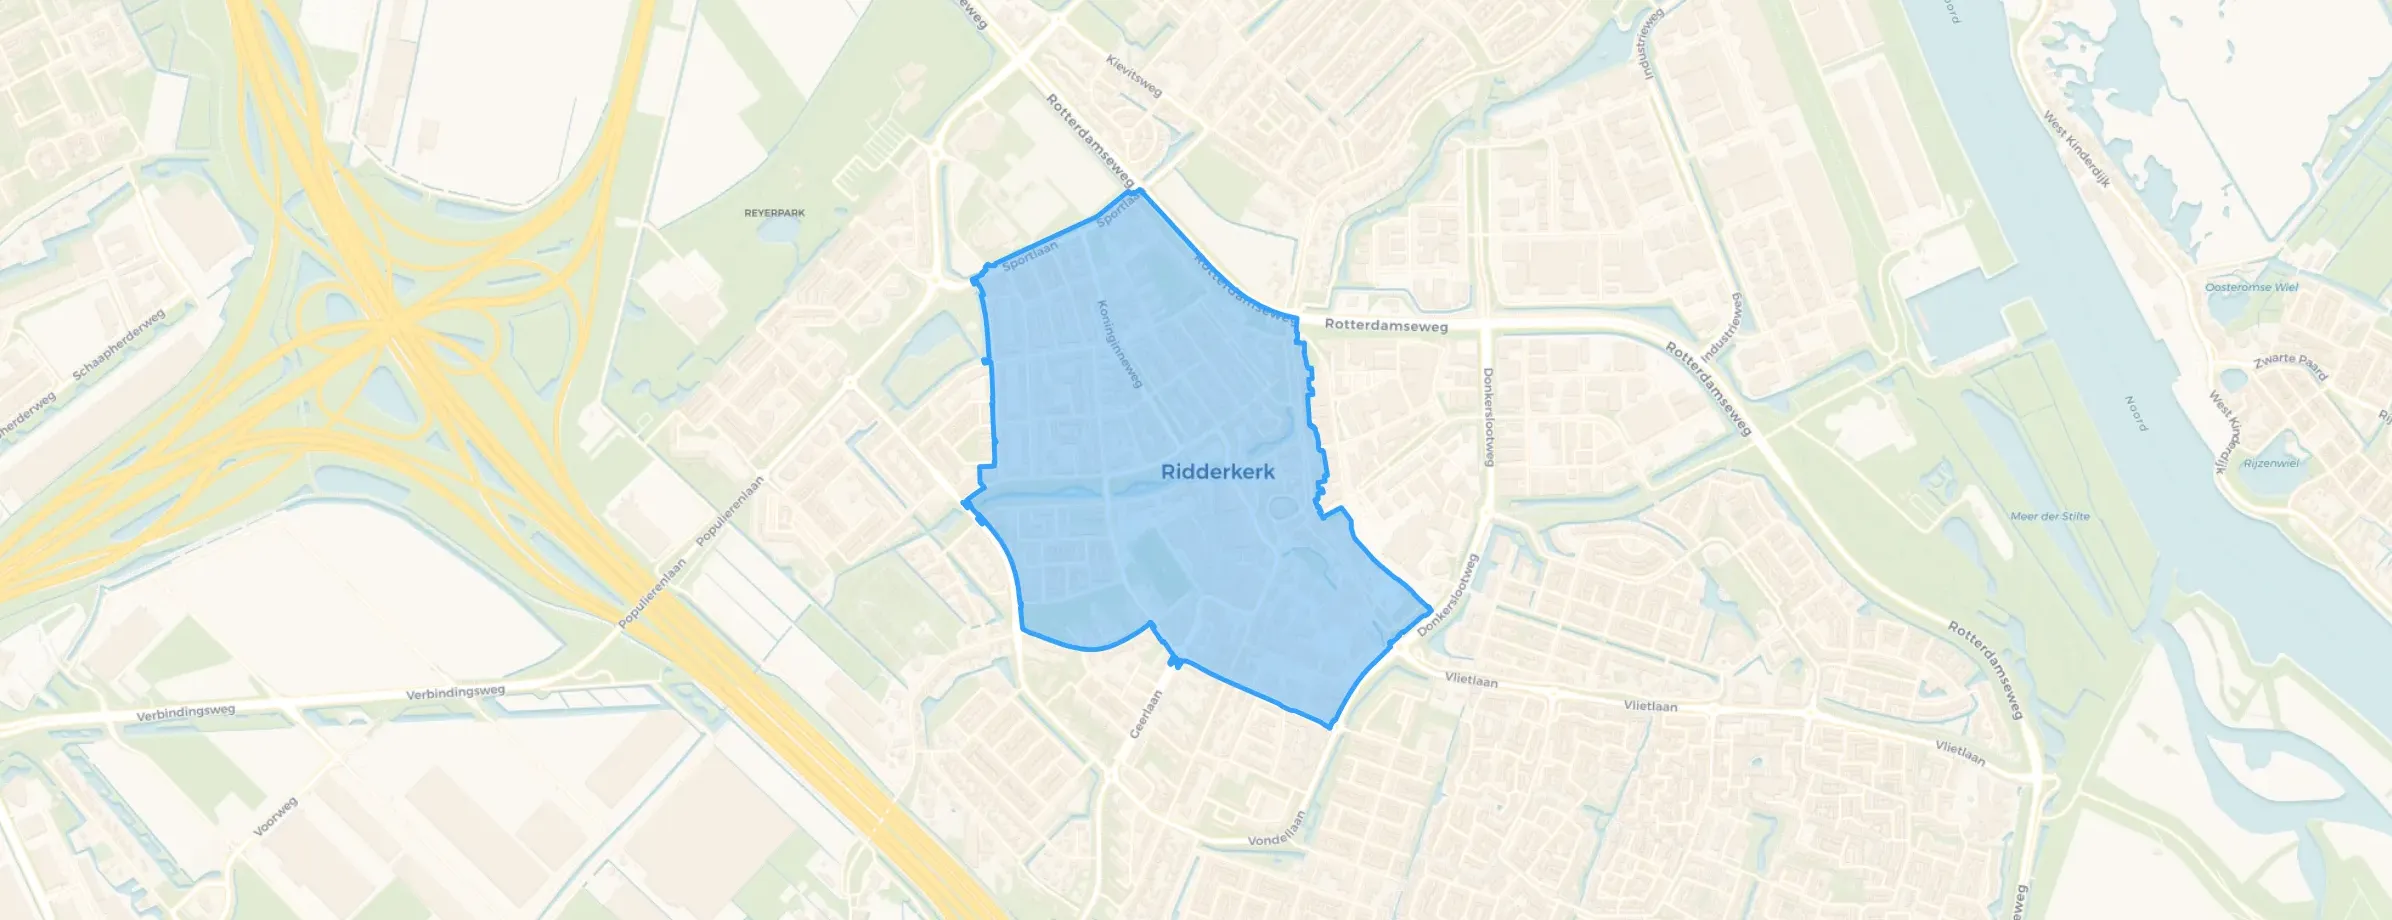
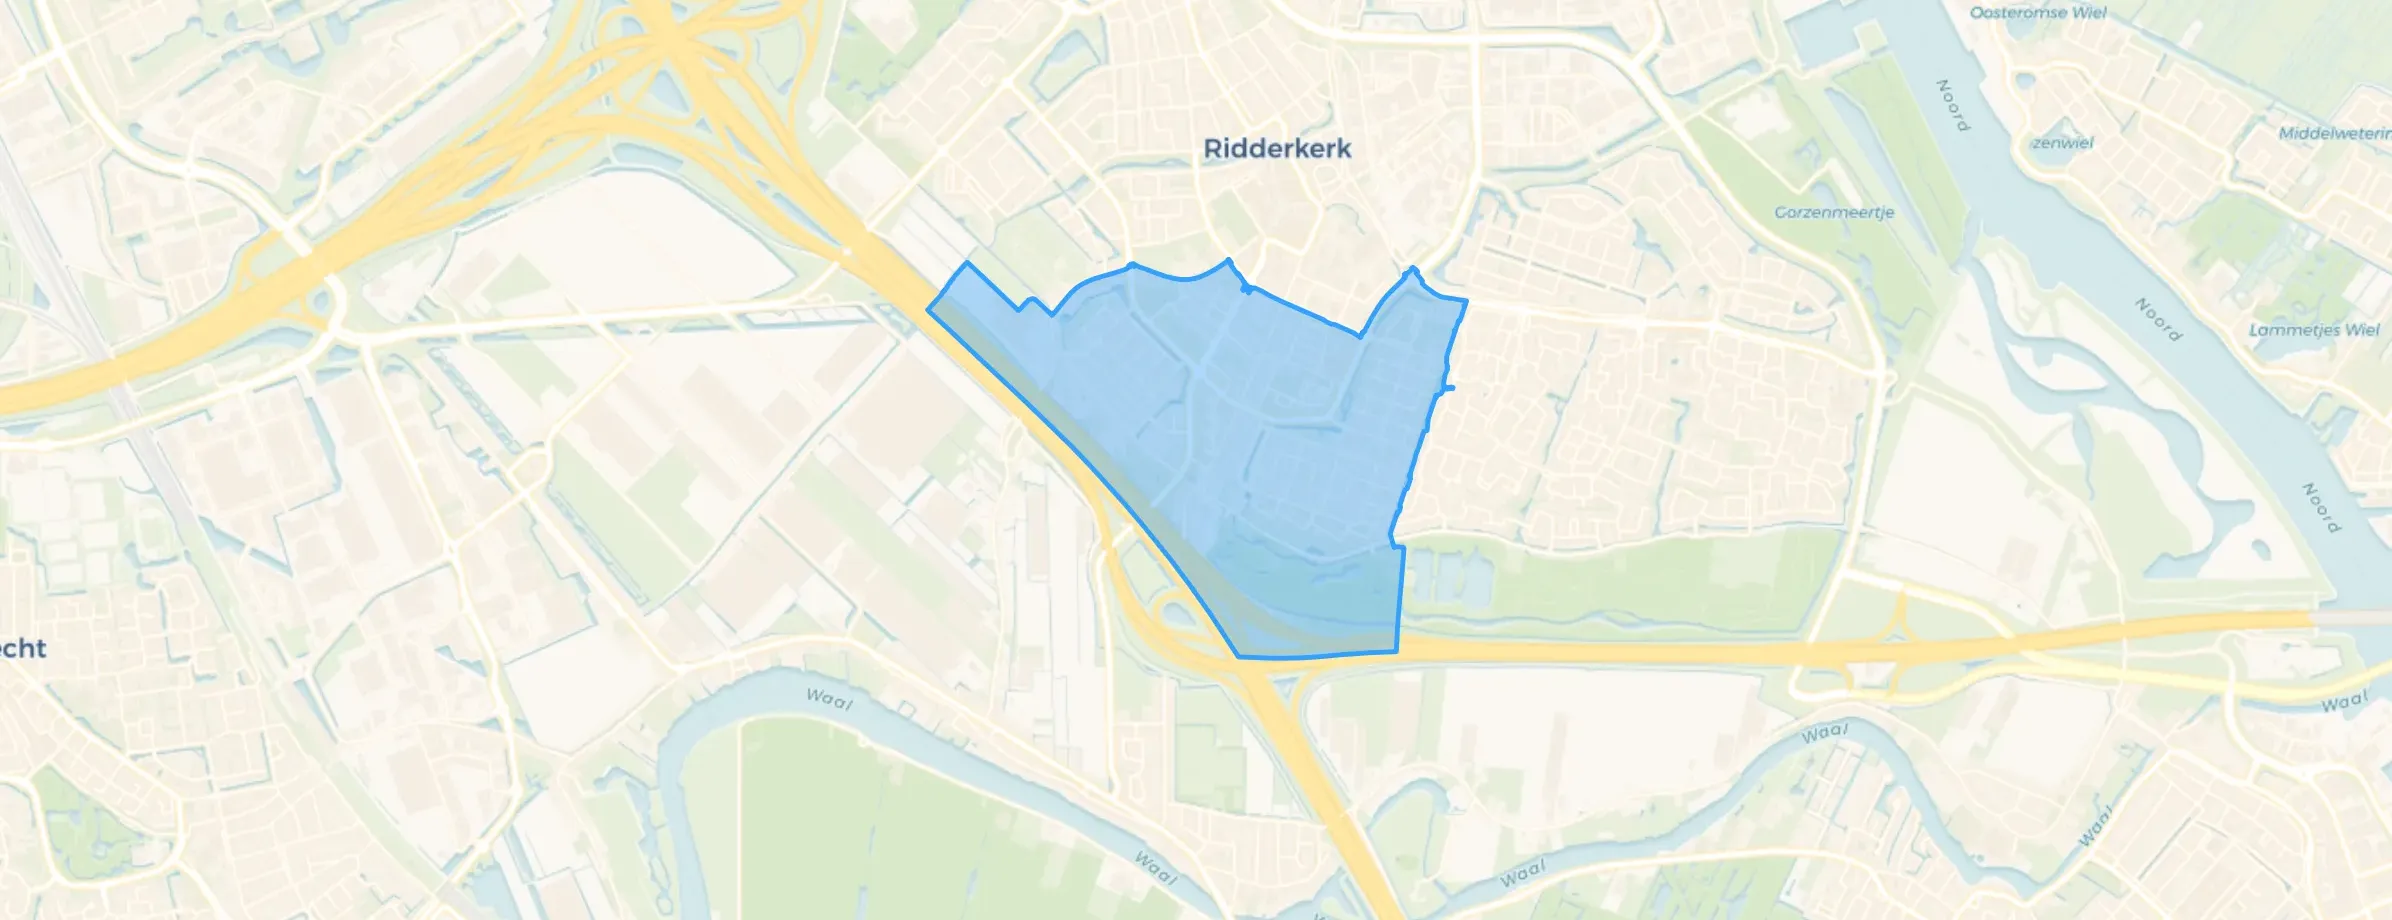
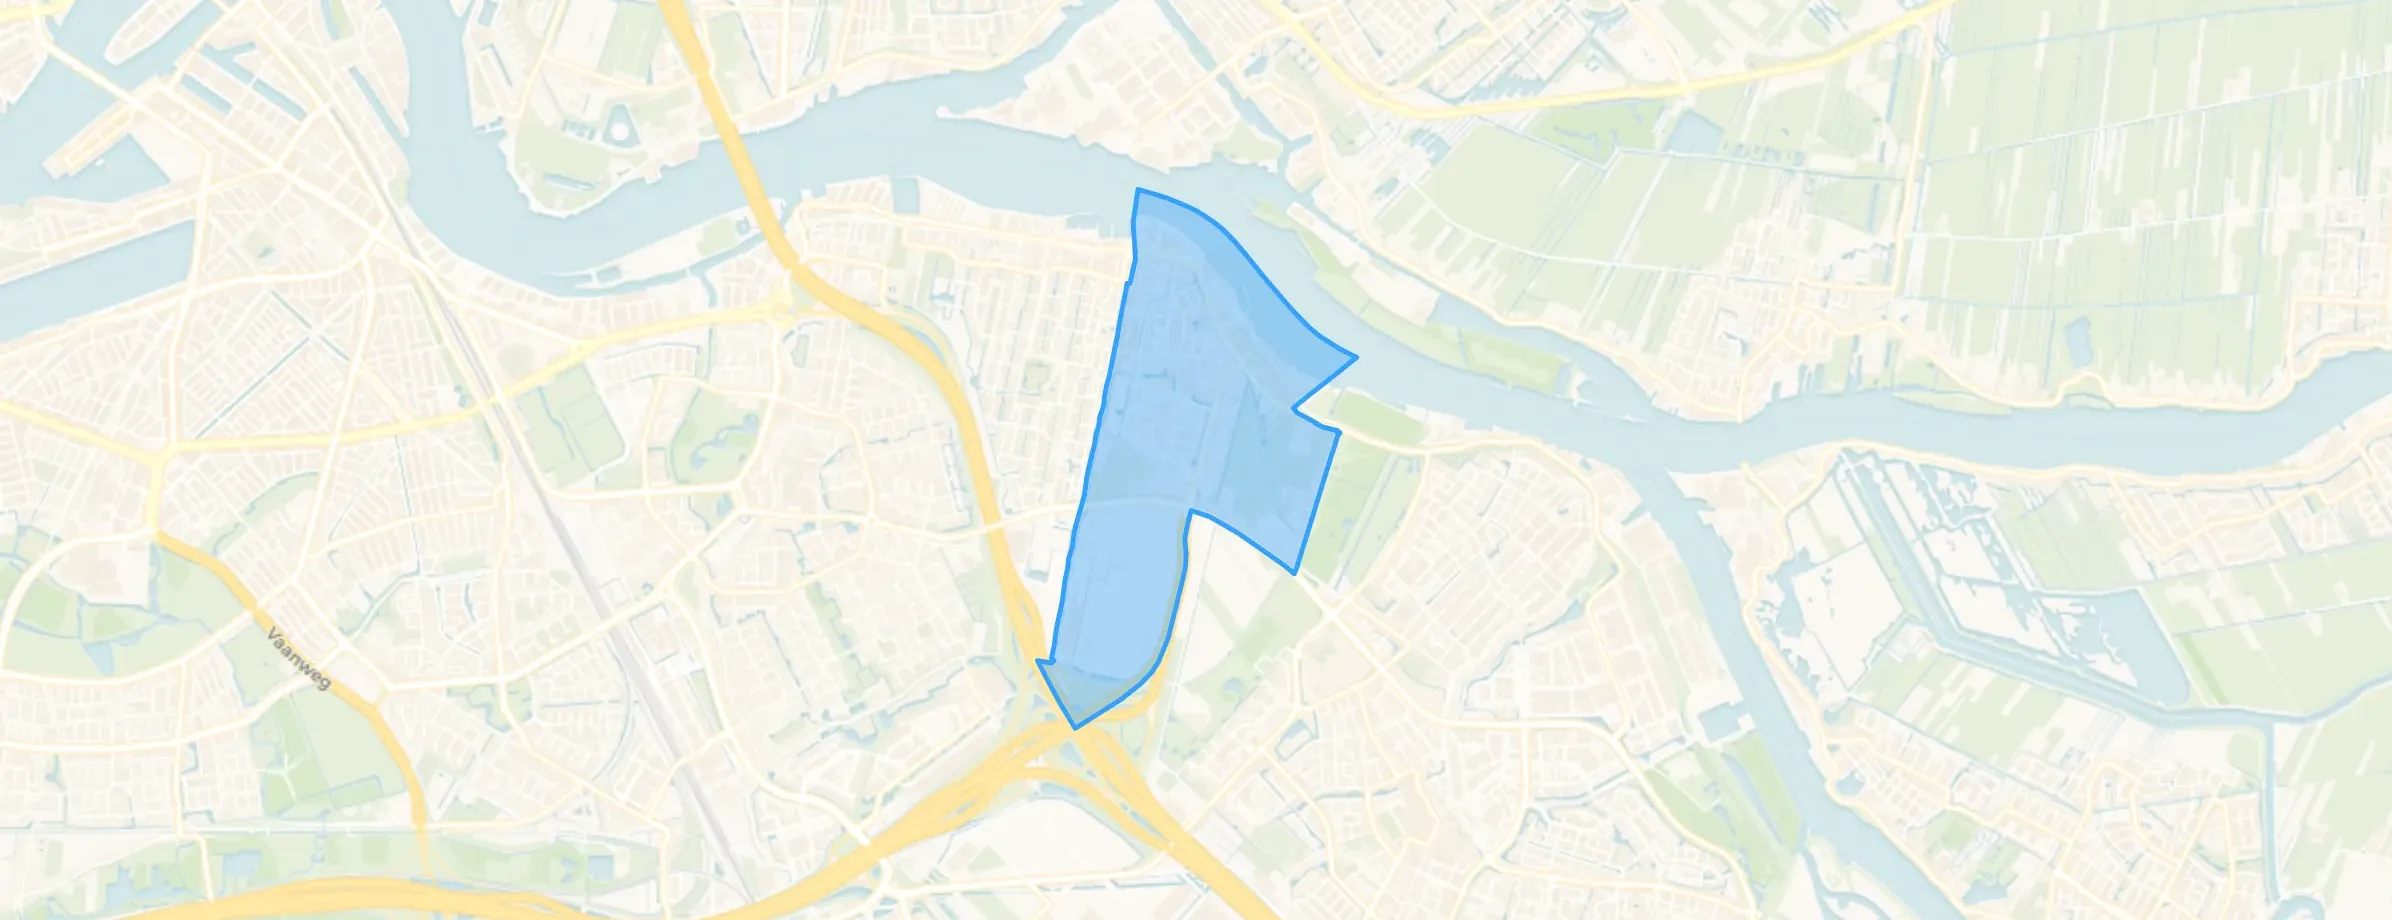
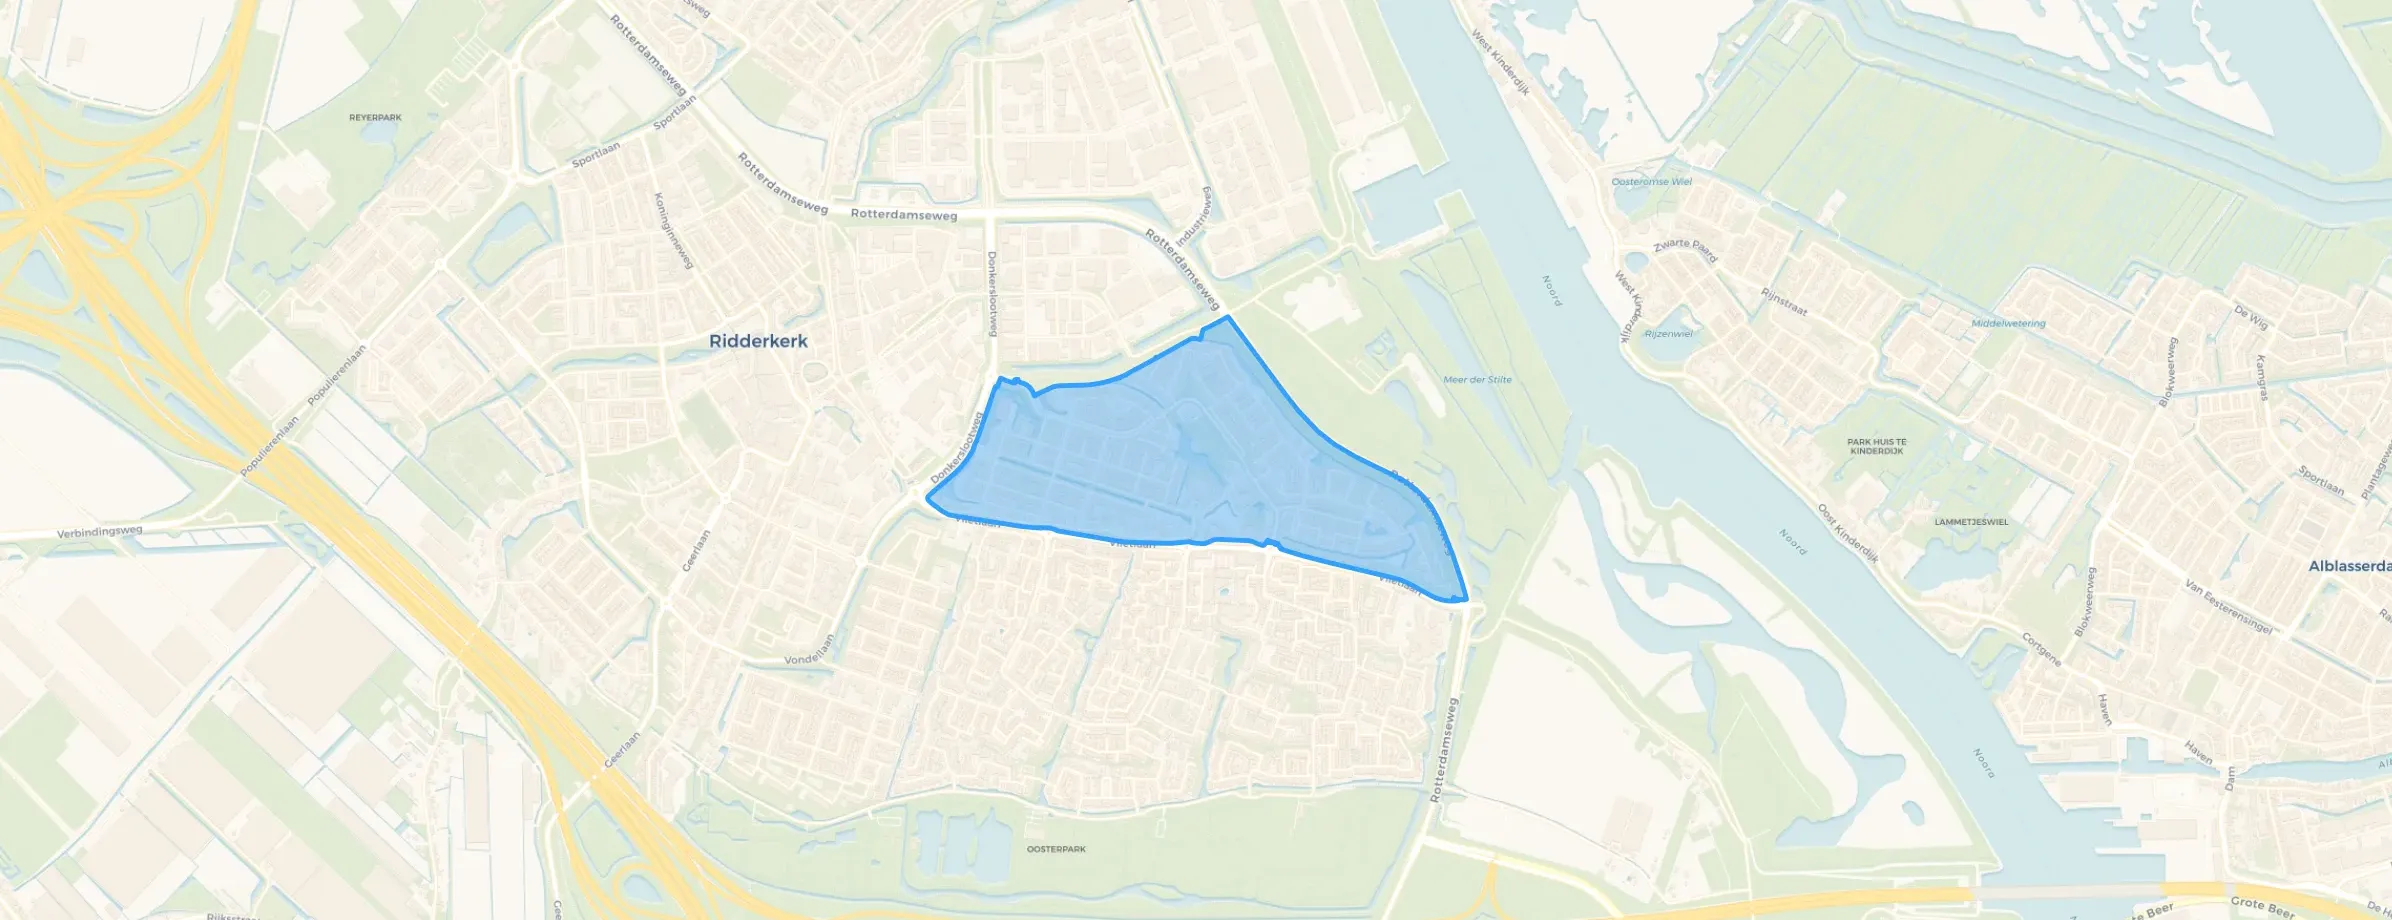
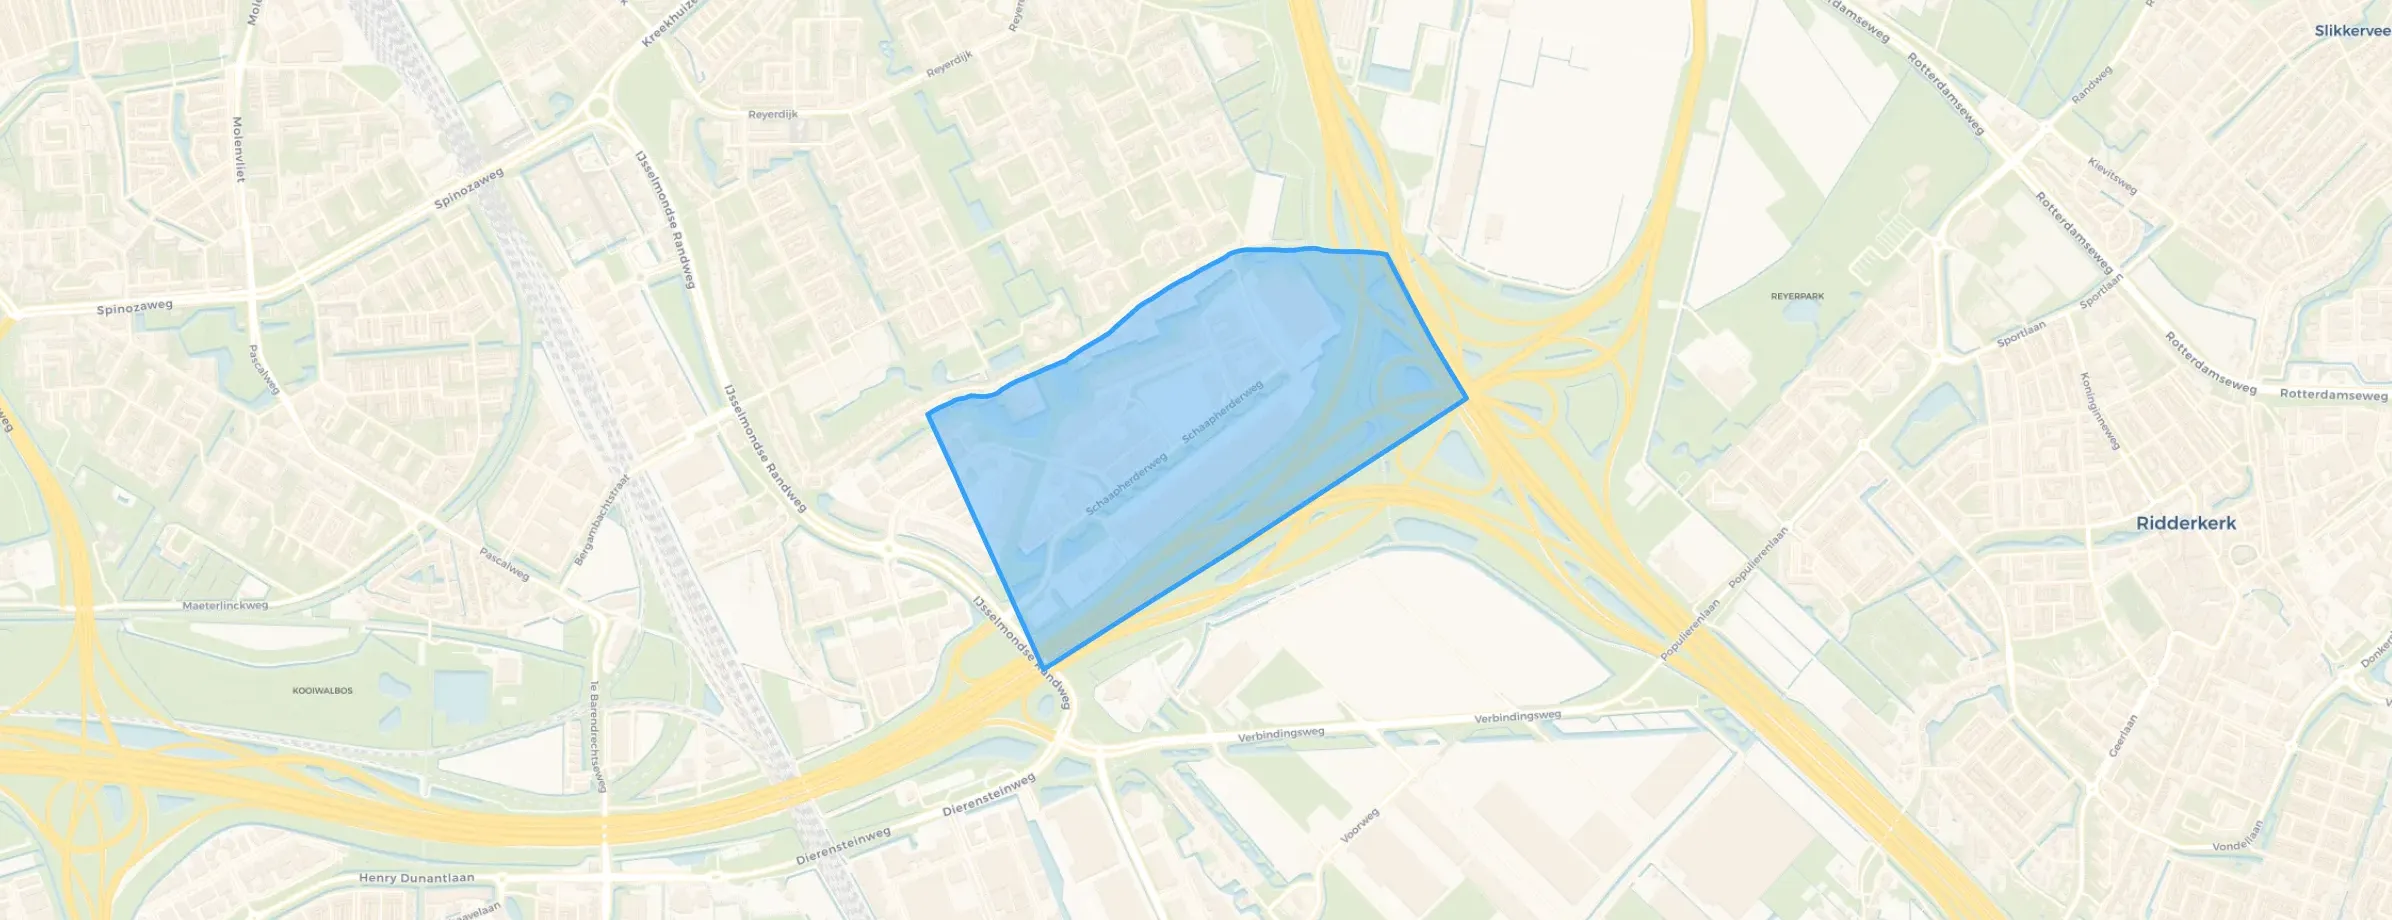
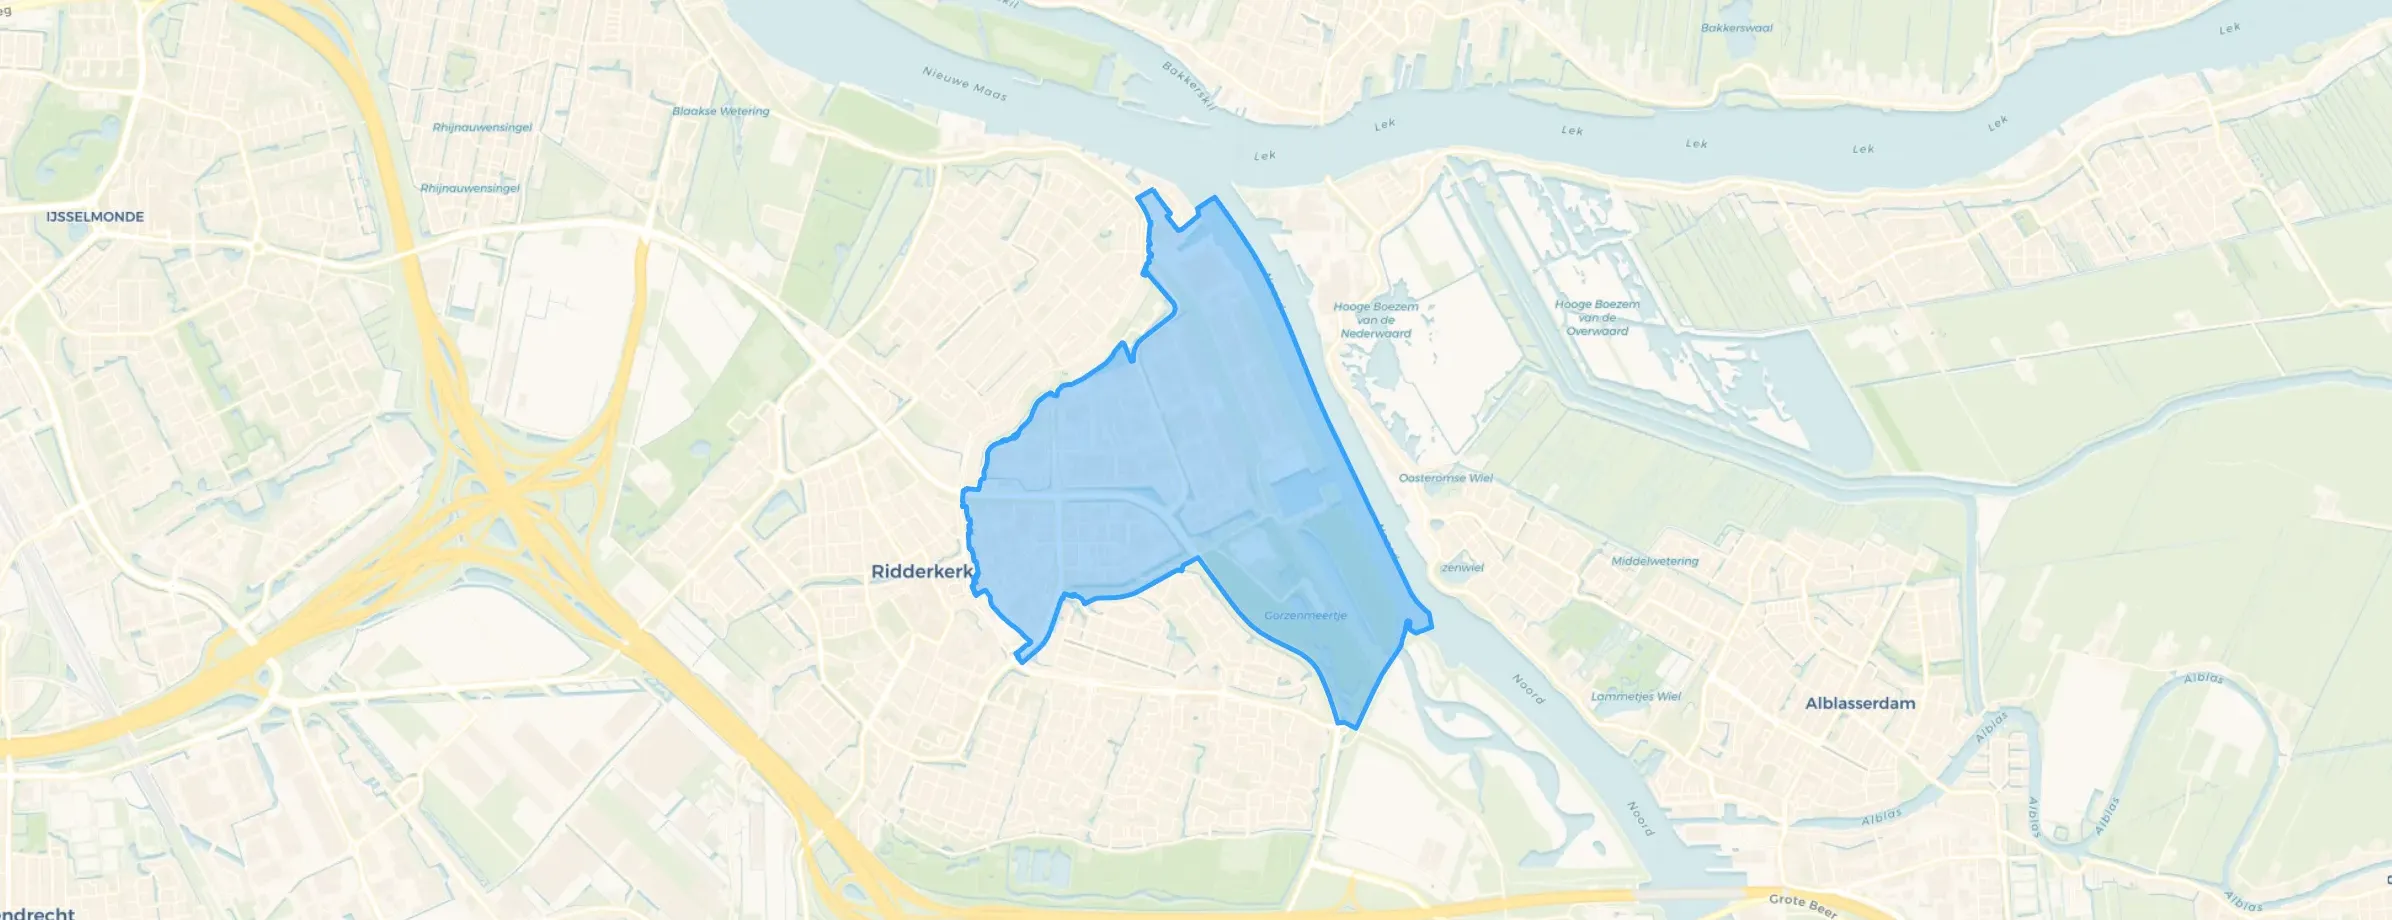
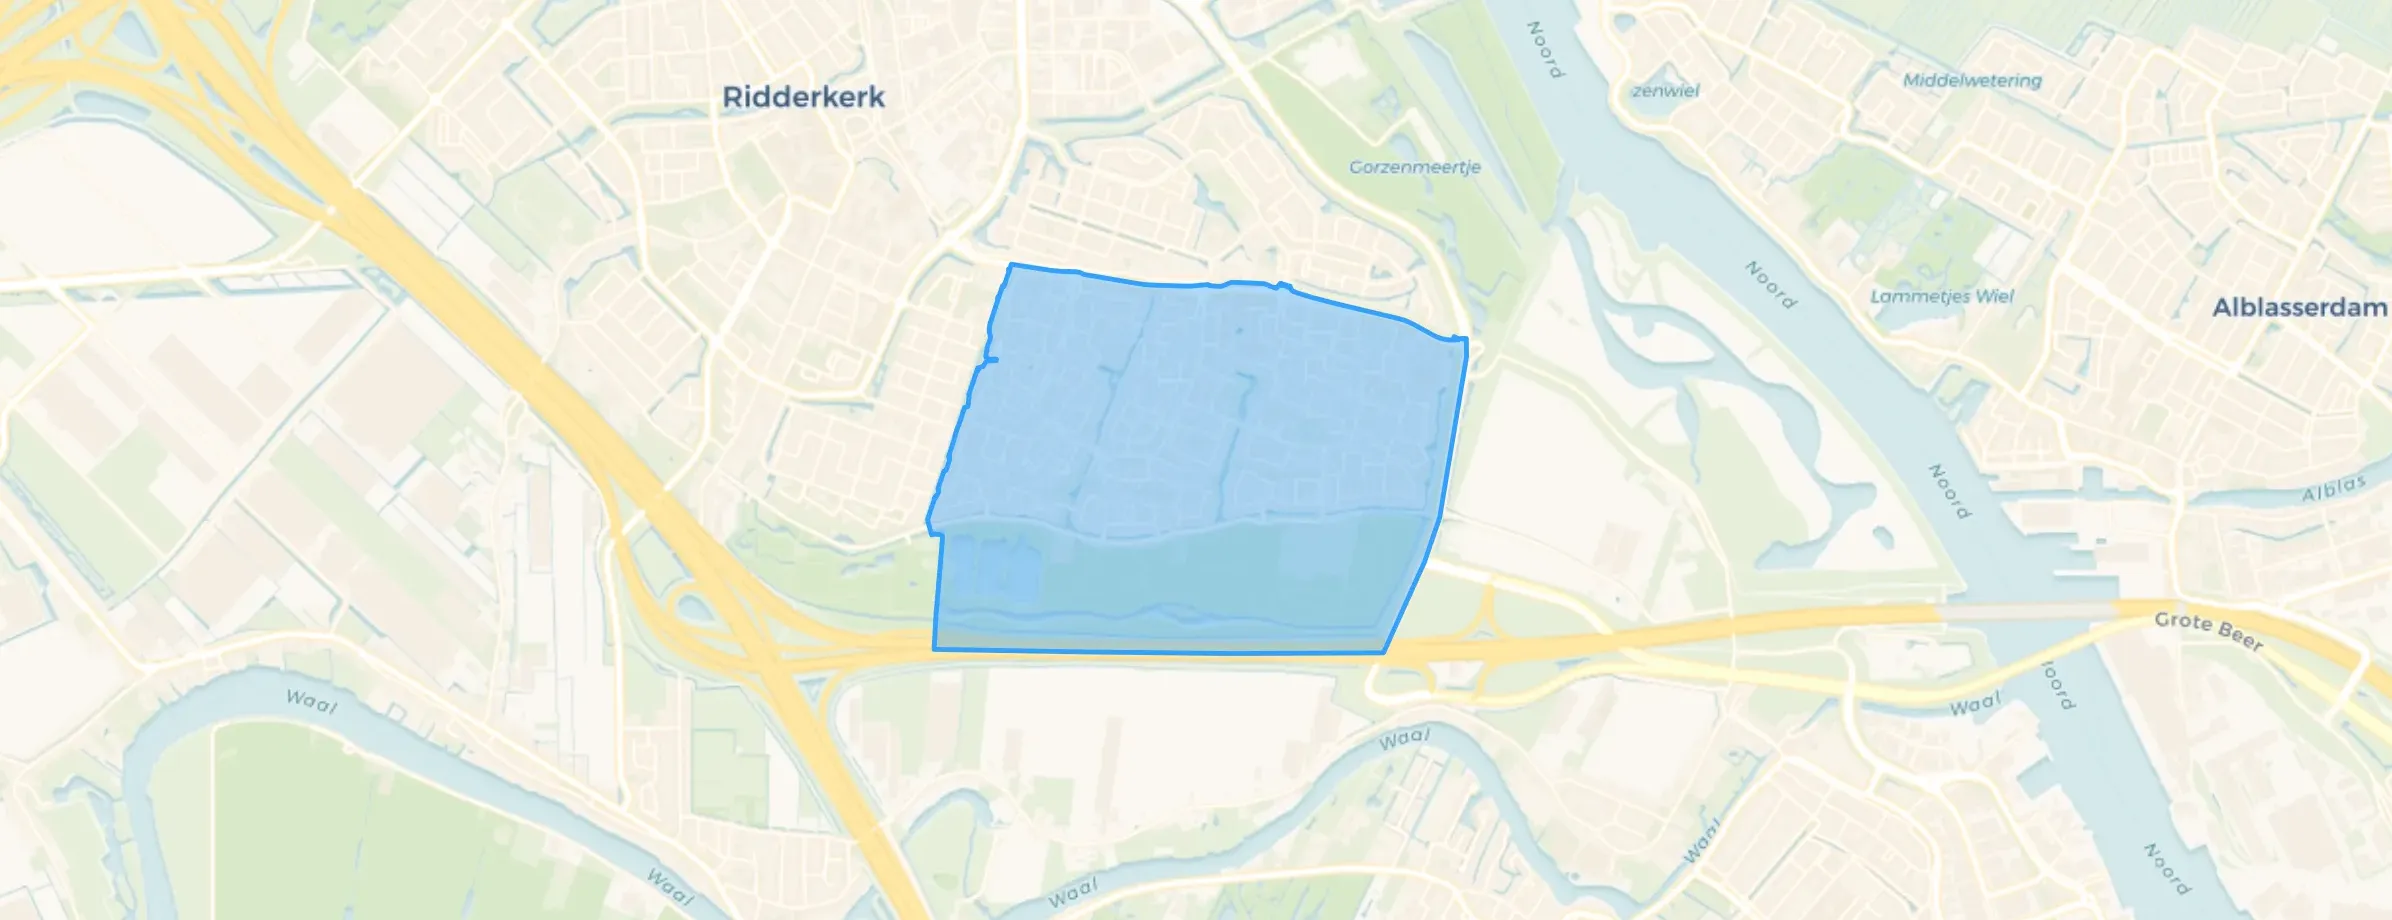
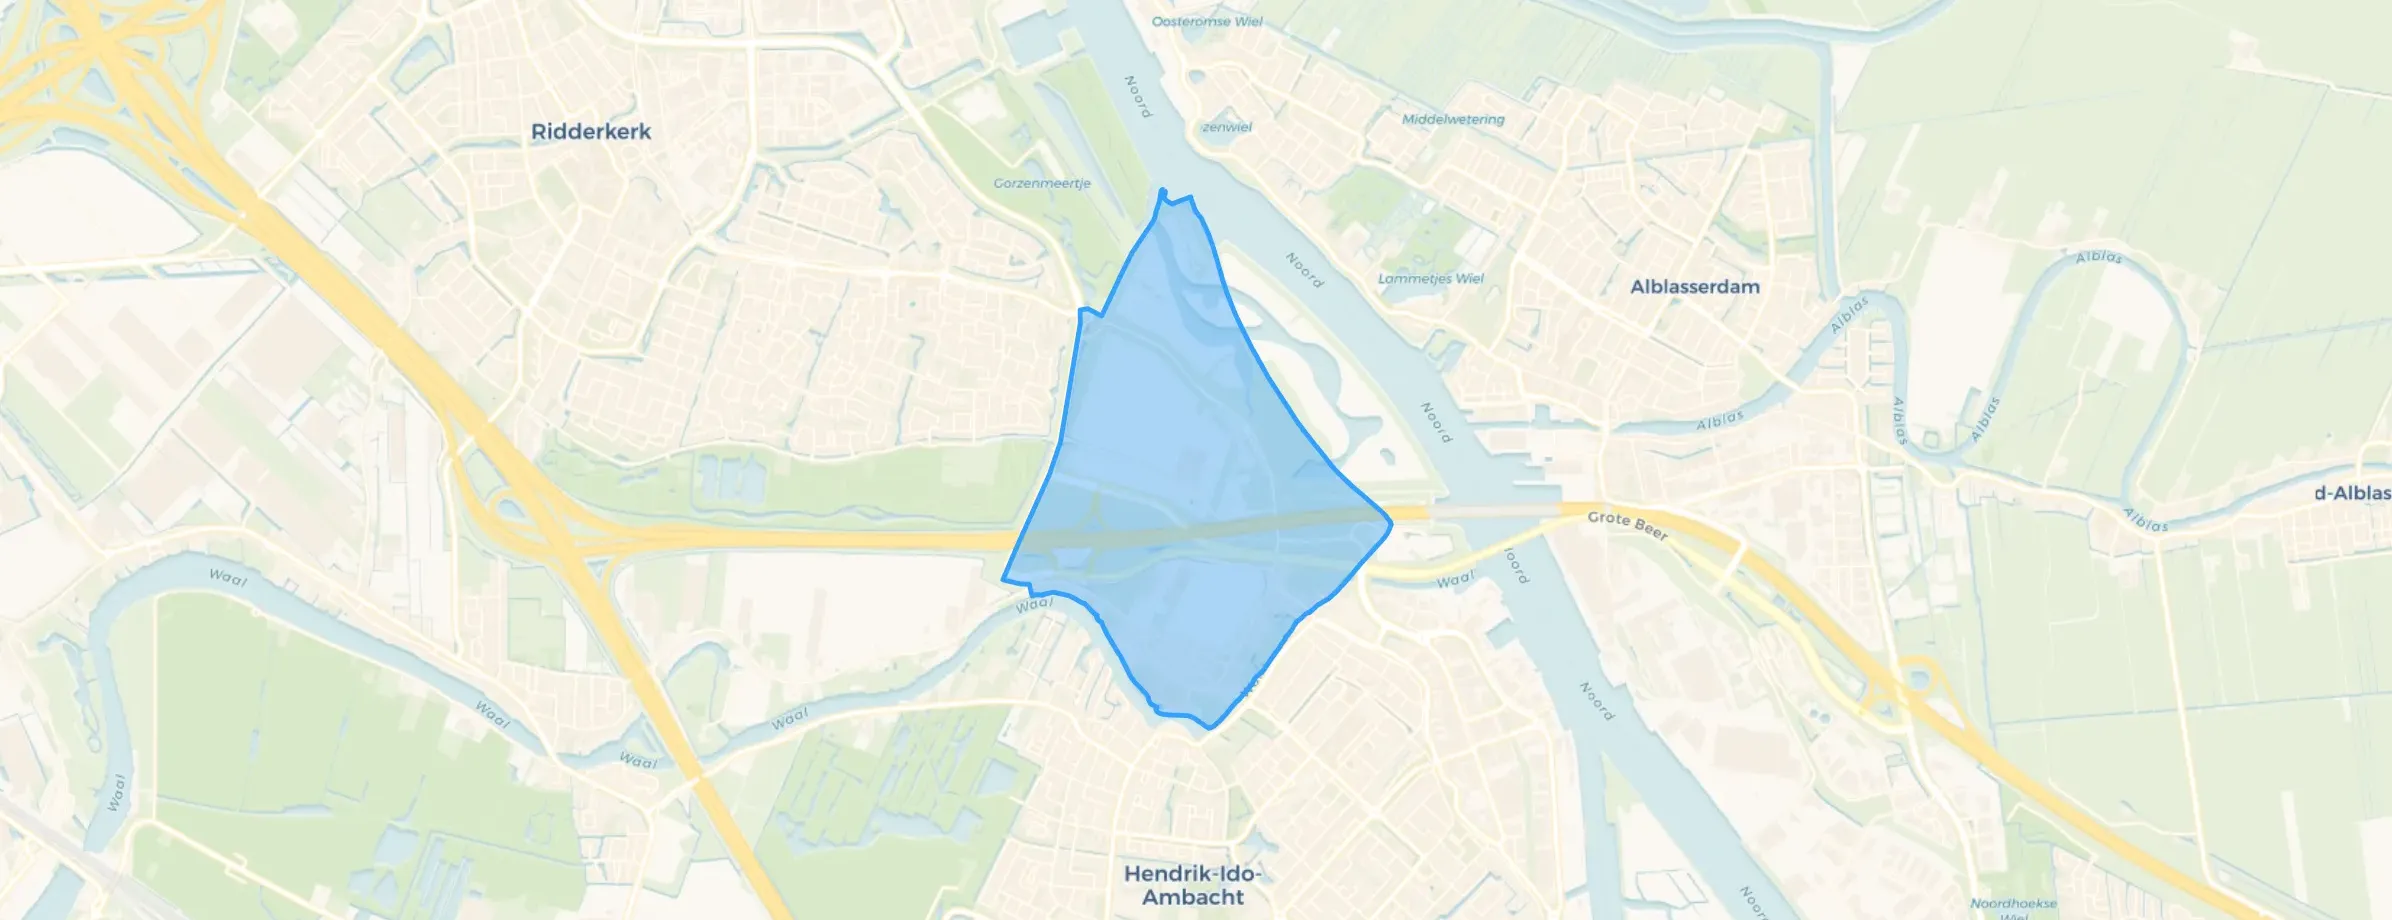
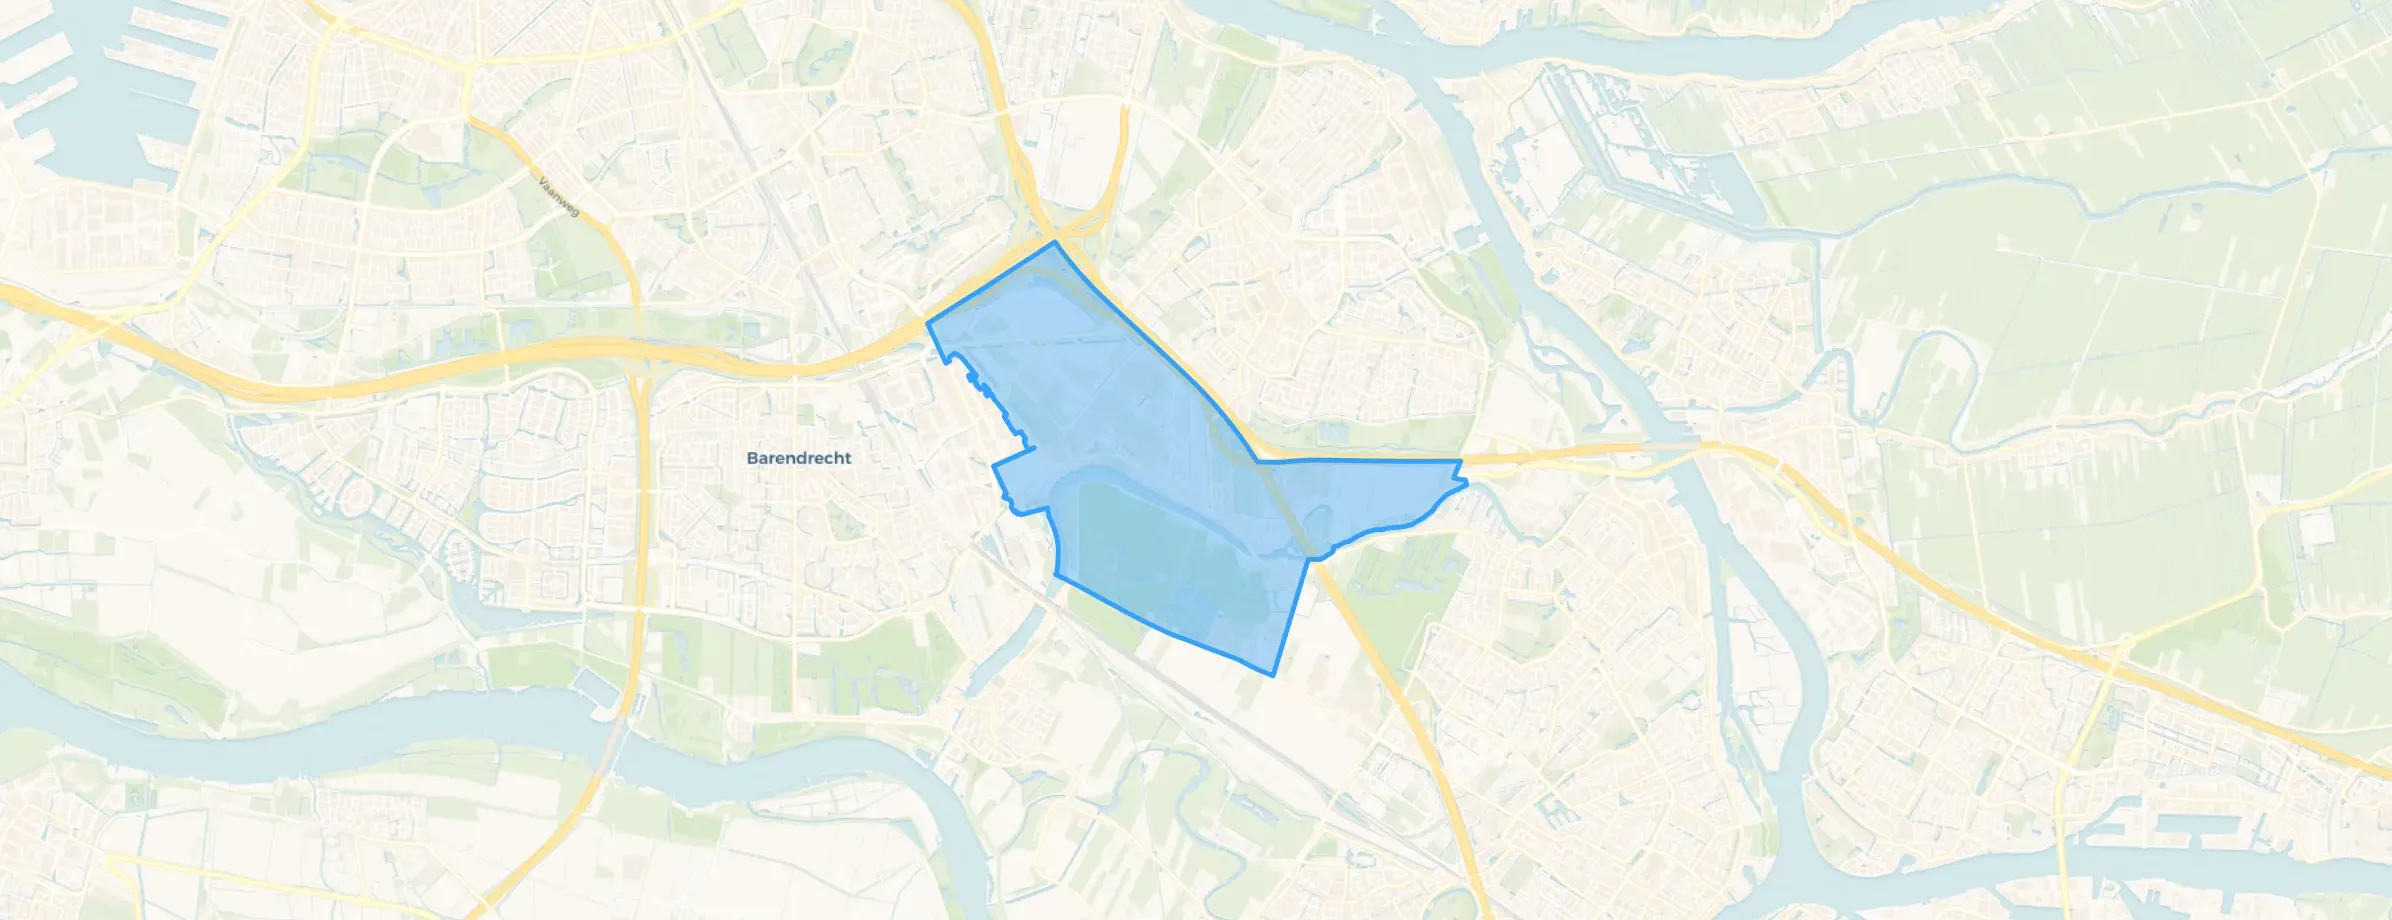
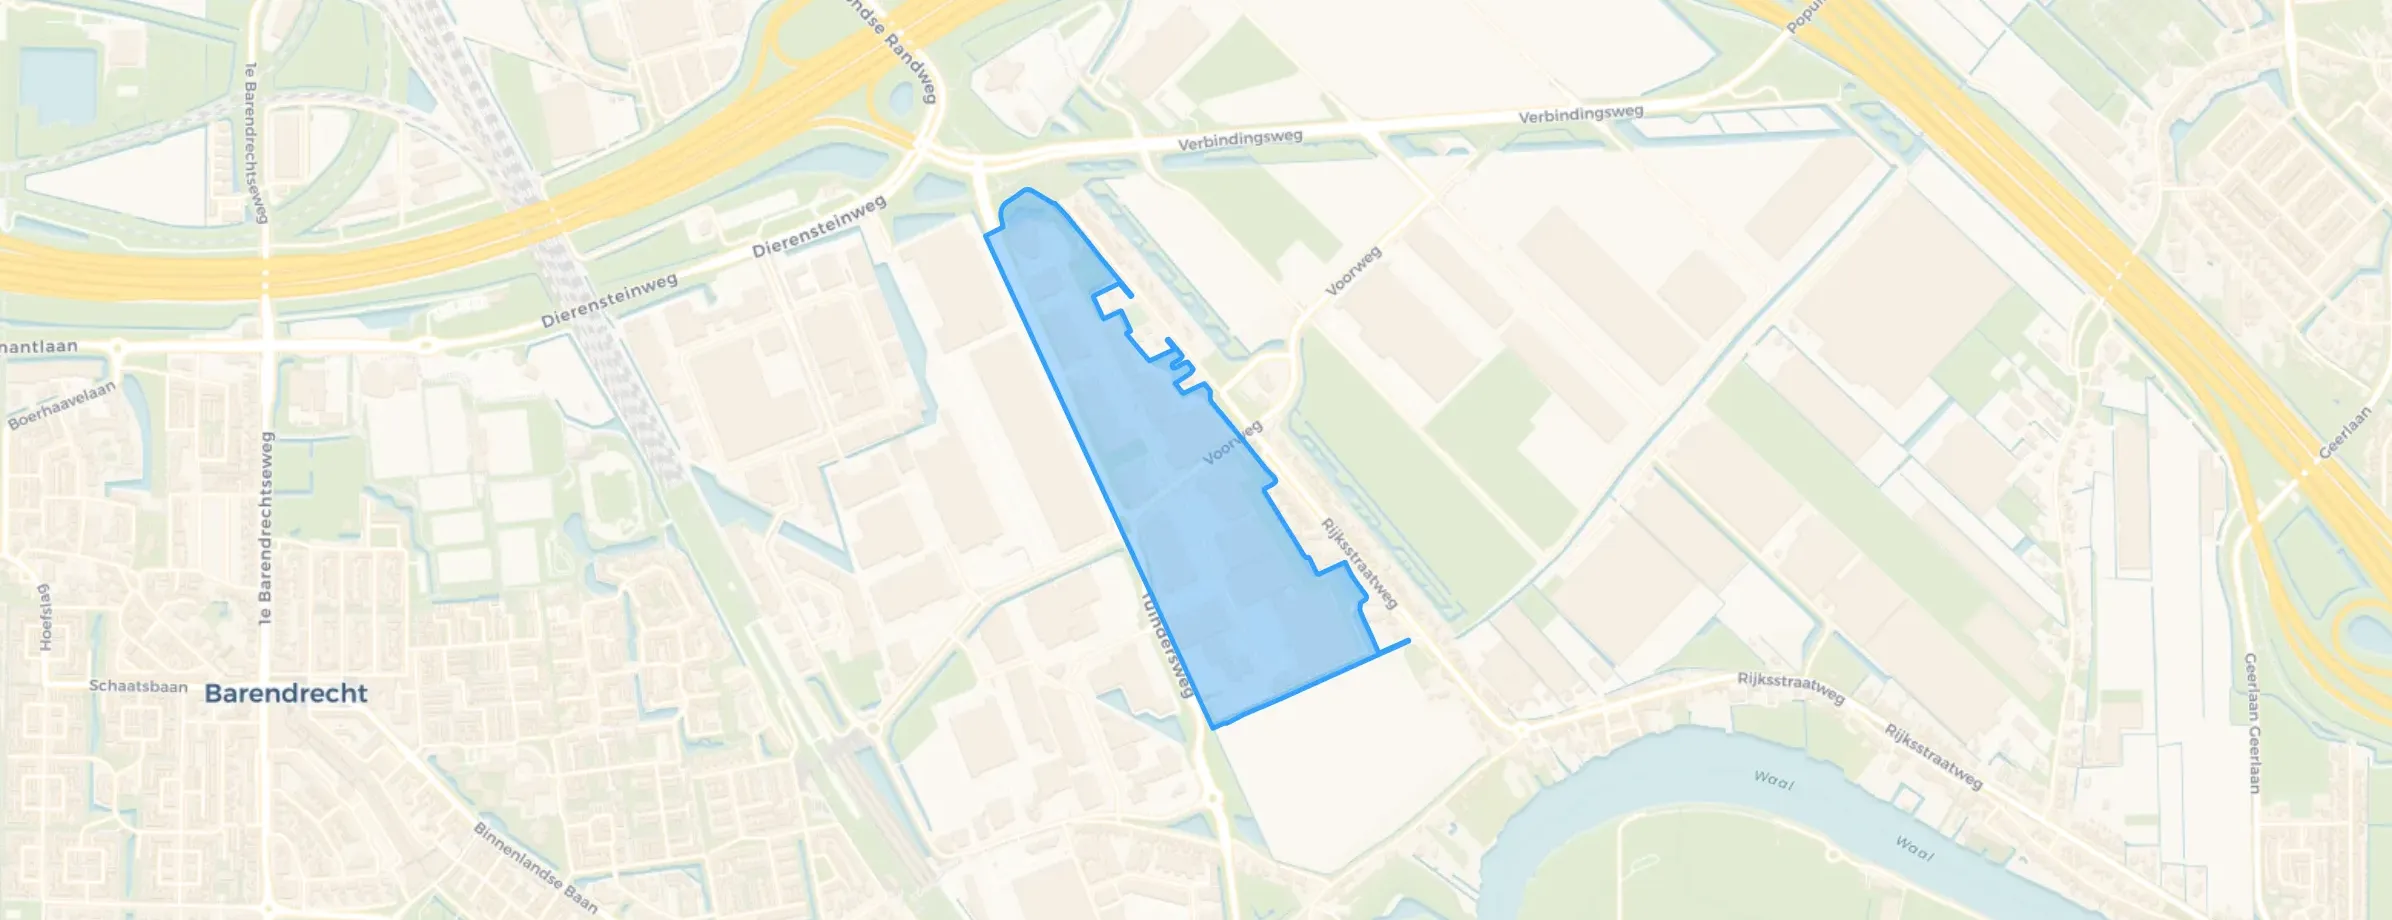
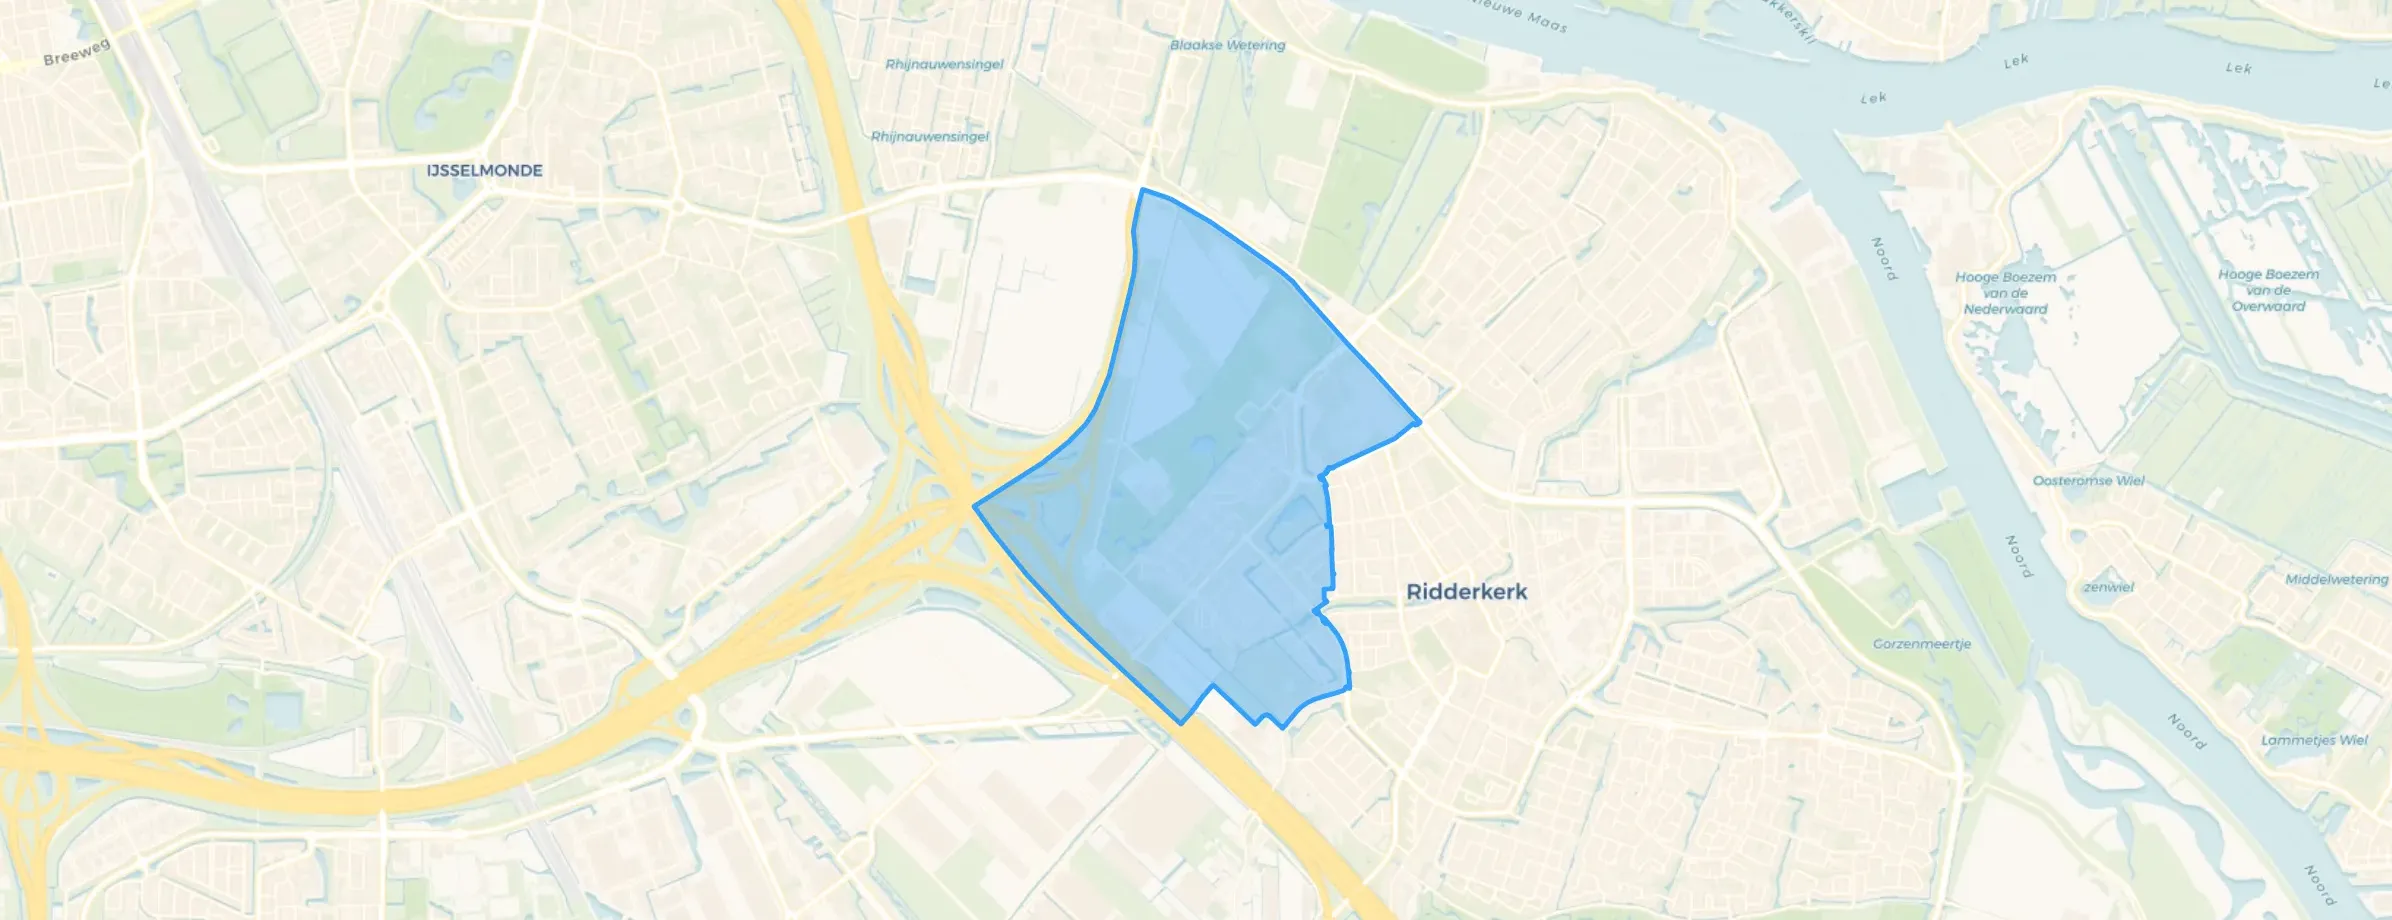
Ridderkerk is located in the province of Zuid-Holland The municipality has a total area of 2.526 hectares, of which 2.348 hectares are land and 179 hectares are water. The municipality is coded as GM0597. The postcode area is 2981AA-2989AZ.
Ridderkerk has 47.999 residents. Of these, 48,4% are men and 51,6% are women. Most residents are 45 to 65 years (25,6%). The other age groups are 24,5% for '65 years or older', 23,4% for '25 to 45 years', 16,1% for '0 to 15 years' and 10,5% for '15 to 25 years'. Of the residents, 44,6% is unmarried, 41,6% is married, 7,6% is divorced and 6,2% is widowed. 35.759 residents originate from the Netherlands, 2.917 come from Europe and 9.323 come from countries outside Europe.
There are 21.483 households in Ridderkerk. 35,1% of these are single-person households, 30,5% households without children and 34,4% households with children. The average household size is 2,2 persons. The national average is 2,1 persons.
In Ridderkerk there are 38.400 income recipients. The average income per income recipient is €40.000, which is €2.200 (5%) lower than the national average of €42.200. Per resident, the average income is €32.800, which is €2.100 (6%) lower than the national average of €34.900. Most residents of Ridderkerk are educated to an intermediate level. 44,8% have an intermediate education (HAVO, VWO or MBO 2-4), 31,6% have a lower education (VMBO or MBO 1) and 23,6% have a university or higher professional education (HBO/WO).
Of the 47.999 residents, around 72% are in paid employment, which amounts to 34.559 people. This is 0% lower than the national average of 72%. The majority of workers are in salaried employment (85%), while 15% are self-employed. In Ridderkerk, 29% of residents receive a benefit. The largest group is those receiving a state pension (AOW). 10.580 people receive this benefit.
In Ridderkerk there are 21.966 homes with an average assessed value (WOZ) of €346.000. Of these, around 96% are occupied and 4% unoccupied. Most homes are owner-occupied. This amounts to 42% rental homes and 58% owner-occupied homes. Of the homes, 57% privately owned, 38% owned by housing associations and 5% owned by other landlords. The most common construction periods in Ridderkerk are 1950-1970 (32%) and 1970-1980 (19%).
There are currently no homes for sale in Ridderkerk. The most recently listed home is Van der Waalsstraat 1 by Makelaarsland op Funda. No homes were sold in Ridderkerk over the past year.
There are currently no homes for rent in Ridderkerk. The most recent home is Molensteeg 2, offered by Kooyman Eigen Huis Sliedrecht. No homes were let in Ridderkerk over the past year.
No recent rental data available for Ridderkerk.
In Ridderkerk there are 15.255 addresses with a registered energy label. The most common labels are C (26%), A (24%) and B (18%). On average, an address in Ridderkerk uses 2.550 kWh of electricity per year. This is in line with the national average. With an annual consumption of 740 m³ per address, natural gas consumption is 8% below the national average of 800 m³.
Lots of orthodox Christians. I just get stared at when I wear trousers. And in the village itself there are actually a lot of loitering youths and stuff.
Auto-translated to English by AIOur housing association actually does nothing to make the neighbourhood more attractive. As an example where I live, the 4 seasons, the Lente gild to try to make it more attractive. I tried talking to the housing association about this, but missed opportunity. Too bad.
Auto-translated to English by AINo activities for adults. And certainly the housing association Wooncompas does nothing at all for us, in our complex where many elderly people live. Too bad.
Auto-translated to English by AIFor me, Slikkerveer feels like a quiet and green place with a village atmosphere, where it's nice to live, although I do notice that it's not always easy to reach from Rotterdam because there is no direct train connection.
Auto-translated to English by AIMy experience with the neighbourhood is good; the people in the neighbourhood are very helpful. People don't mind helping each other, and the elderly are also helped in the neighbourhood, for example with putting the wheelie bin out on the street and bringing it back in, or doing a small errand for them. It is also safe to live in this neighbourhood. The greenery could be a bit better with some more colour, but it is maintained. Across from the neighbourhood is a primary school, and the neighbourhood is very accessible. The shops are also easy to reach on foot or by bike. I have lived here for over 25 years with great pleasure.
Auto-translated to English by AIBeen at it for 41 years trying to keep the hall and stairwell of my flat at least somewhat hygienic, with no cooperation from fellow residents and also not from the housing corporation, now almost 73 and tired of fighting, longing for a solution, so much want to spend the years I have left with living pleasure………
Auto-translated to English by AIAbsolutely fine
Auto-translated to English by AIGood neighbourhood kees
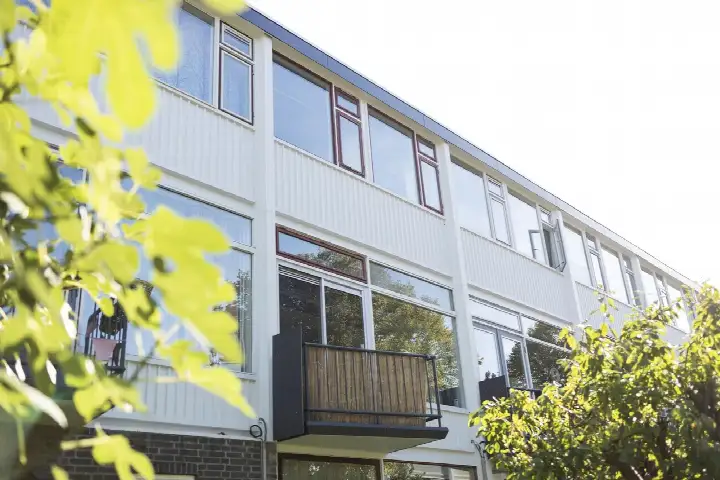
Auto-translated to English by AIThe housing stock is mainly post-war — 56% was built between 1945 and 1990. In addition, the most common type is flats (48%).
Over the past year a home for sale in Ridderkerk was listed for an average of €483,183 (€4,273 per m²). Last quarter prices rose by 6%.
A rental home in Ridderkerk cost an average of €2,199 per month (€21 per m²).
Residents give Ridderkerk a 7.3 out of 10 based on 14 reviews. Especially safety (8.1) scores well; cleanliness (6.8) receives the lowest rating.
From Ridderkerk you can on average reach a supermarket at 0.8 km, a GP at 1.0 km, a railway station at 5.3 km, a primary school at 0.6 km (as the crow flies, source: CBS).
Right now you will find 195 homes for sale and 4 homes for rent in Ridderkerk.