Municipality in Noord-Brabant
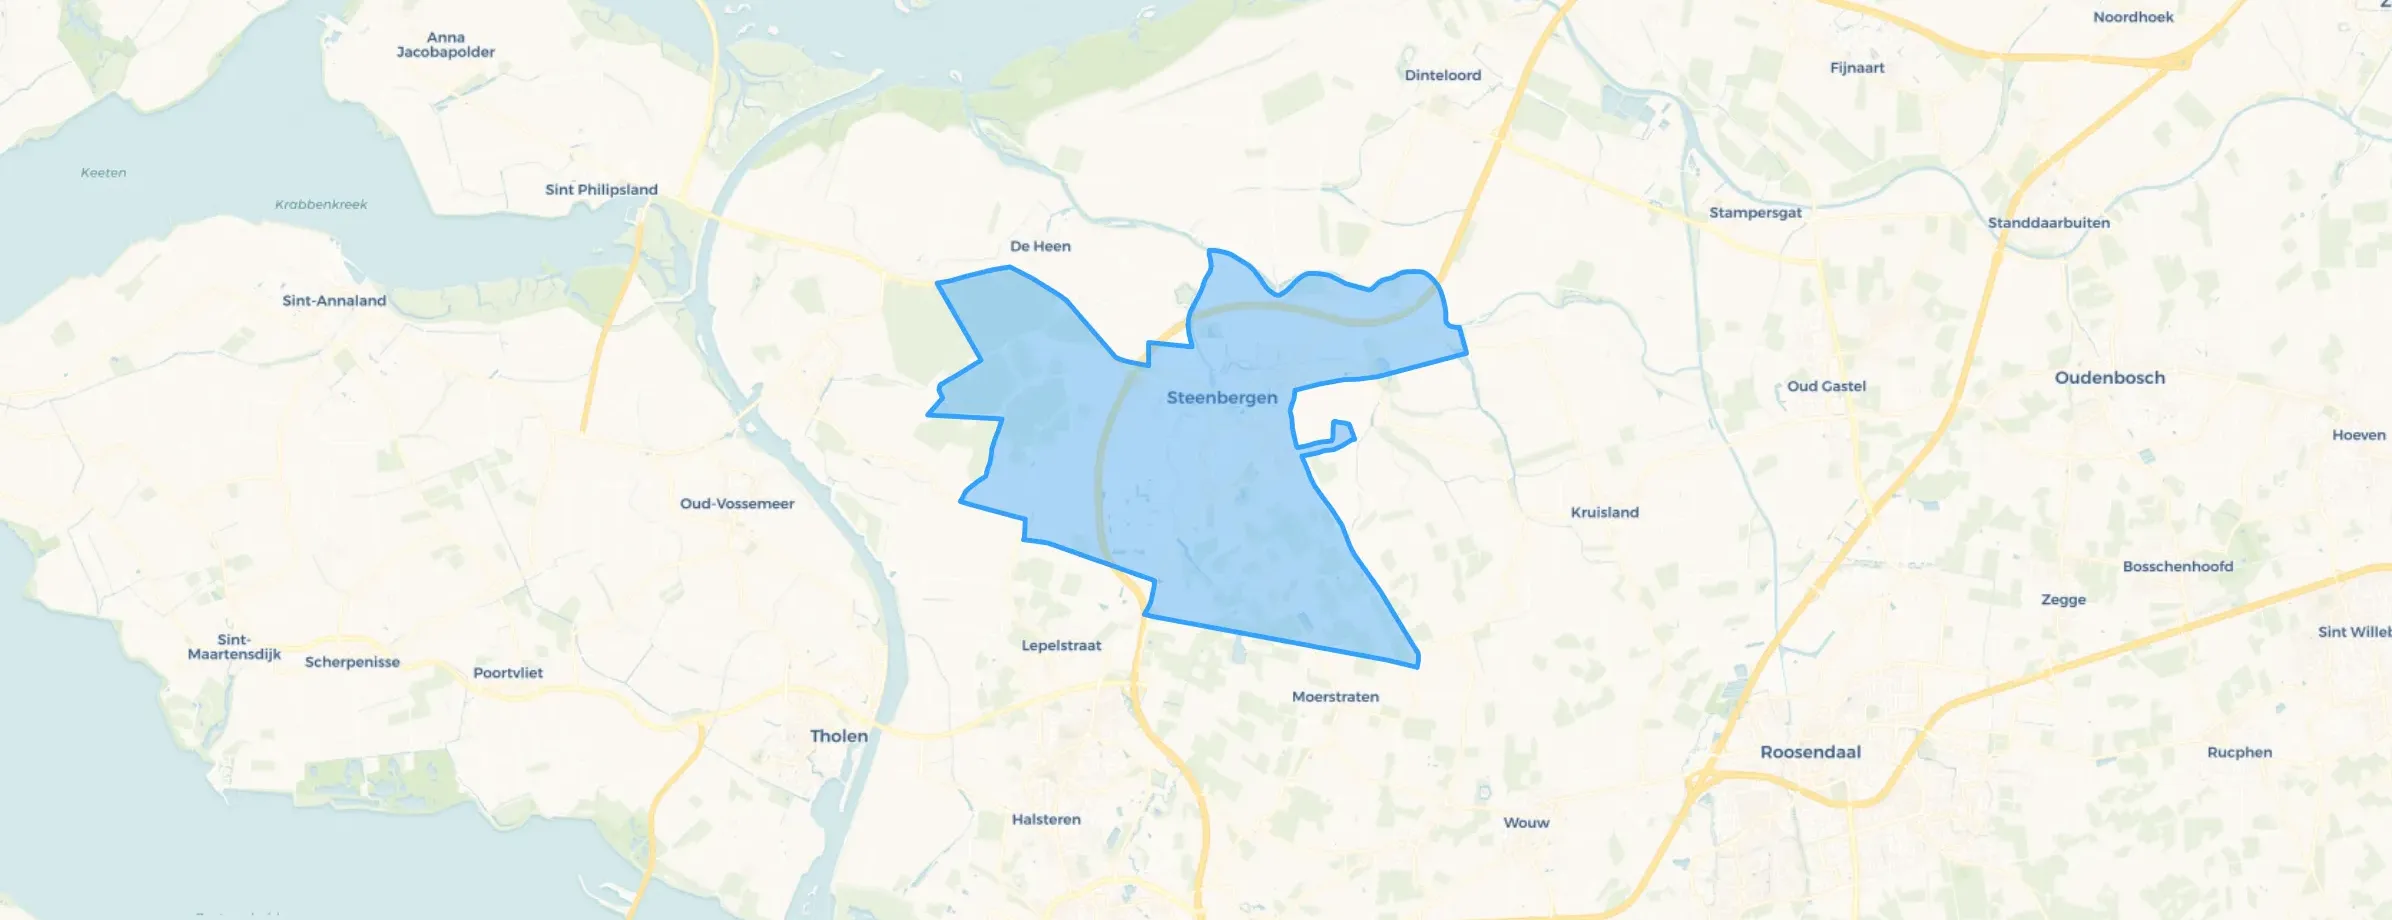
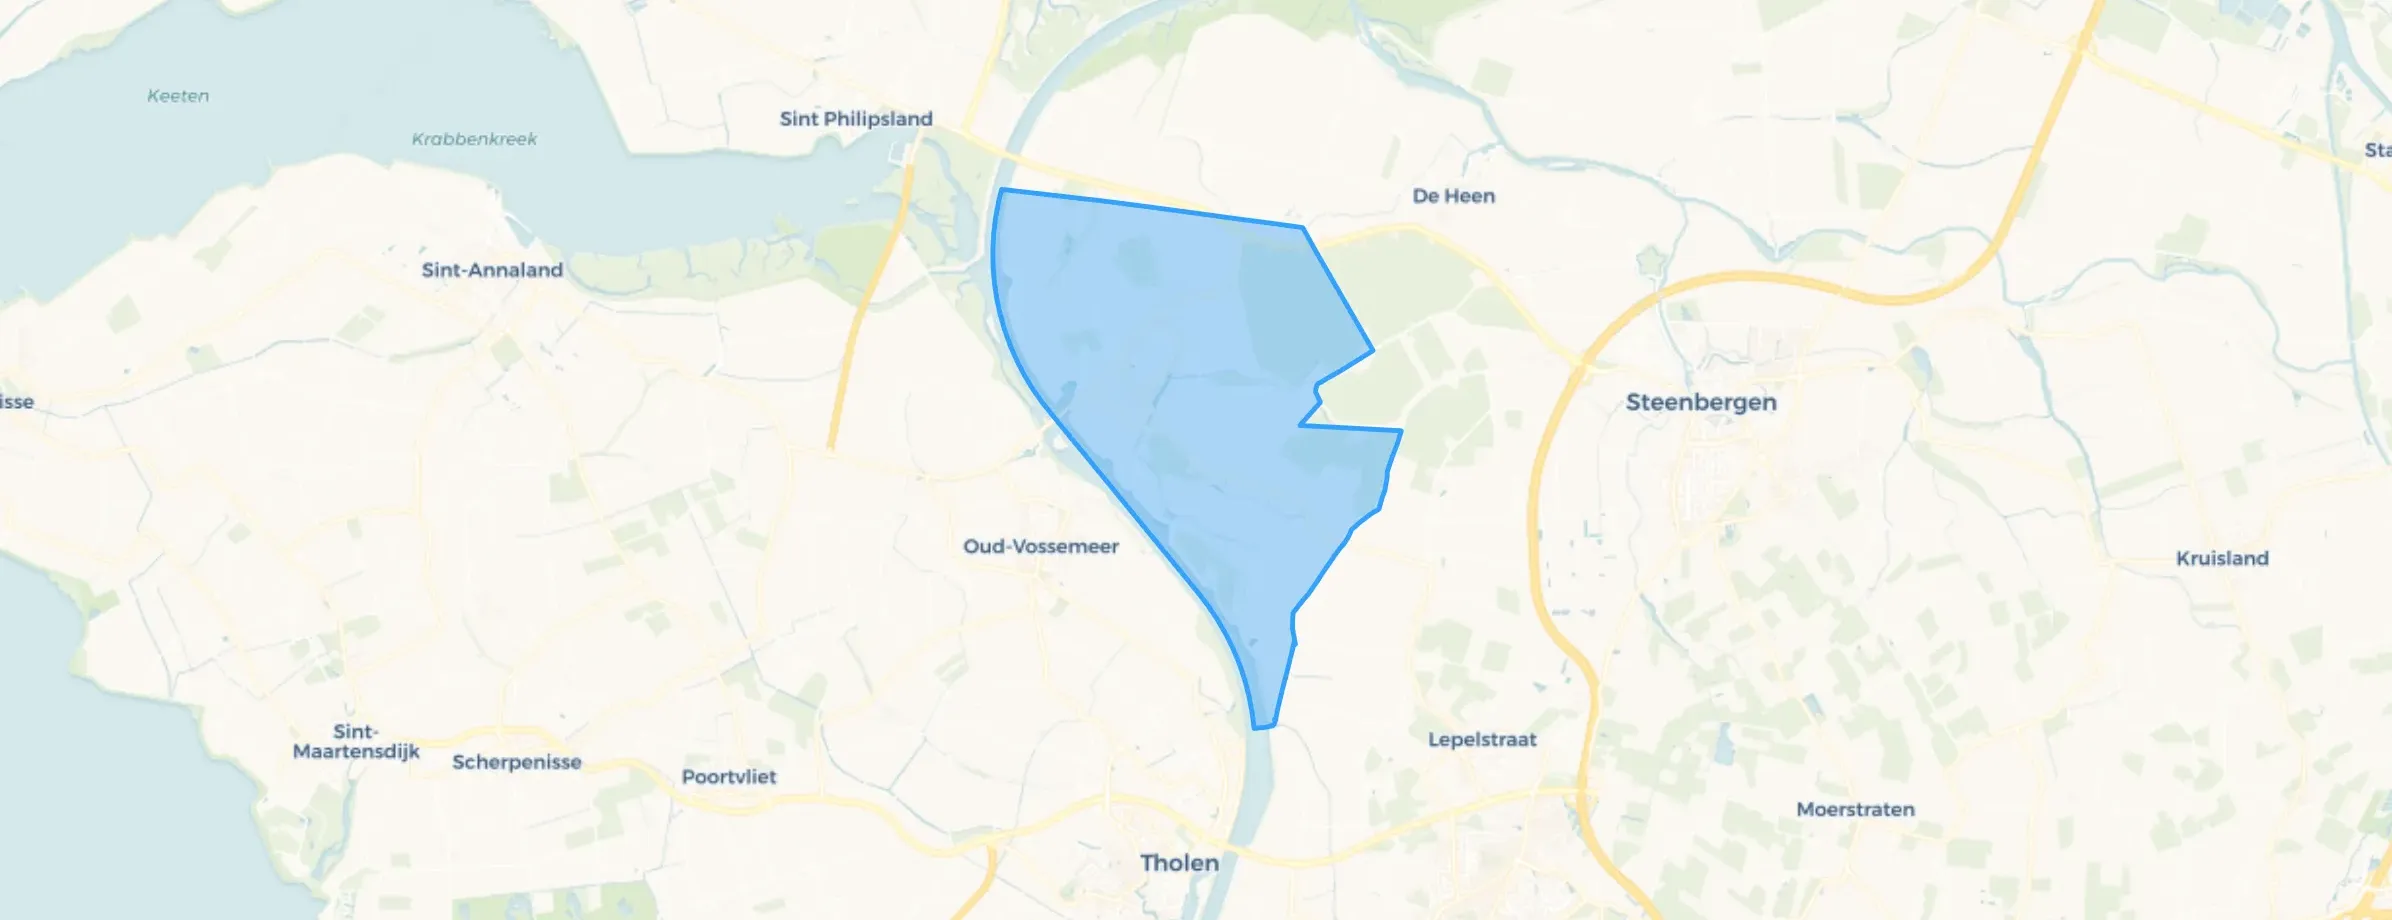
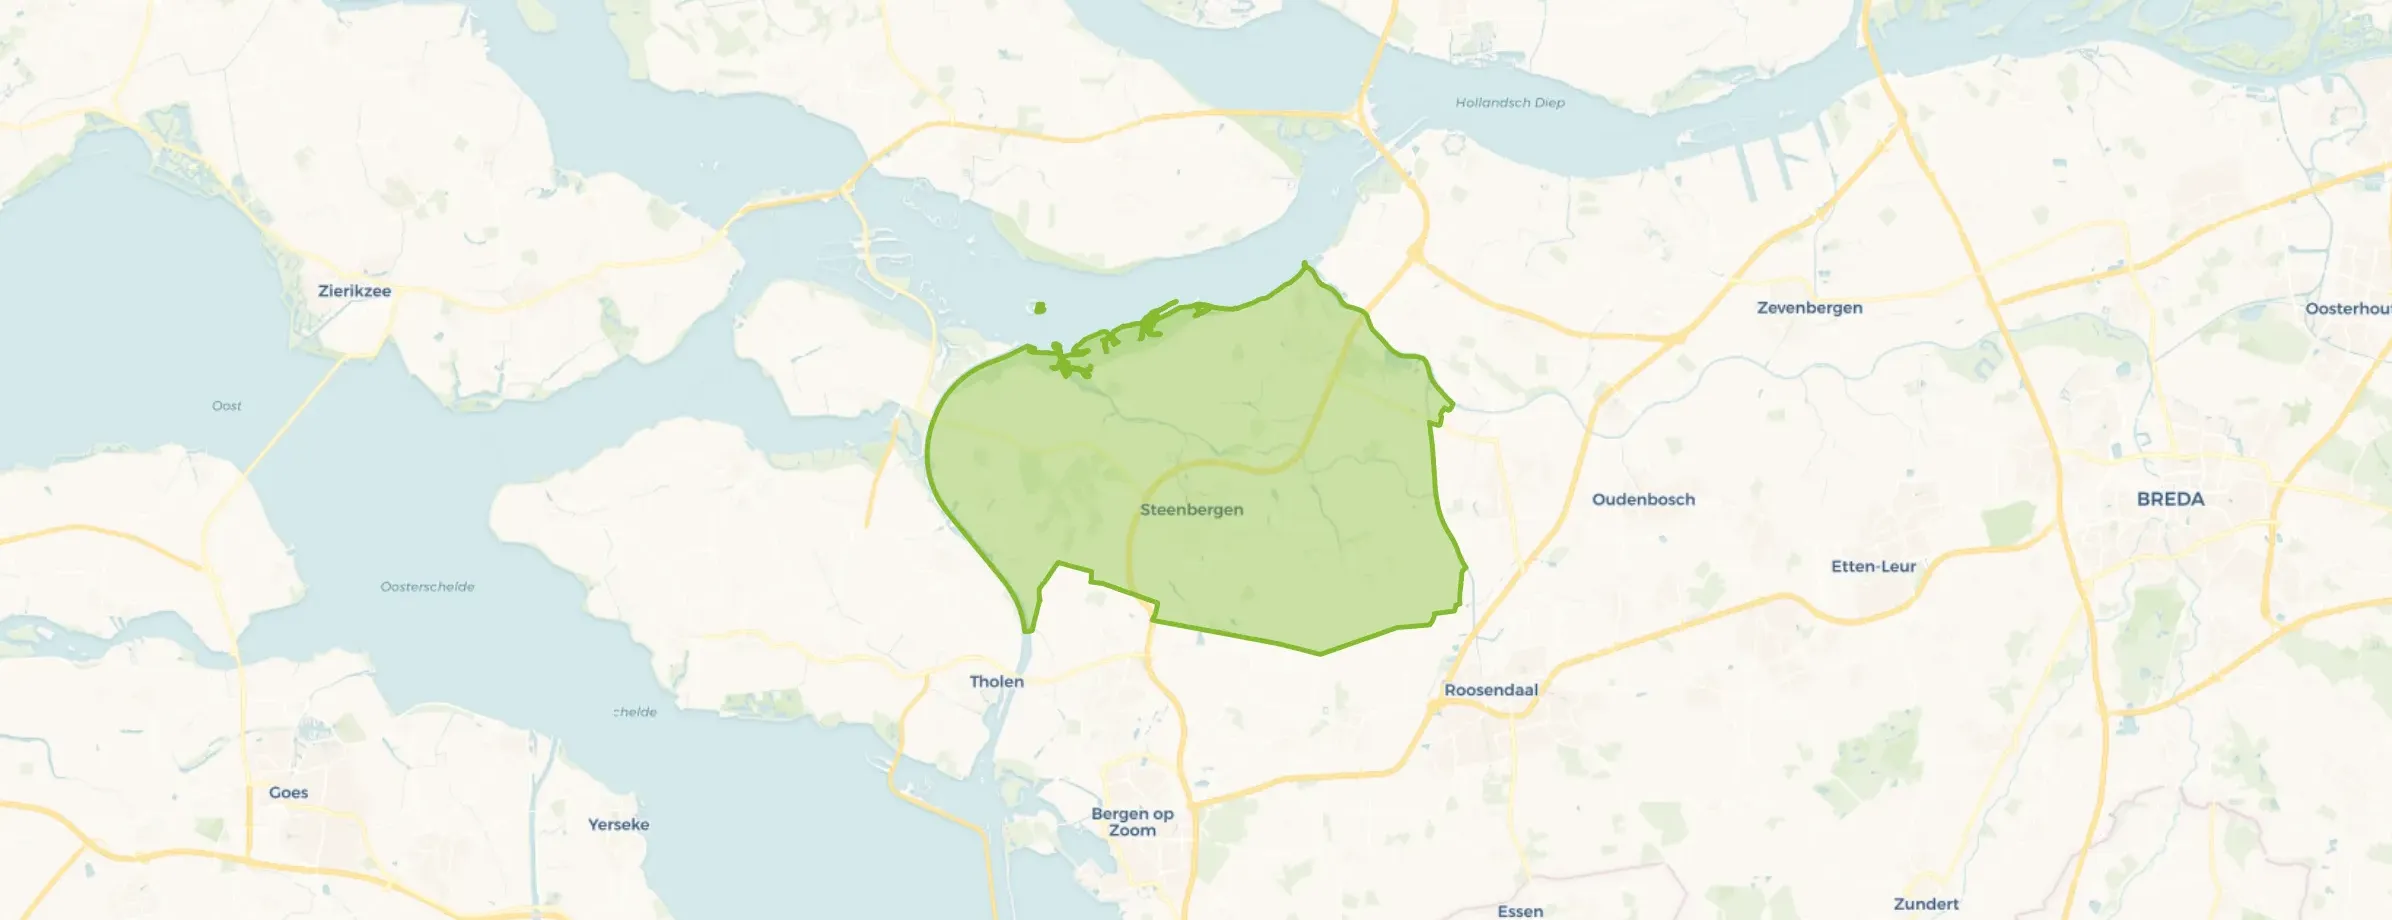
Steenbergen is located in the province of Noord-Brabant The municipality has a total area of 15.914 hectares, of which 14.650 hectares are land and 1.264 hectares are water. The municipality is coded as GM0851. The postcode area is 4651AA-4756TZ.
Steenbergen has 24.476 residents. Of these, 50,5% are men and 49,5% are women. Most residents are 45 to 65 years (28,7%). The other age groups are 23,8% for '65 years or older', 23,2% for '25 to 45 years', 14,0% for '0 to 15 years' and 10,3% for '15 to 25 years'. Of the residents, 42,2% is unmarried, 43,9% is married, 7,7% is divorced and 6,2% is widowed. 20.570 residents originate from the Netherlands, 2.201 come from Europe and 1.705 come from countries outside Europe.
There are 11.080 households in Steenbergen. 32,7% of these are single-person households, 35,2% households without children and 32,1% households with children. The average household size is 2,2 persons.
In Steenbergen there are 20.000 income recipients. The average income per income recipient is €35.400, which is €400 (1%) lower than the national average of €35.800. Per resident, the average income is €29.600, which is €400 (1%) higher than the national average of €29.200. Most residents of Steenbergen are educated to an intermediate level. 47,5% have an intermediate education (HAVO, VWO or MBO 2-4), 29,4% have a lower education (VMBO or MBO 1) and 23,1% have a university or higher professional education (HBO/WO).
Of the 24.476 residents, around 65% are in paid employment, which amounts to 15.909 people. This is 0% lower than the national average of 65%. The majority of workers are in salaried employment (83%), while 17% are self-employed. In Steenbergen, 27% of residents receive a benefit. The largest group is those receiving a state pension (AOW). 5.200 people receive this benefit.
In Steenbergen there are 10.679 homes with an average assessed value (WOZ) of €326.000. Of these, around 96% are occupied and 4% unoccupied. Most homes are owner-occupied. This amounts to 30% rental homes and 70% owner-occupied homes. Of the homes, 70% privately owned, 22% owned by housing associations and 8% owned by other landlords. The most common construction periods in Steenbergen are 1950-1970 (22%) and 1970-1980 (21%).
There are currently no homes for sale in Steenbergen. The most recently listed home is Boomdijk 32 by Helmig Makelaardij en Taxatieburo o/z op Vastgoed Nederland. No homes were sold in Steenbergen over the past year.
There are currently no homes for rent in Steenbergen. The most recent home is de Ruyterstraat 30, offered by www.klikvoorwonen.nl. No homes were let in Steenbergen over the past year.
No recent rental data available for Steenbergen.
In Steenbergen there are 10.820 addresses with a registered energy label. The most common labels are C (26%), A (18%) and B (18%). On average, an address in Steenbergen uses 2.990 kWh of electricity per year. This is 6% above the national average of 2.810 kWh. With an annual consumption of 1.100 m³ per address, natural gas consumption is 14% below the national average of 1.280 m³.
Close to playground, school and supermarket, child-friendly neighbourhood
Auto-translated to English by AISince April 2024, I have been a resident in a nice, modern apartment building. It's pleasant living with residents of all ages, a true reflection of society. Amenities are easily accessible, whether on foot, by bike, or by car. There is ample parking, and in the evenings the area is very well lit. That gives a safe feeling. The building is located next to the Ravelijn. The through road is busy, but it brings life to the neighbourhood. There is also a bus stop for those who want to travel by public transport. The renovated park is within walking distance. The green spaces are beautifully landscaped and well maintained. In short, I am a very satisfied resident.
Auto-translated to English by AIWell, I've always felt safe here and I always feel at home here. There is quite a bit of nature in the neighbourhood, but it could always be more.
Auto-translated to English by AIIn the Orchideestraat in Steenbergen, a neighbourhood library with good food and drinks would be welcome so that we can also exchange and use things at night, as well as a mini library with CDs, DVDs, books and games in the area to exchange and use. So if the municipality of Steenbergen still has too much money, like in that park on the Ravelijnstraat, they could spend it on that.
Auto-translated to English by AIFalse accusations against our daughter, and the municipality of Steenbergen does damn nothing about it. As long as Jackson gets told off, the municipality thinks Orchideestr19 murdered her mother. At Orchideestraat 13, we are not allowed to clean the windows, and they interfere with our belongings, wanting everything to go to the Kringloopwinkel Blauwstraat. We don't want that ourselves.
Auto-translated to English by AI
The housing stock is mainly post-war — 50% was built between 1945 and 1990.
Over the past year a home for sale in Steenbergen was listed for an average of €468,835 (€3,586 per m²). Last quarter prices rose by 17%.
Residents give Steenbergen a 6.2 out of 10 based on 5 reviews. Especially housing (8.0) scores well; cleanliness (6.3) receives the lowest rating.
The housing supply in Steenbergen is remarkably efficient: 55% has an A, A+ or B label. The average natural gas consumption per household is 1,100 m³ per year.
From Steenbergen you can on average reach a supermarket at 1.0 km, a GP at 1.4 km, a railway station at 13.0 km, a primary school at 1.0 km (as the crow flies, source: CBS).
Right now you will find 237 homes for sale and 5 homes for rent in Steenbergen. A home for sale here is listed for an average of 74 days — relatively long for the current market.

Buurtje.nl uses cookies to make the site work and to improve it. In doing so, we process data such as your IP address and the pages you visit.
We use this data for three purposes: running the website (functional), measuring visits so we can improve Buurtje.nl (analytics), and — if you allow it — tailoring ads to your interests (marketing).
How we handle your data is described in our privacy policy. You can change your preferences at any time via 'Cookie preferences' at the bottom of every page.
Choose per category which cookies we may place. Read more in our privacy policy.