Municipality in Overijssel
Steenwijkerland is located in the province of Overijssel The municipality has a total area of 32.159 hectares, of which 28.831 hectares are land and 3.328 hectares are water. The municipality is coded as GM1708. The postcode area is 7946AA-8378JM.
Steenwijkerland has 45.472 residents. Of these, 50,3% are men and 49,7% are women. Most residents are 45 to 65 years (28,3%). The other age groups are 23,8% for '65 years or older', 21,8% for '25 to 45 years', 15,1% for '0 to 15 years' and 11,1% for '15 to 25 years'. Of the residents, 43,6% is unmarried, 43,2% is married, 7,6% is divorced and 5,6% is widowed. 40.057 residents originate from the Netherlands, 2.336 come from Europe and 3.079 come from countries outside Europe.
There are 20.266 households in Steenwijkerland. 34,0% of these are single-person households, 33,0% households without children and 33,0% households with children. The average household size is 2,2 persons.
In Steenwijkerland there are 36.500 income recipients. The average income per income recipient is €33.900, which is €1.900 (5%) lower than the national average of €35.800. Per resident, the average income is €28.000, which is €1.200 (4%) lower than the national average of €29.200. Most residents of Steenwijkerland are educated to an intermediate level. 48,4% have an intermediate education (HAVO, VWO or MBO 2-4), 27,3% have a lower education (VMBO or MBO 1) and 24,4% have a university or higher professional education (HBO/WO).
Of the 45.472 residents, around 66% are in paid employment, which amounts to 30.012 people. This is 1% higher than the national average of 65%. The majority of workers are in salaried employment (81%), while 19% are self-employed. In Steenwijkerland, 28% of residents receive a benefit. The largest group is those receiving a state pension (AOW). 9.560 people receive this benefit.
In Steenwijkerland there are 20.469 homes with an average assessed value (WOZ) of €309.000. Of these, around 94% are occupied and 6% unoccupied. Most homes are owner-occupied. This amounts to 34% rental homes and 66% owner-occupied homes. Of the homes, 65% privately owned, 26% owned by housing associations and 9% owned by other landlords. The most common construction periods in Steenwijkerland are 1950-1970 (17%) and 1970-1980 (17%).
There are currently no homes for sale in Steenwijkerland. The most recently listed home is De Elzen 14 by Greveling Makelaardij. No homes were sold in Steenwijkerland over the past year.
There are currently no homes for rent in Steenwijkerland. The most recent home is Gasthuisstraat 3B, offered by Makelaardij Middelbrink op Vastgoed Nederland. No homes were let in Steenwijkerland over the past year.
No recent rental data available for Steenwijkerland.
In Steenwijkerland there are 21.555 addresses with a registered energy label. The most common labels are C (24%), A (22%) and B (17%). On average, an address in Steenwijkerland uses 2.810 kWh of electricity per year. This is in line with the national average. With an annual consumption of 1.220 m³ per address, natural gas consumption is 5% below the national average of 1.280 m³.

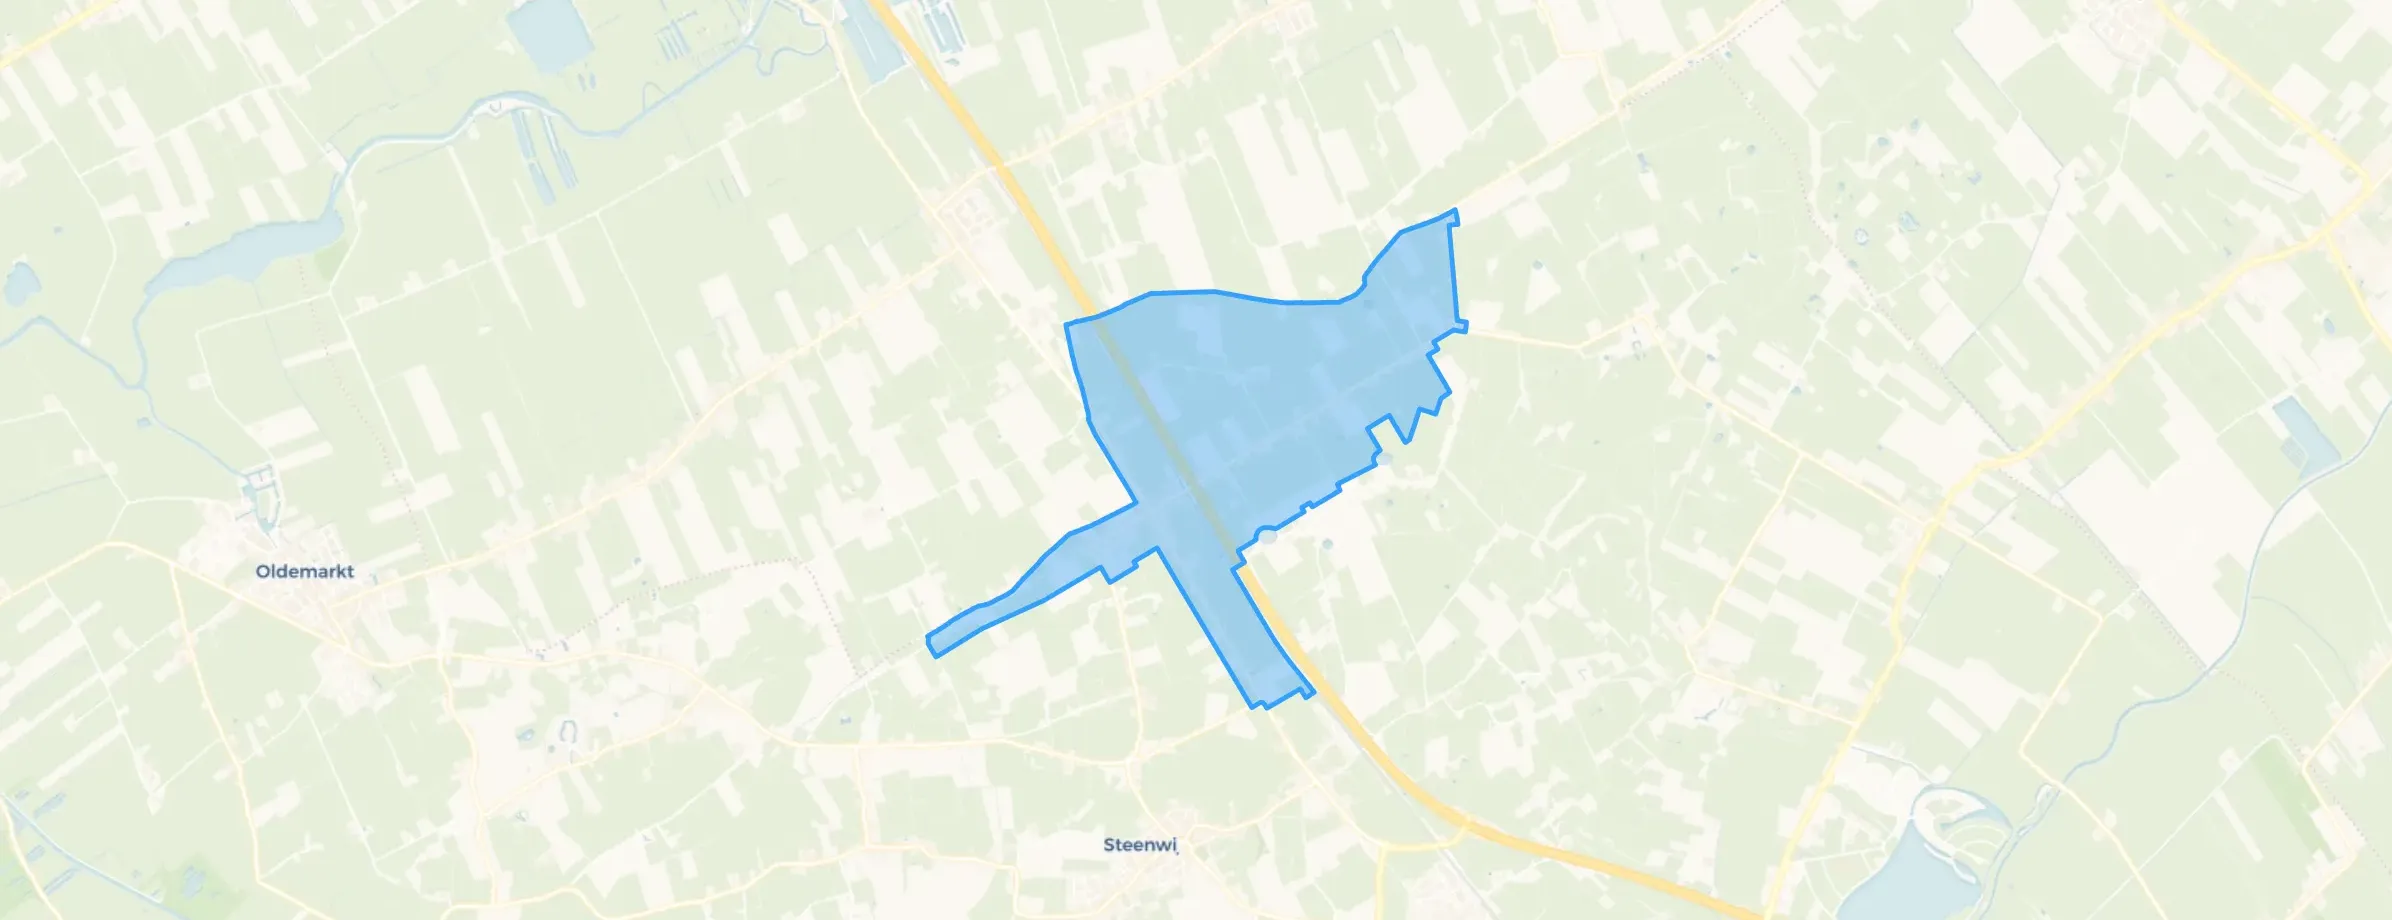
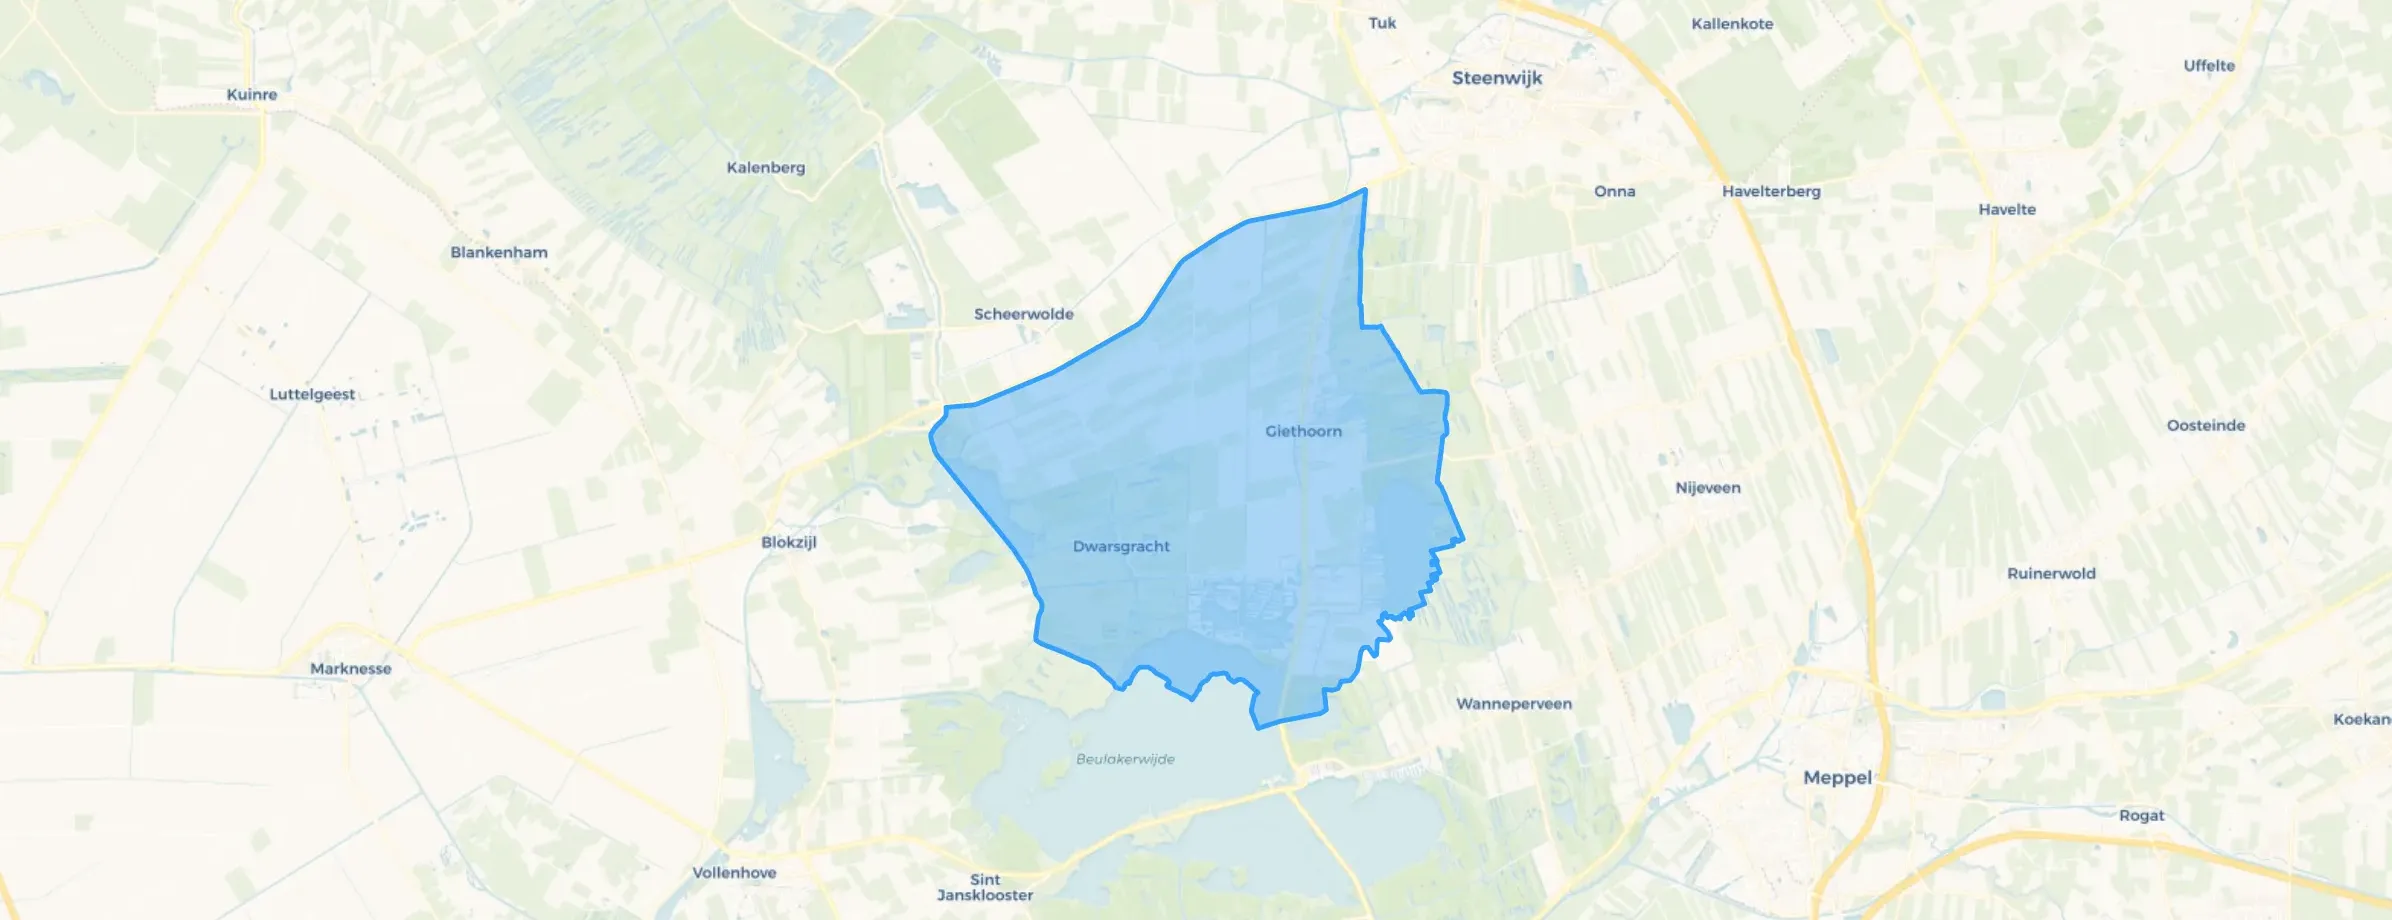
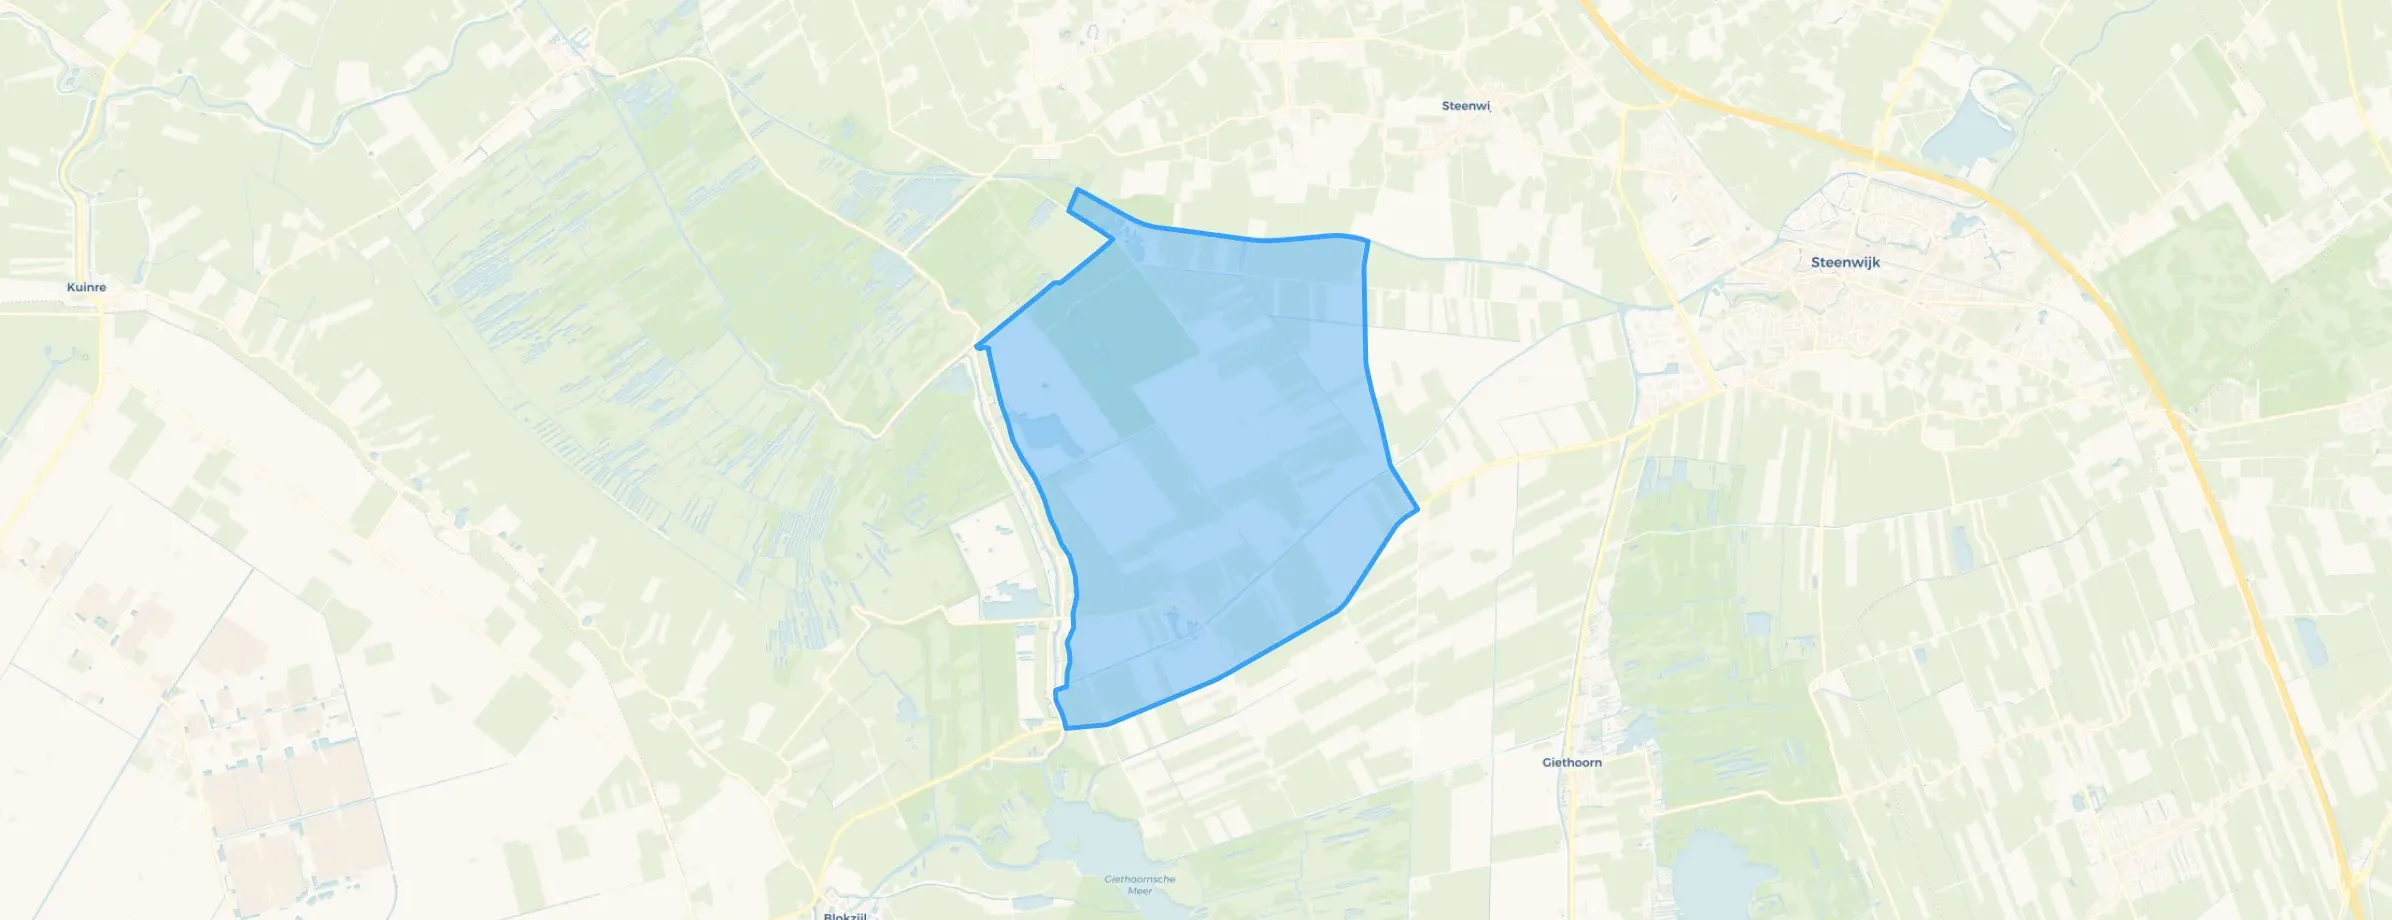

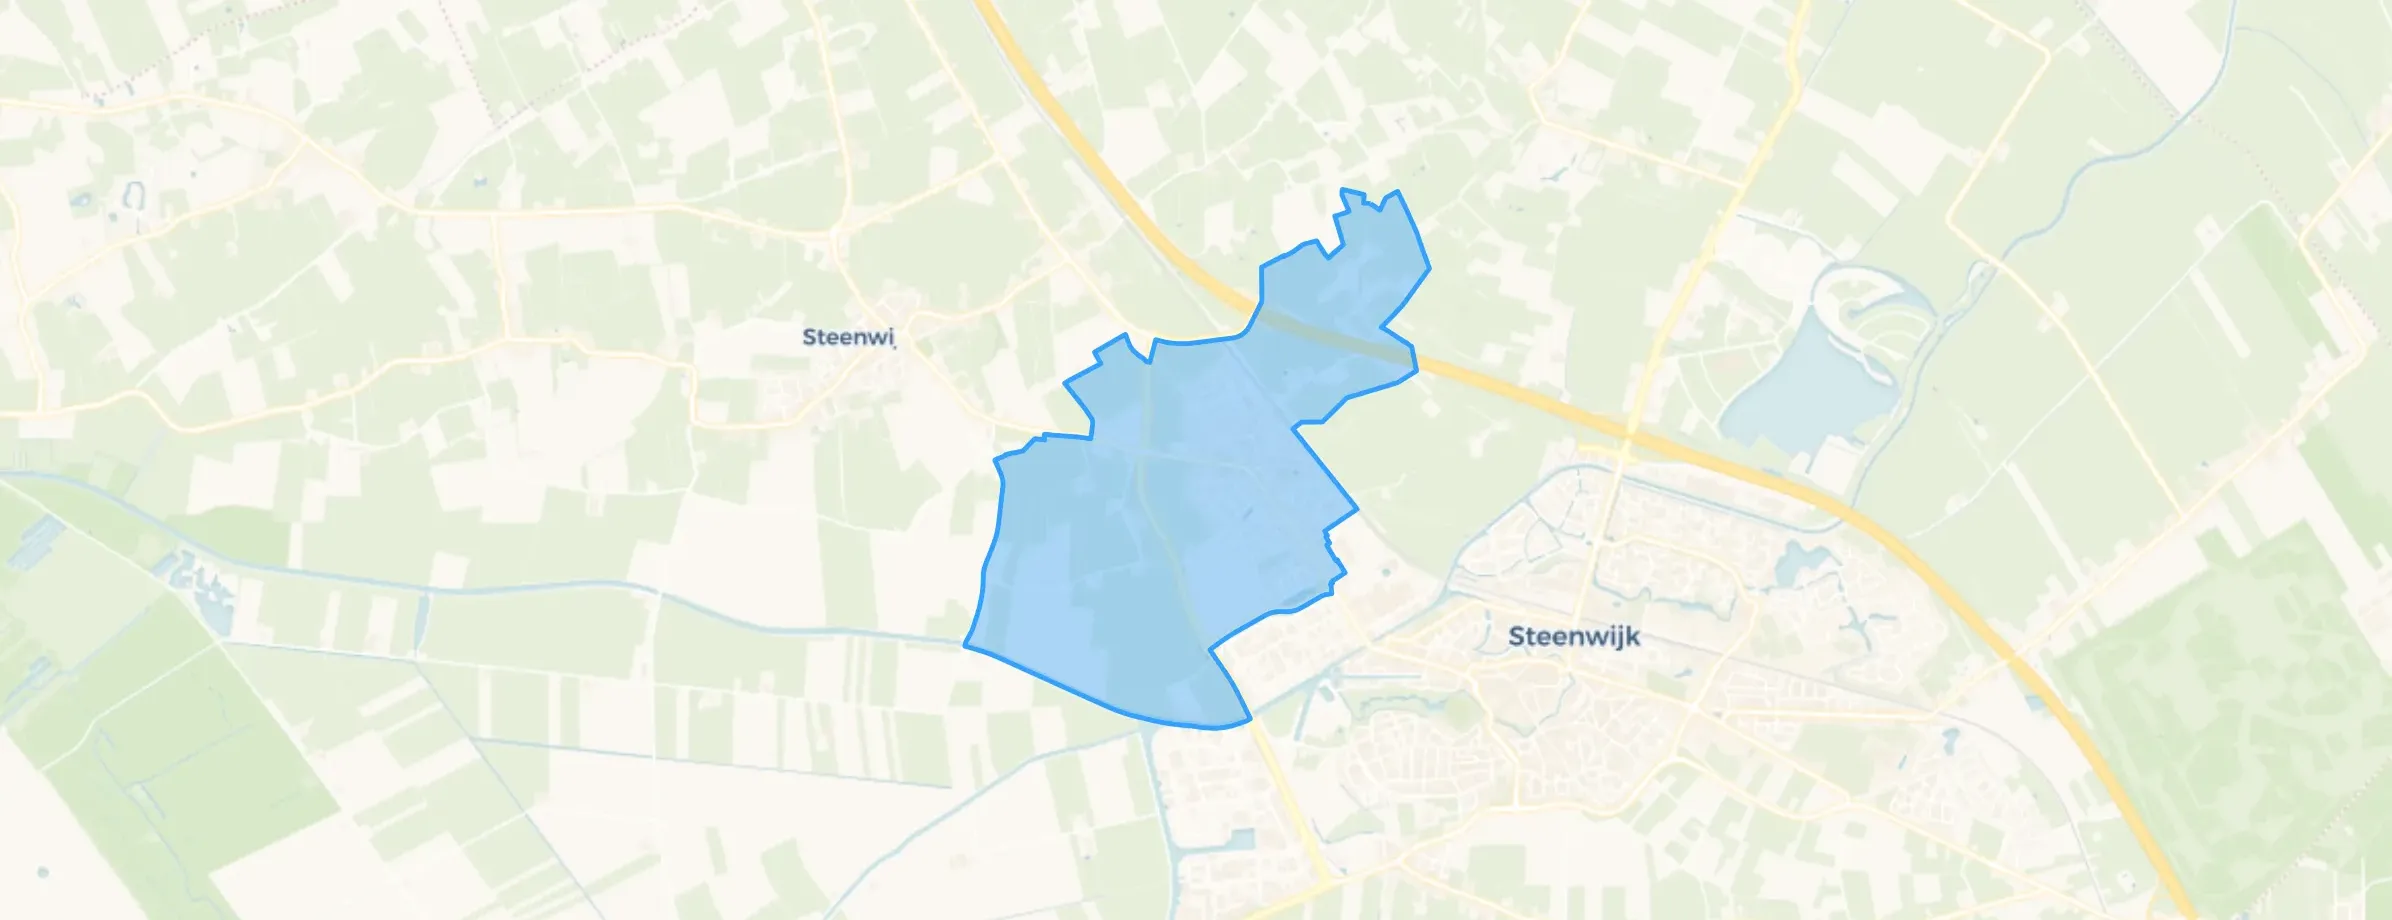
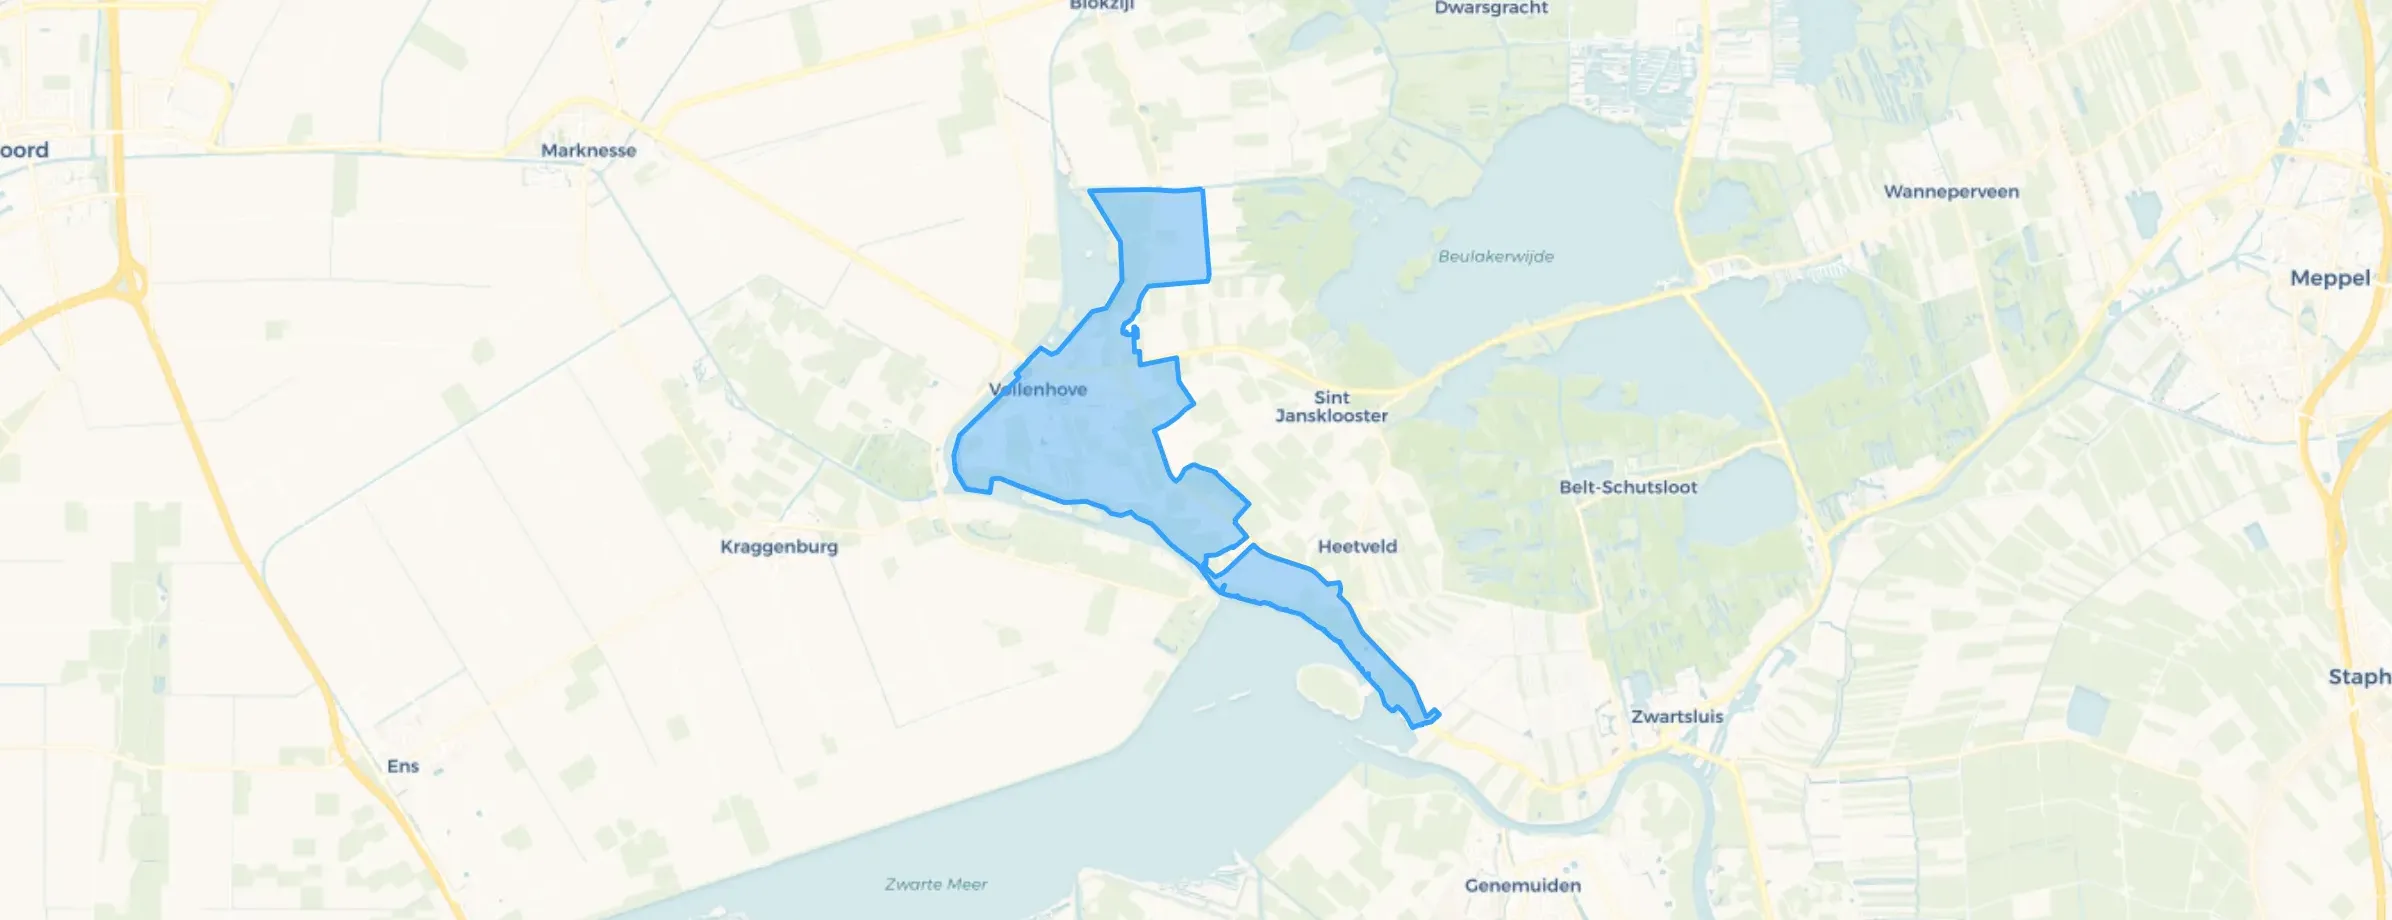
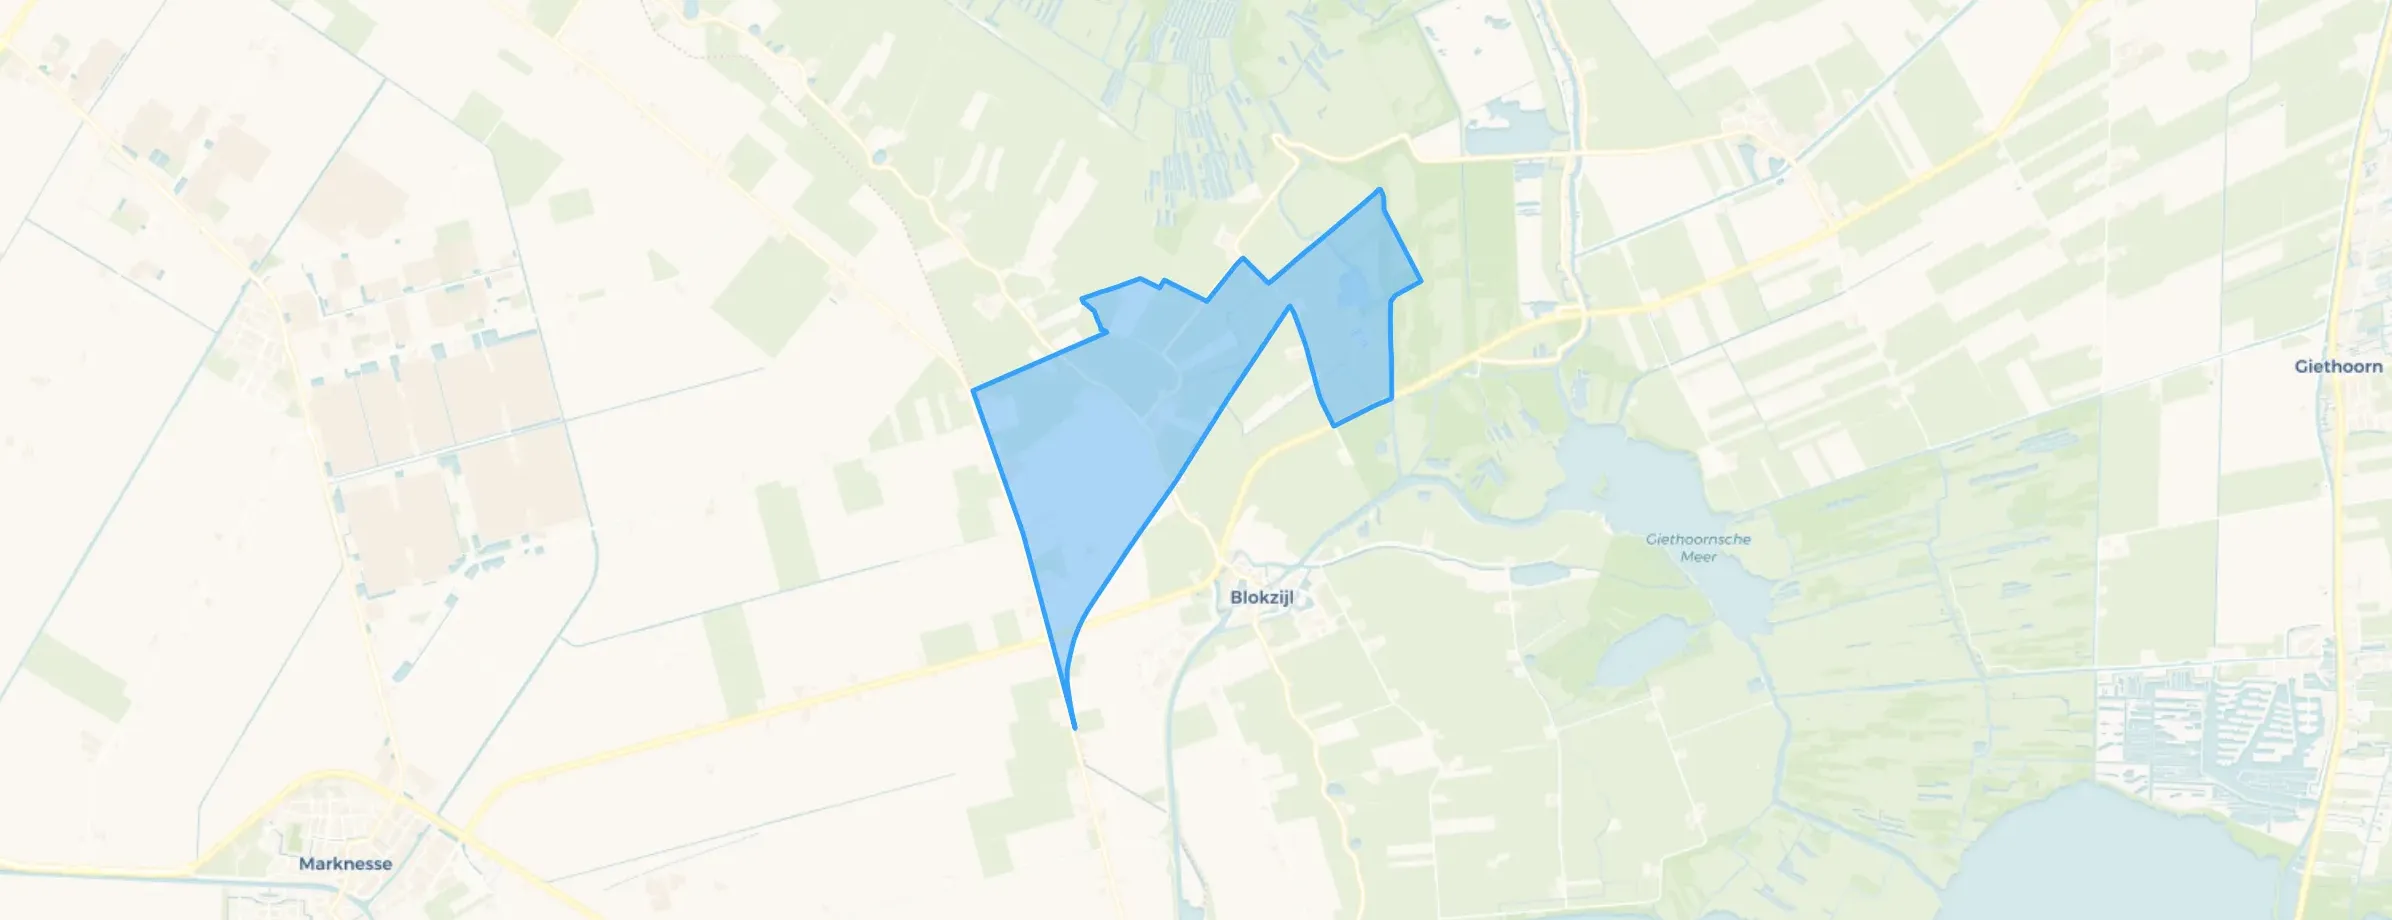
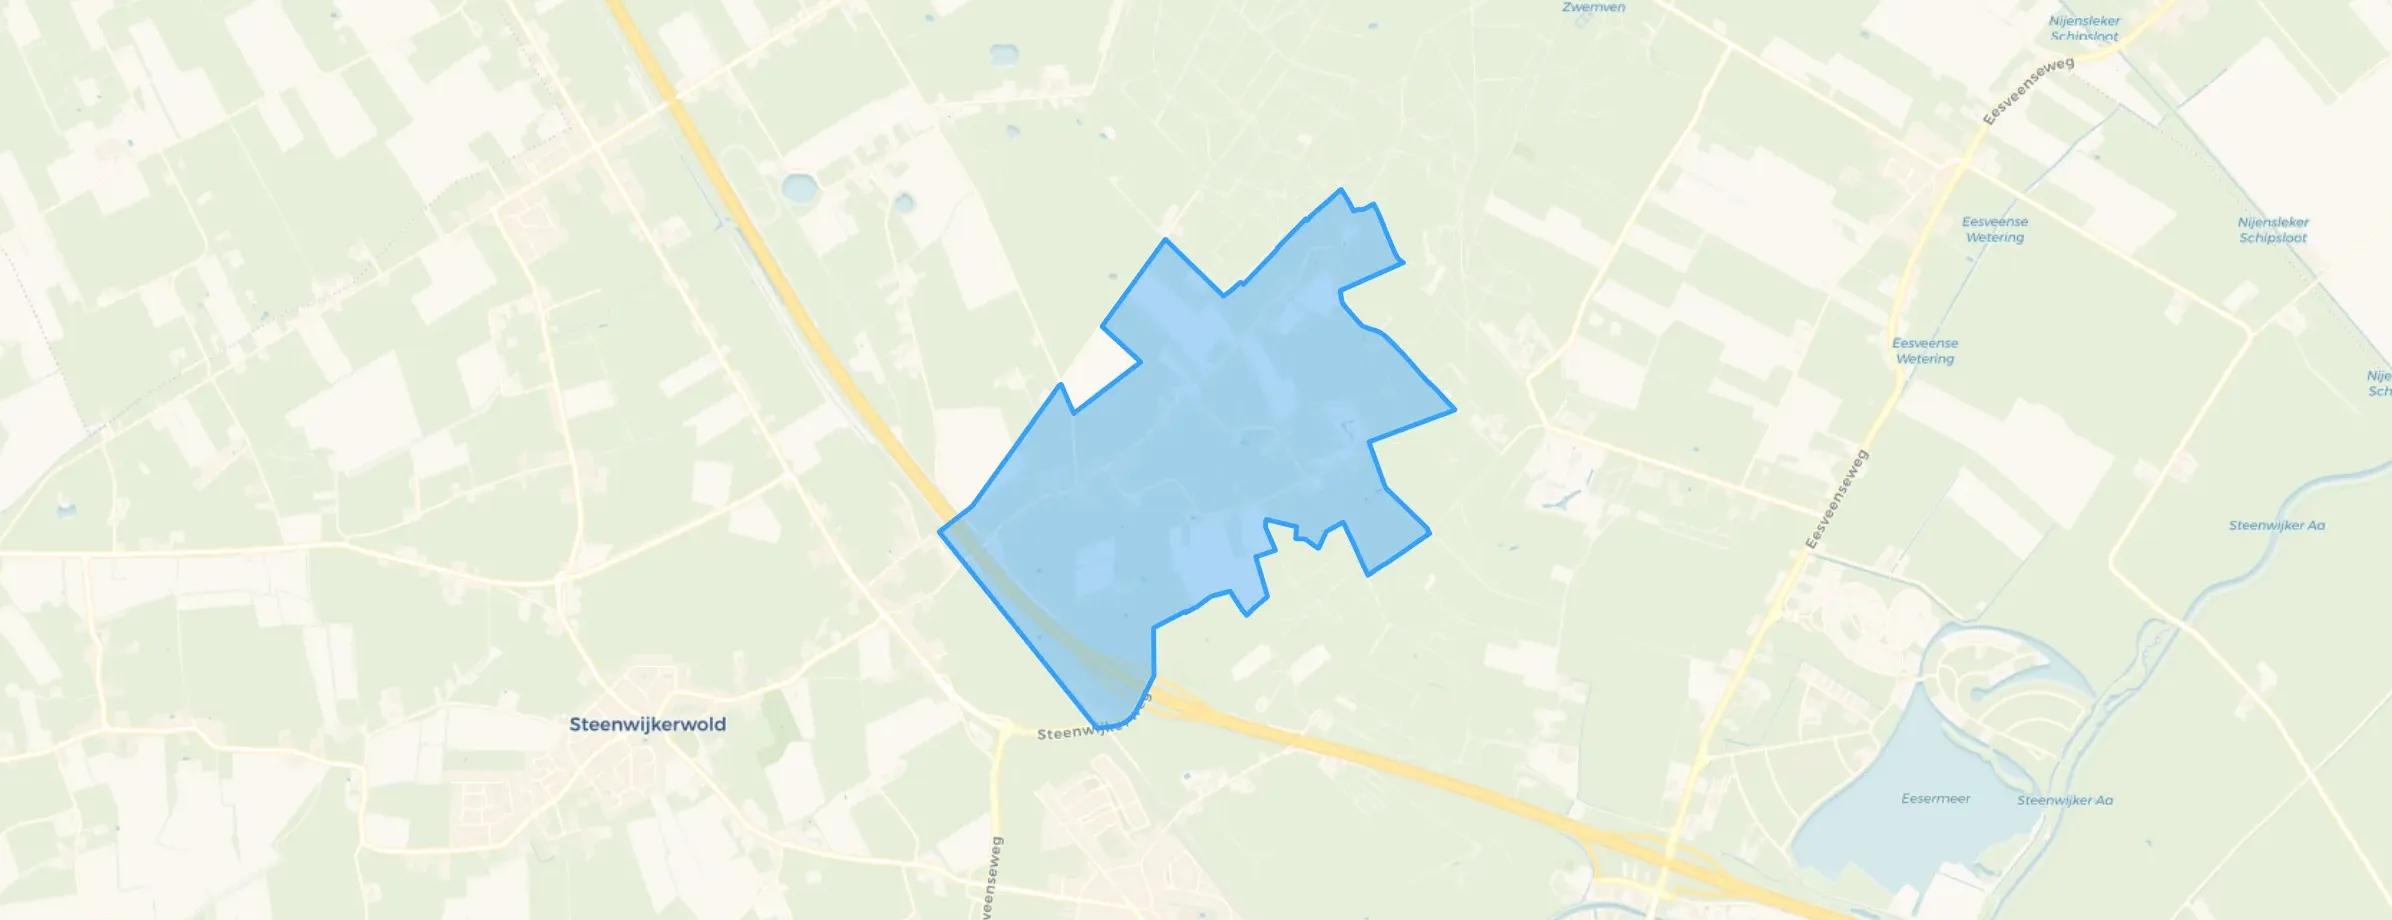
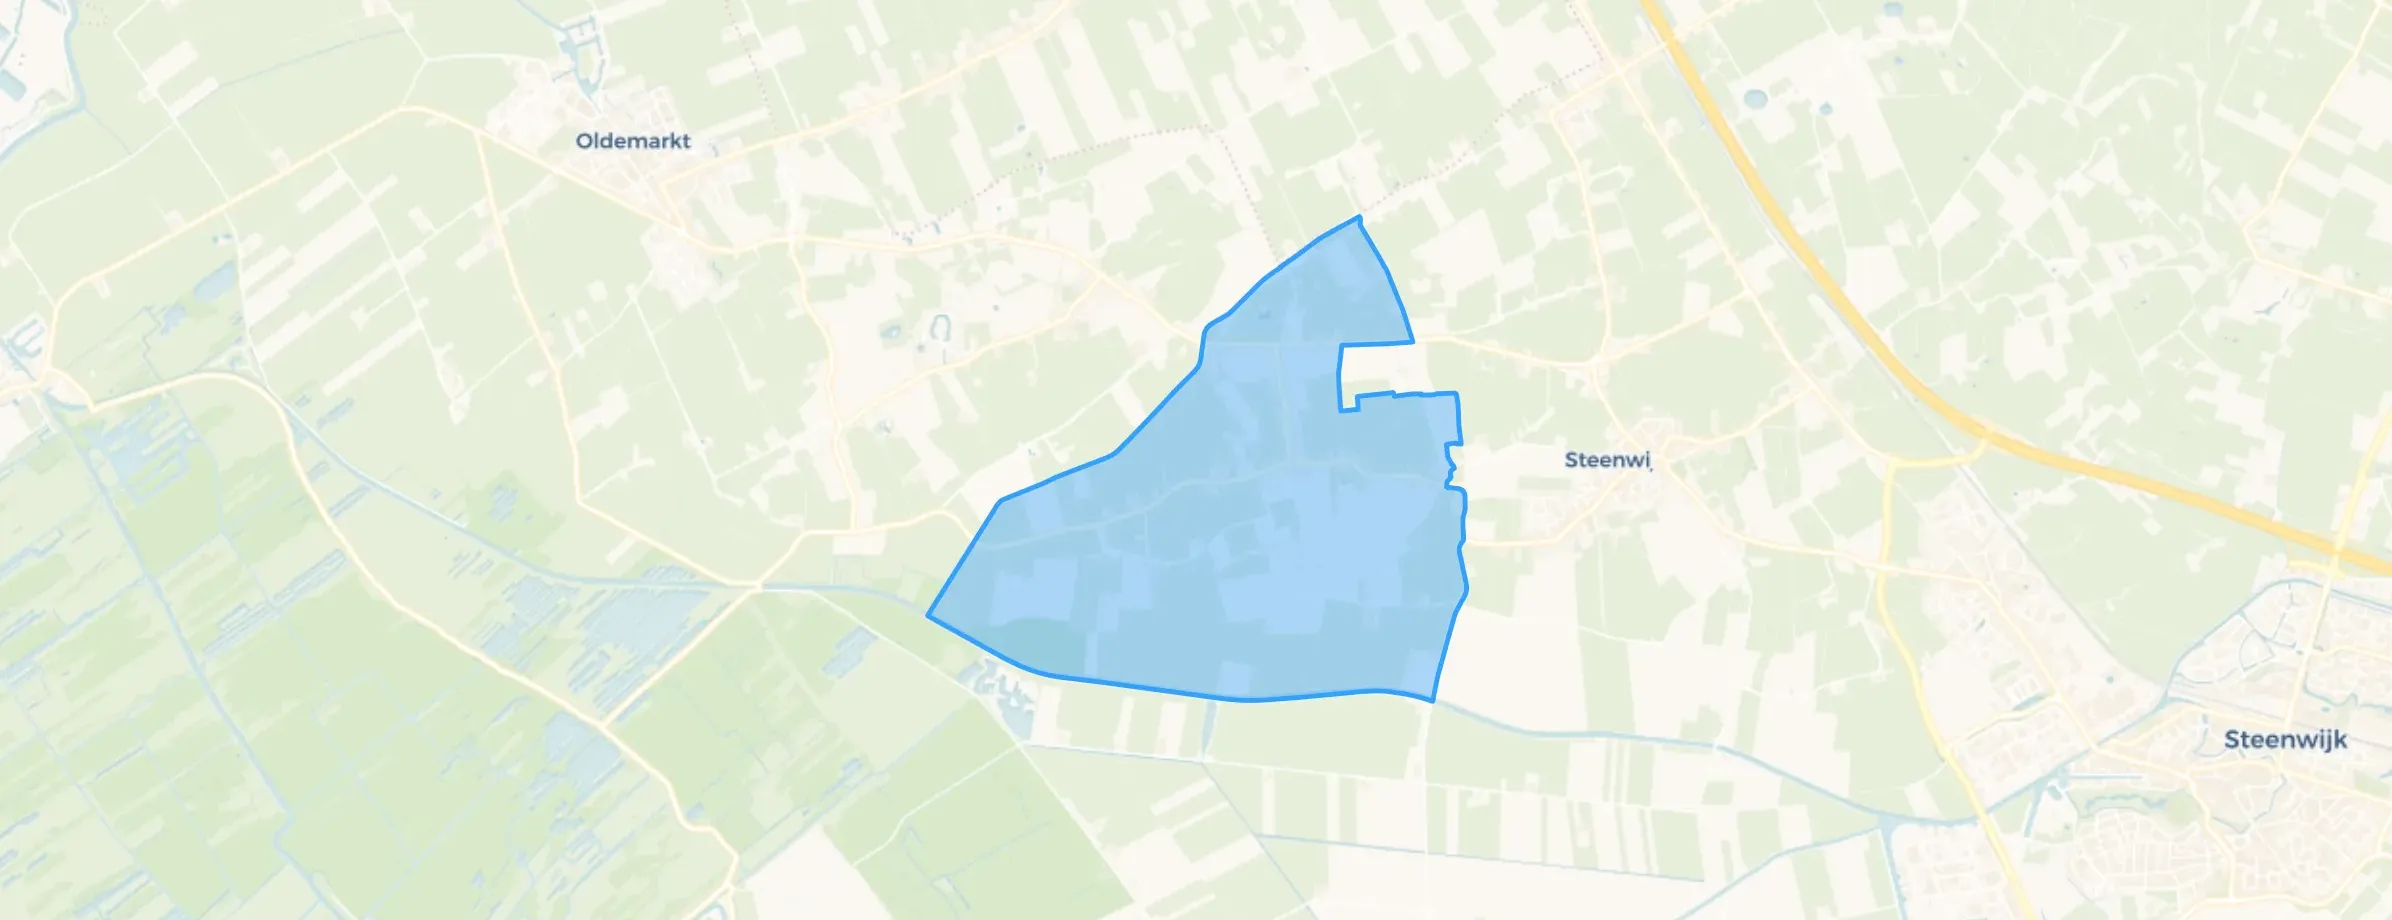
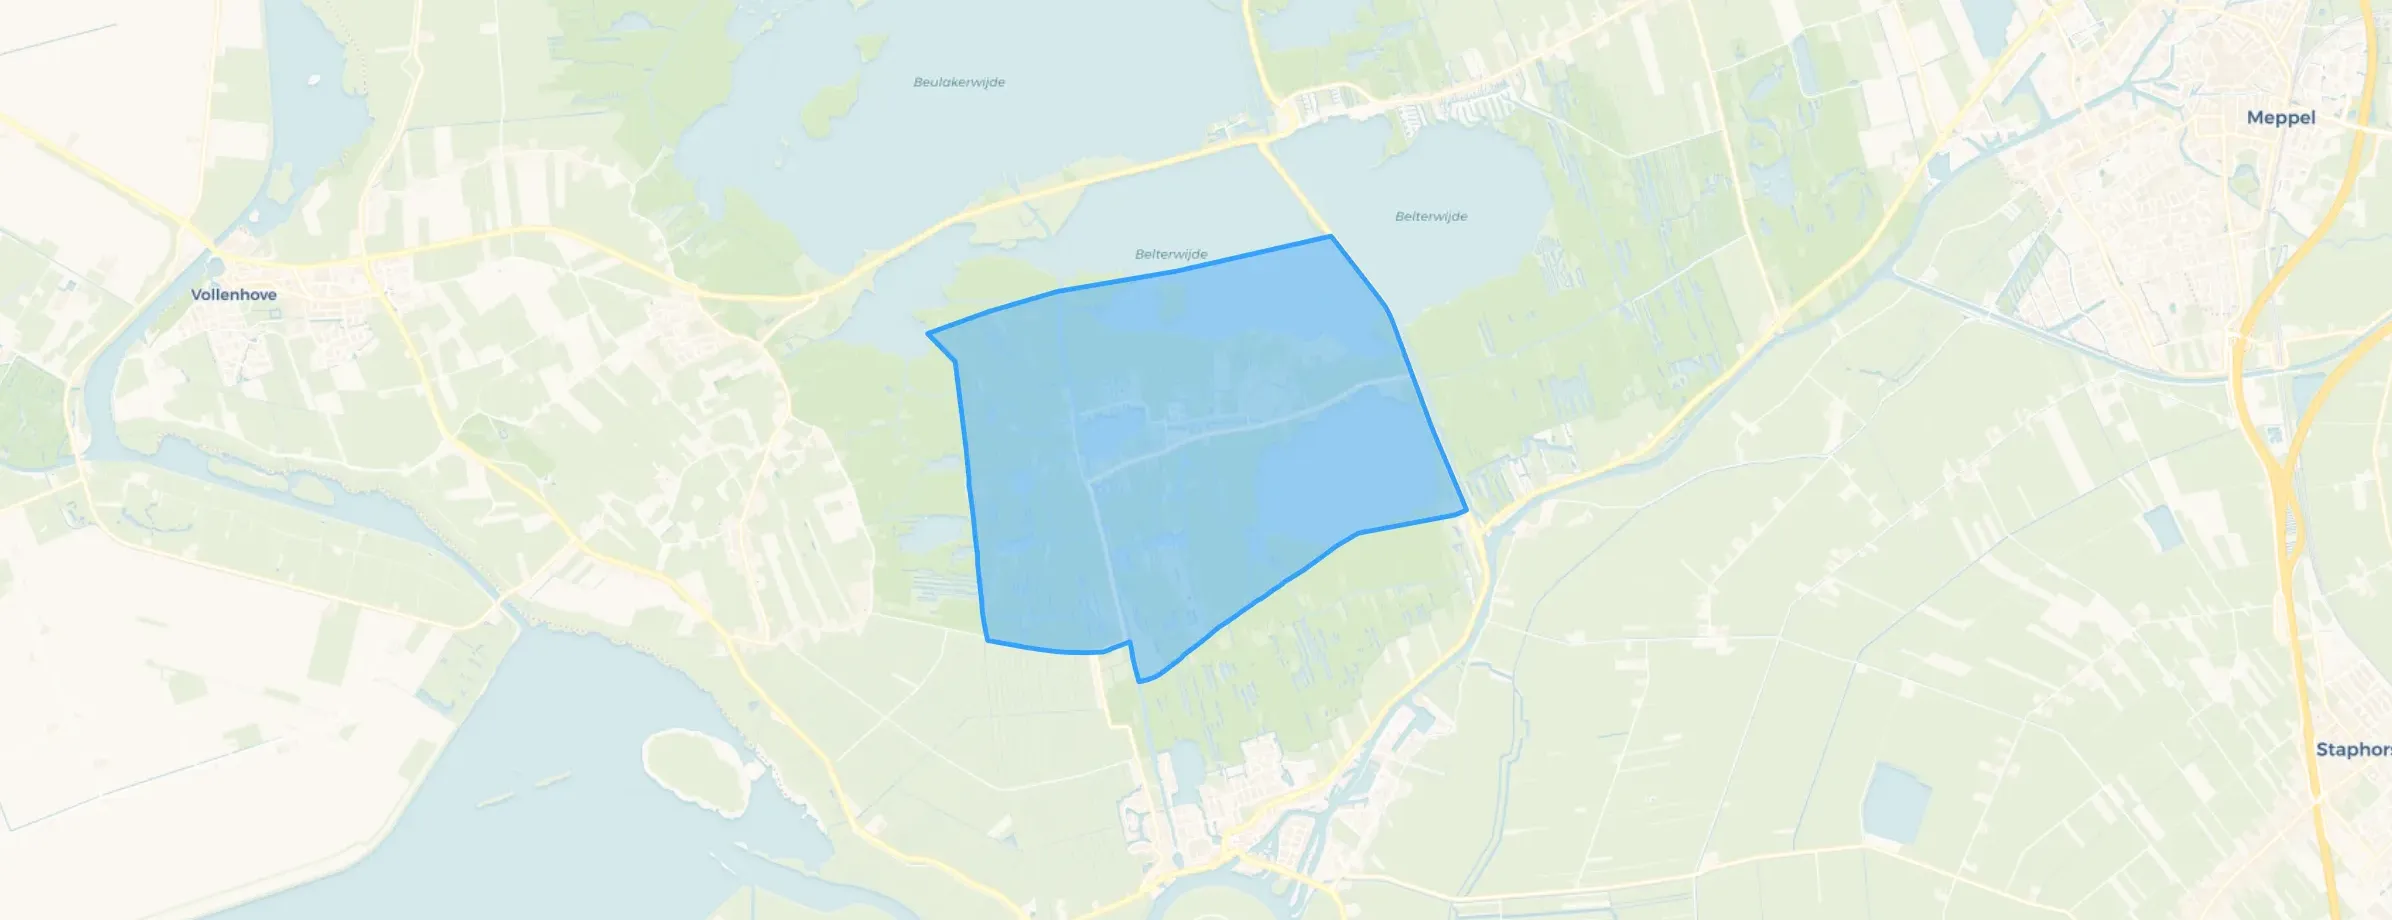
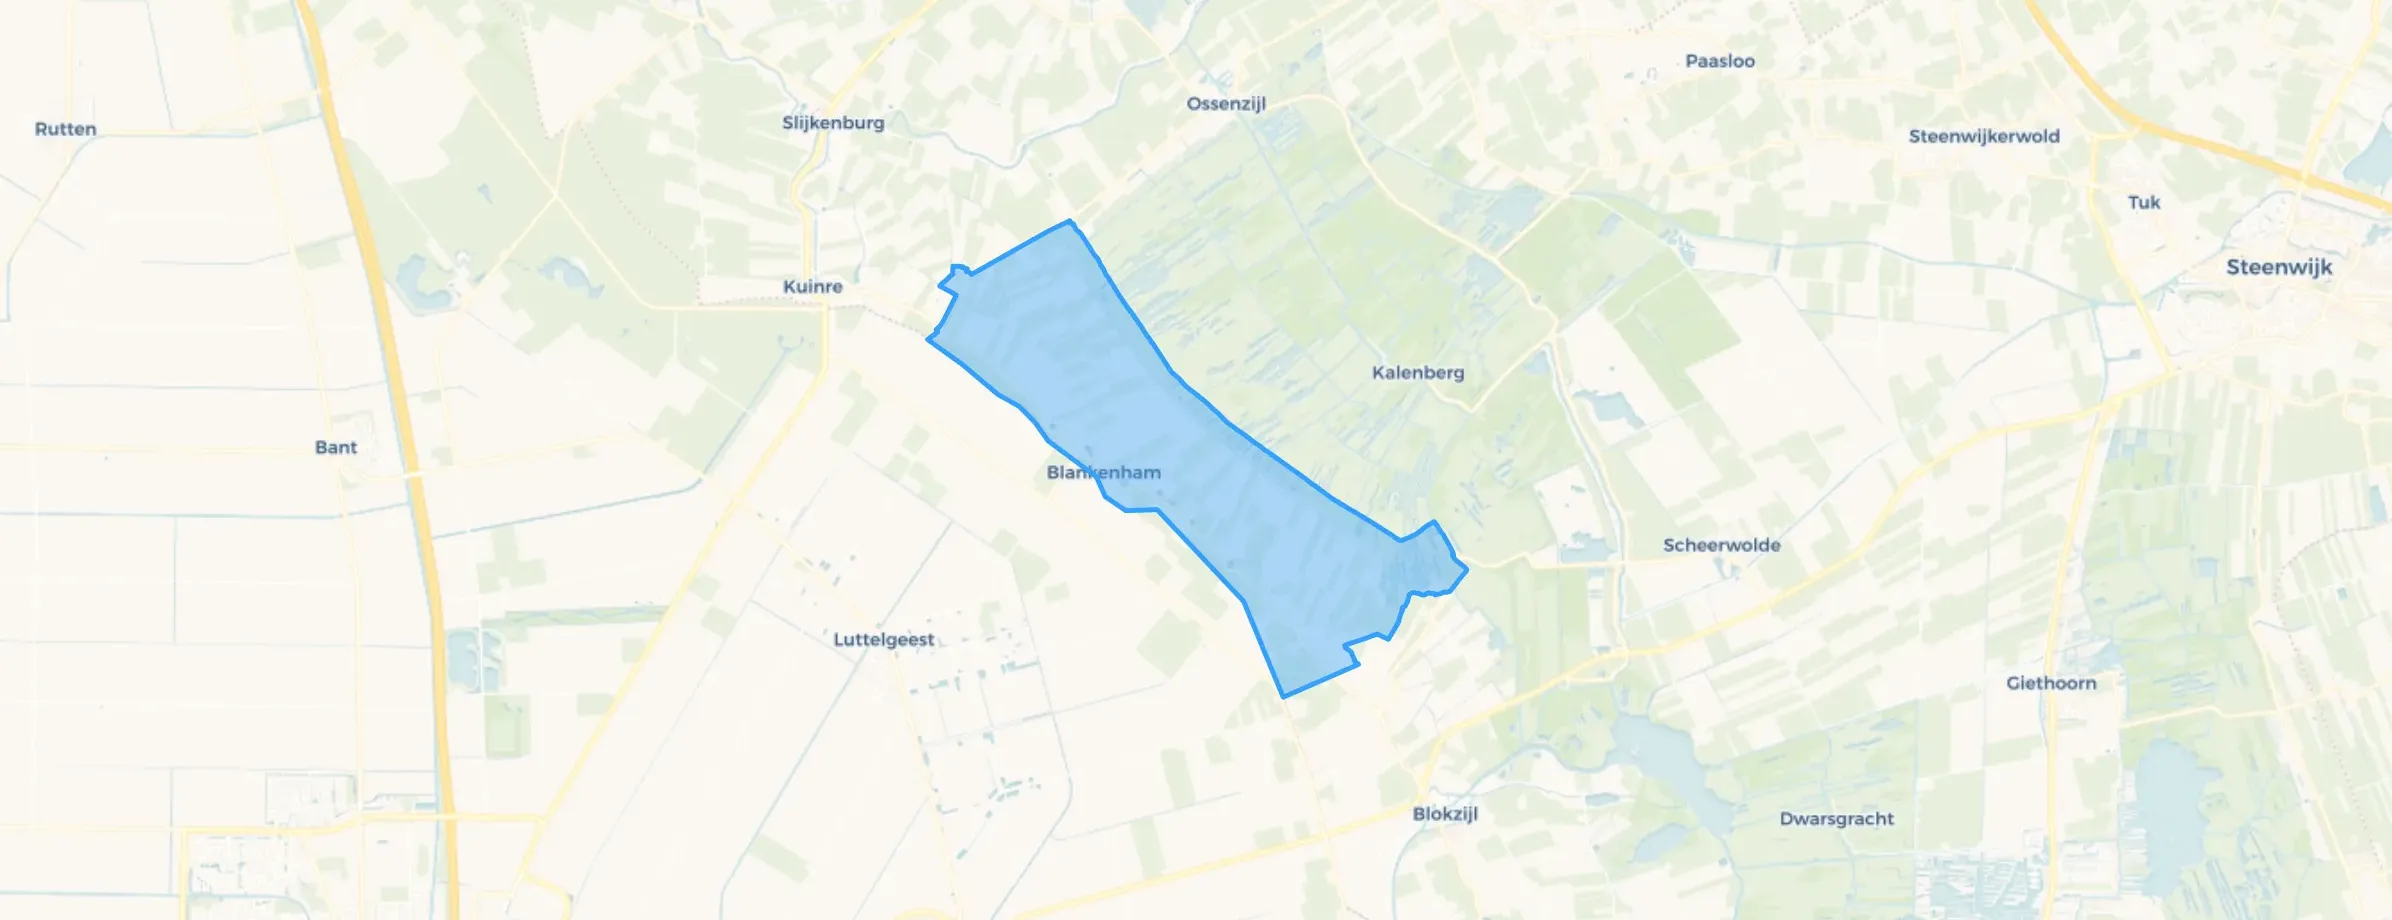
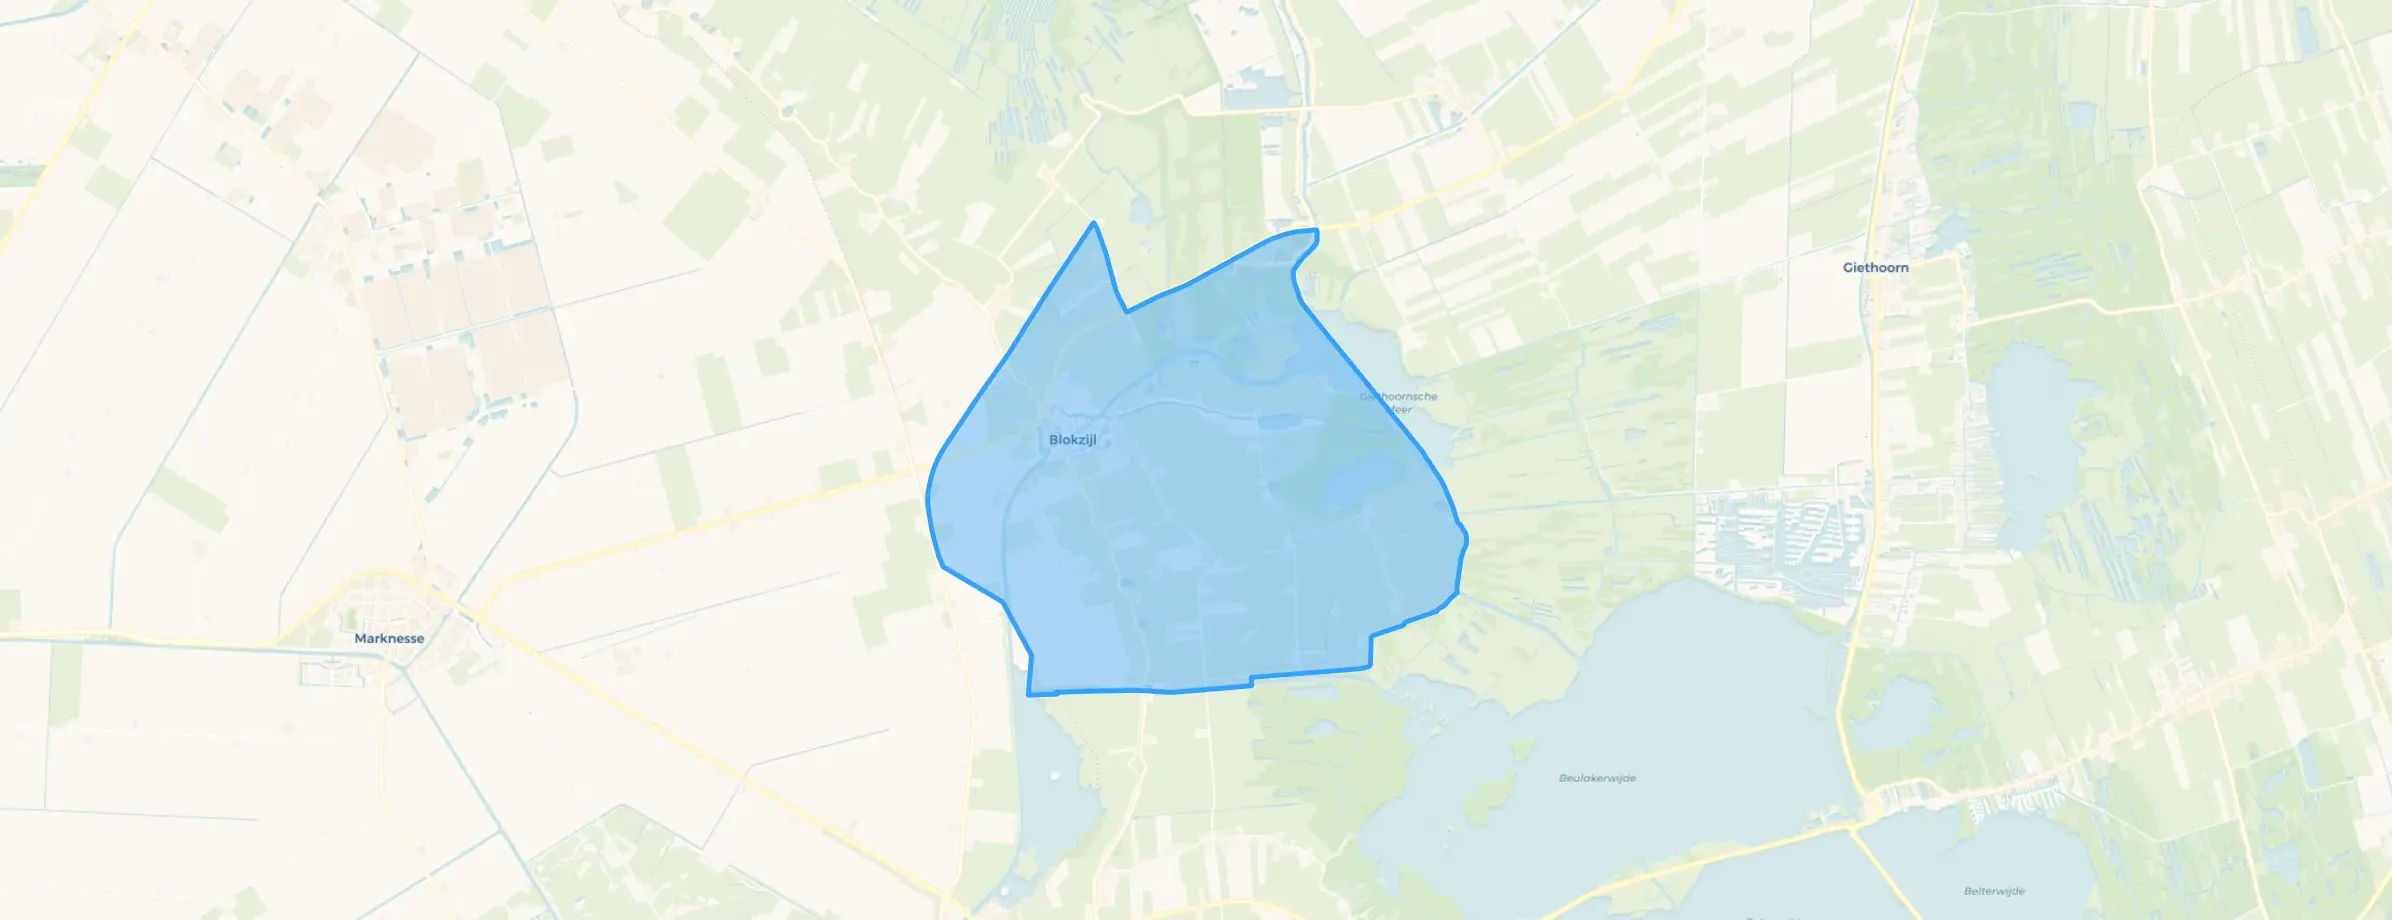

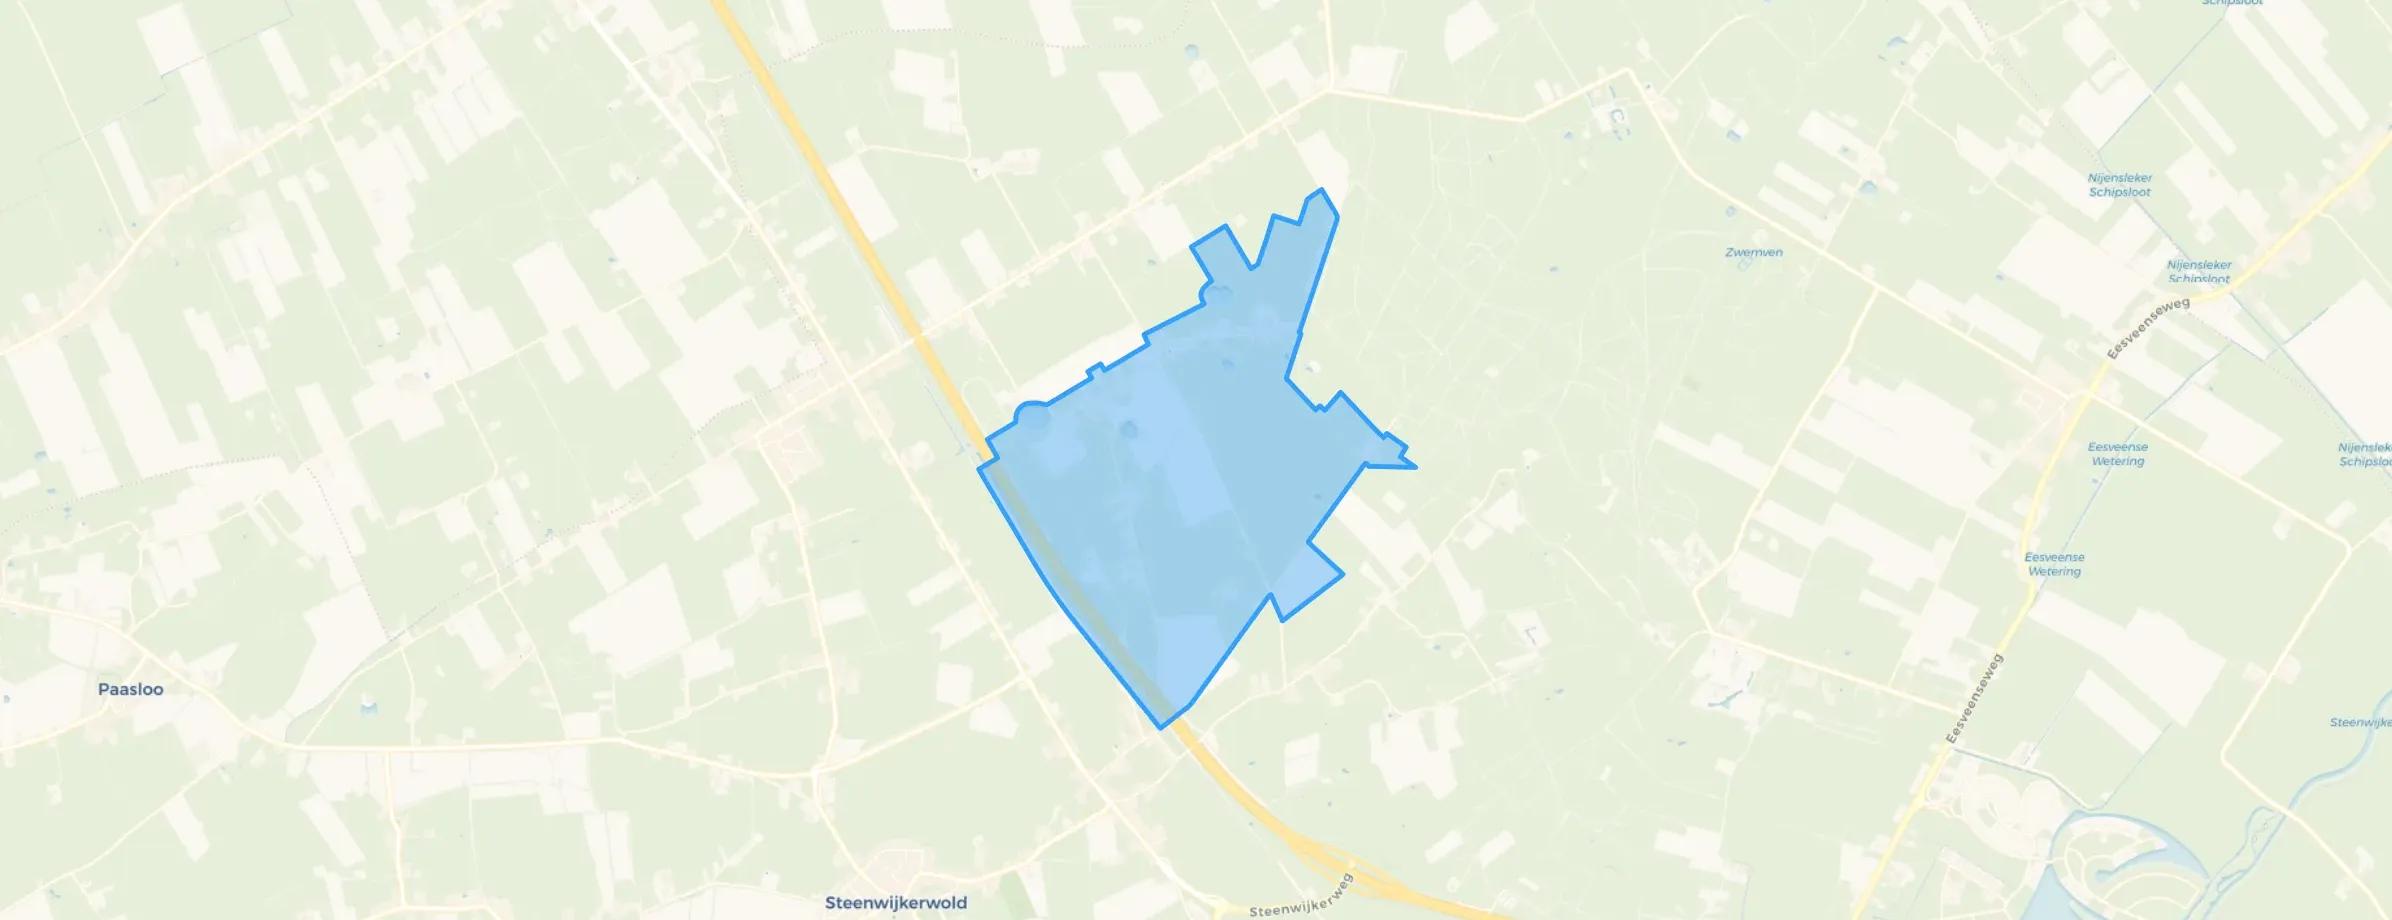
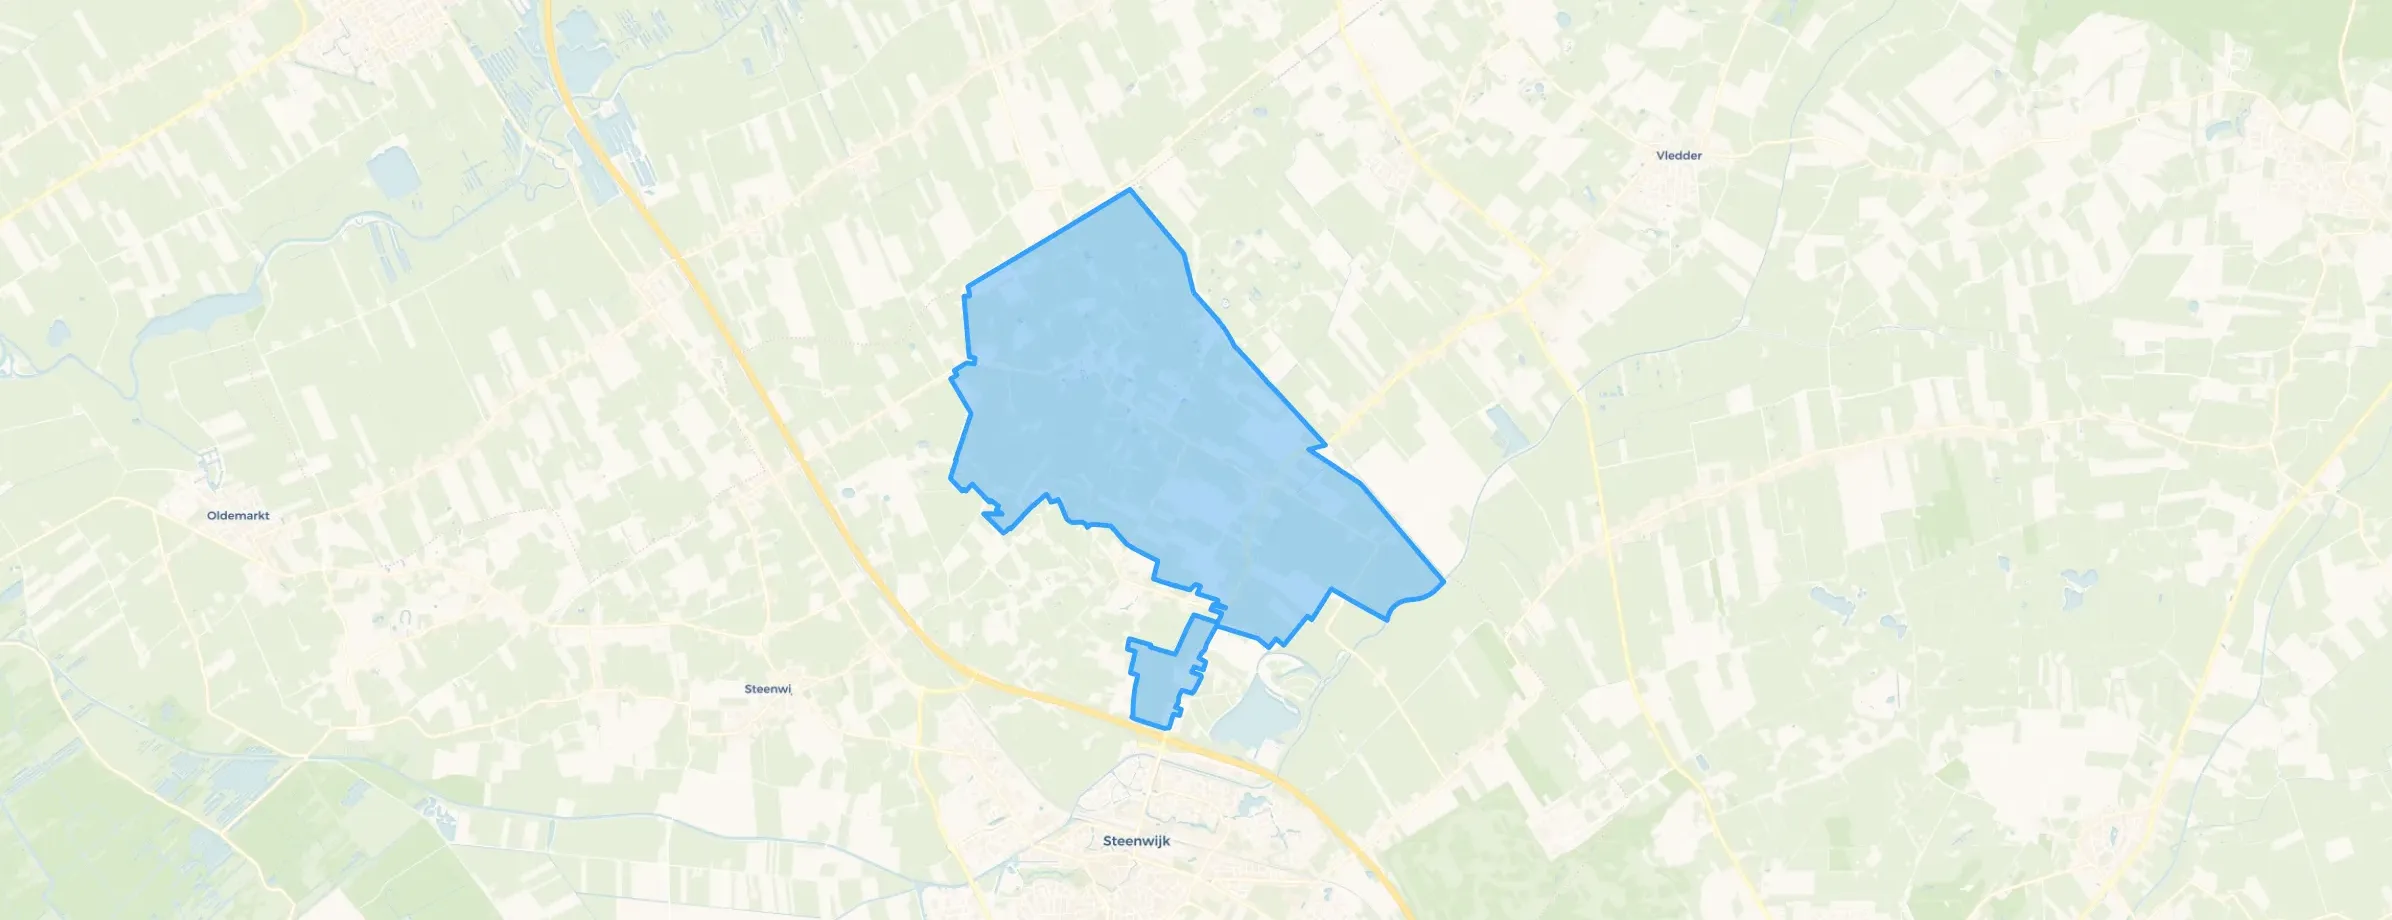
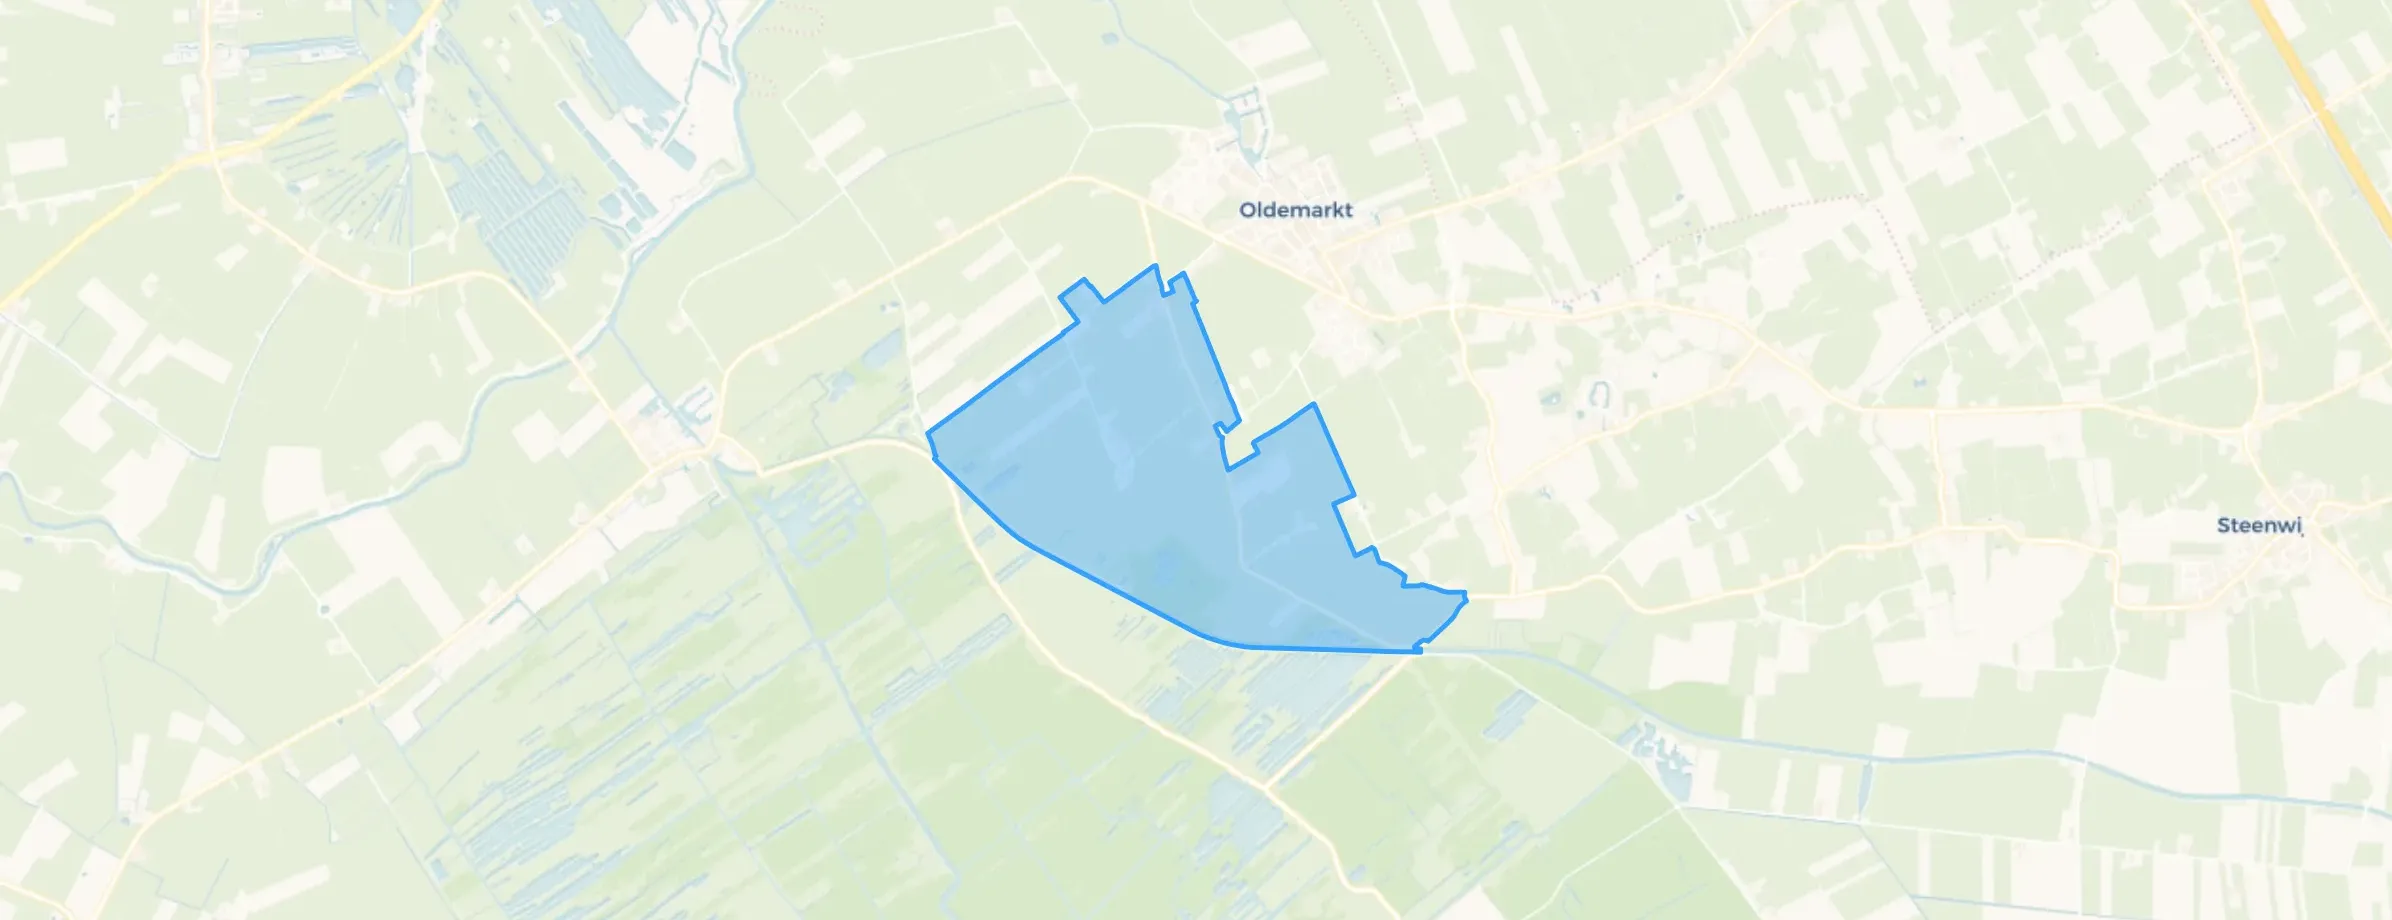
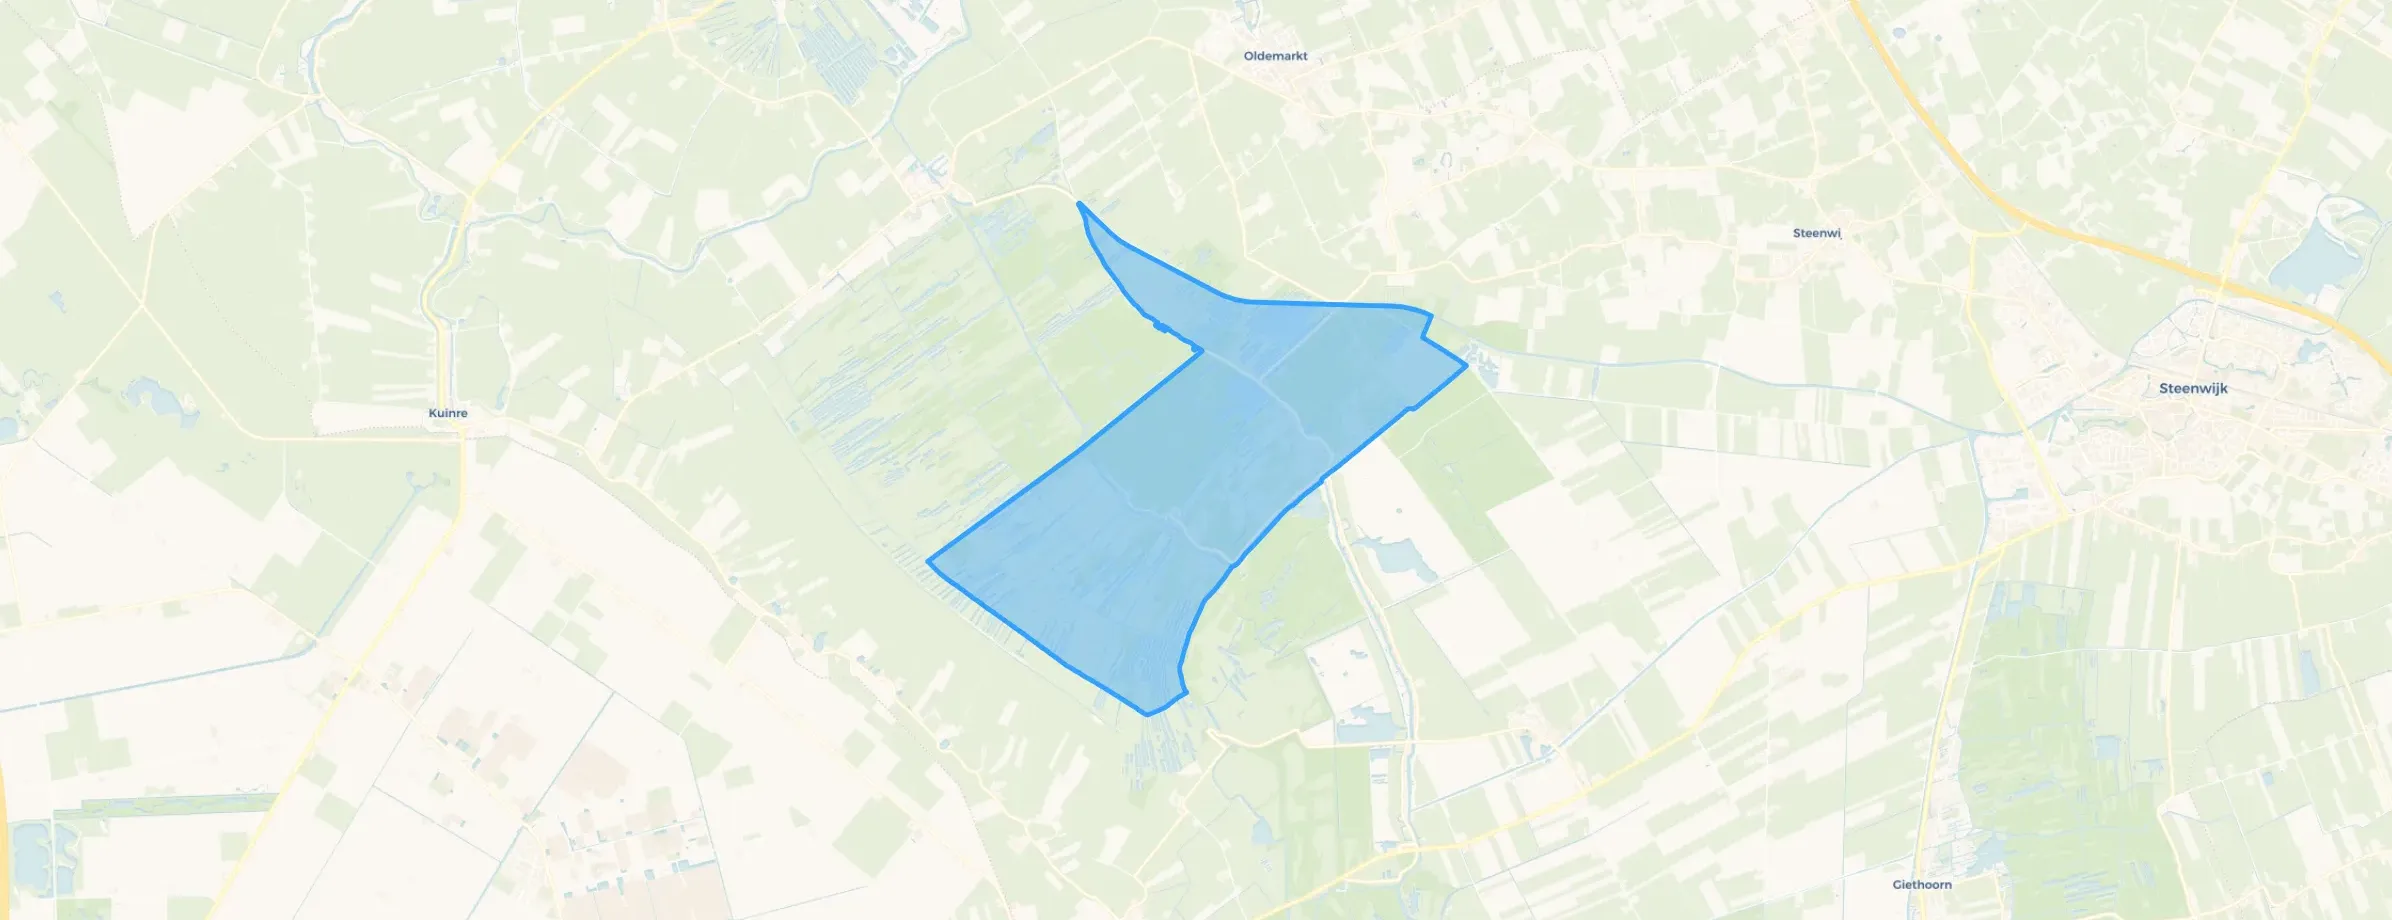
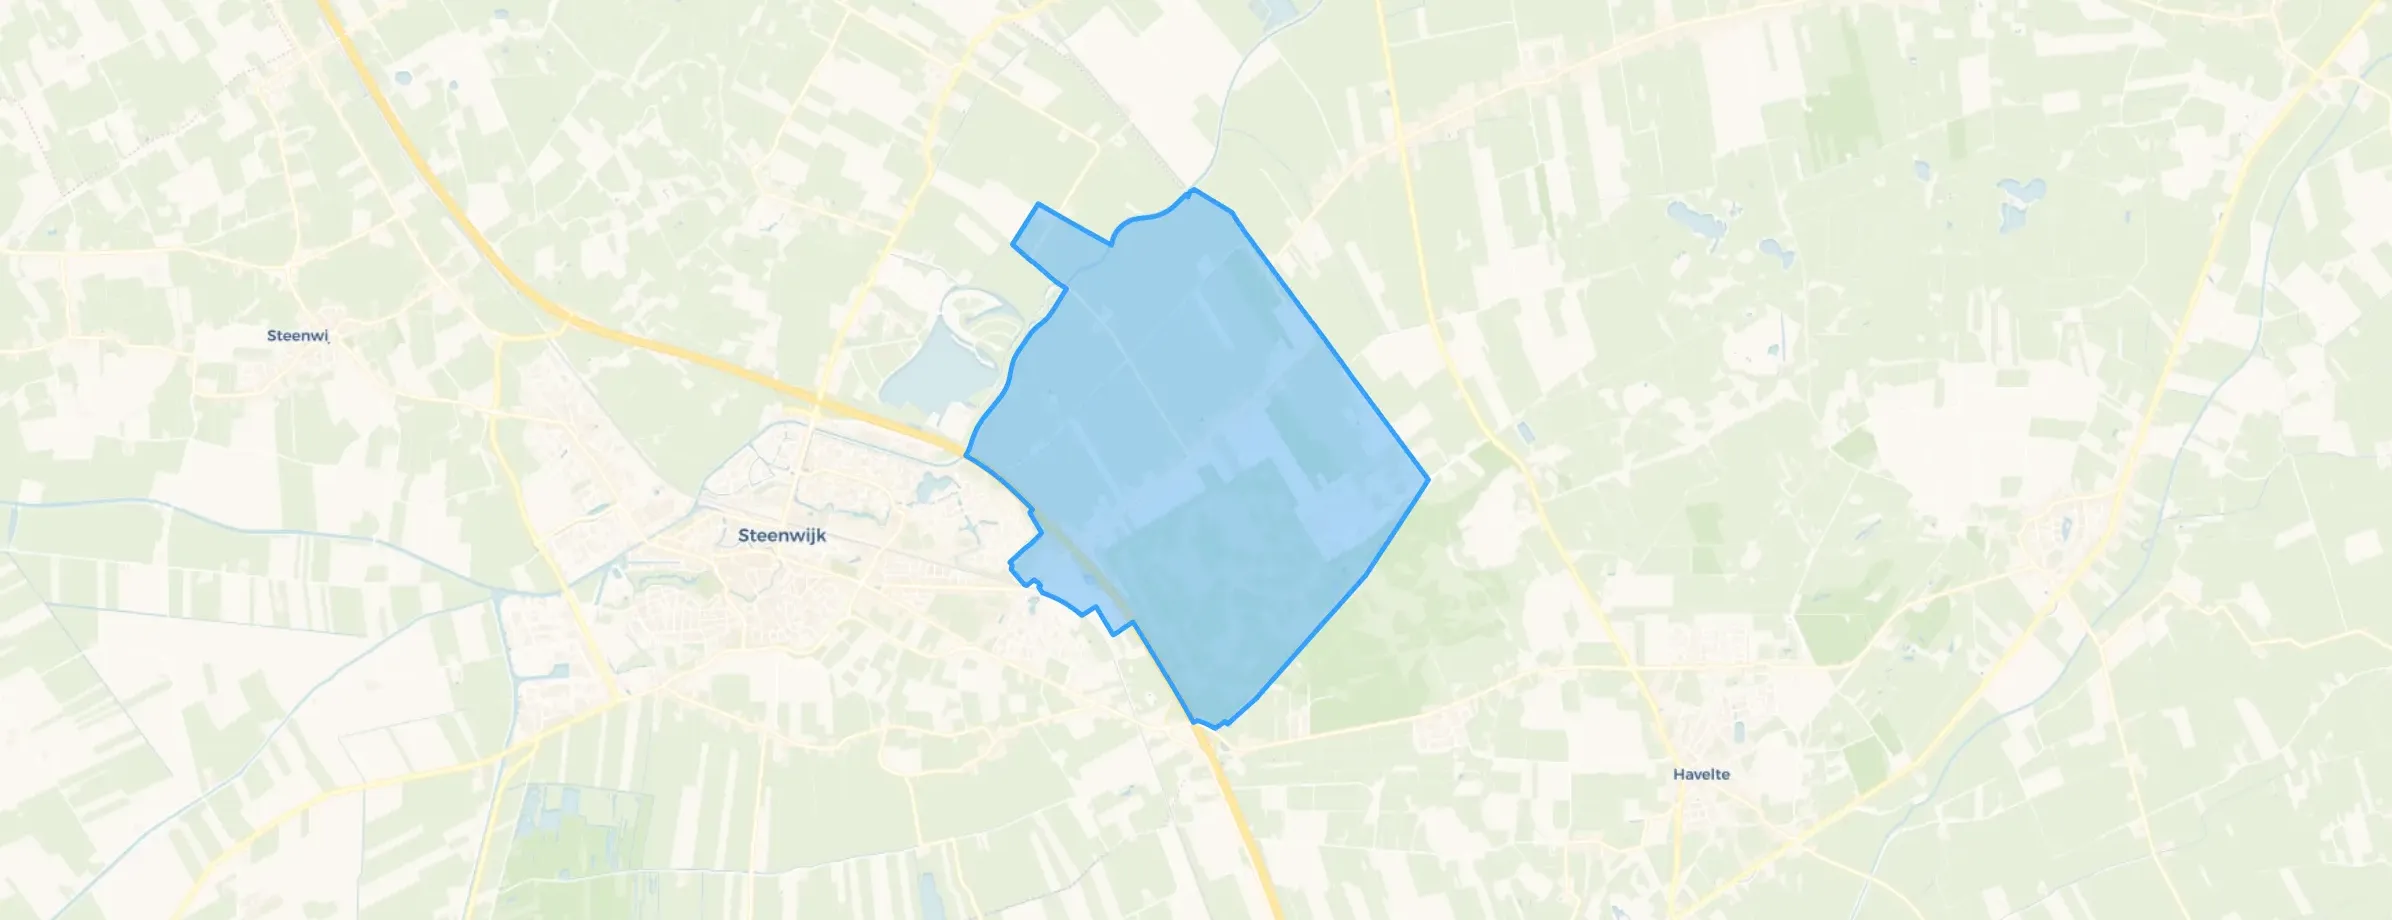
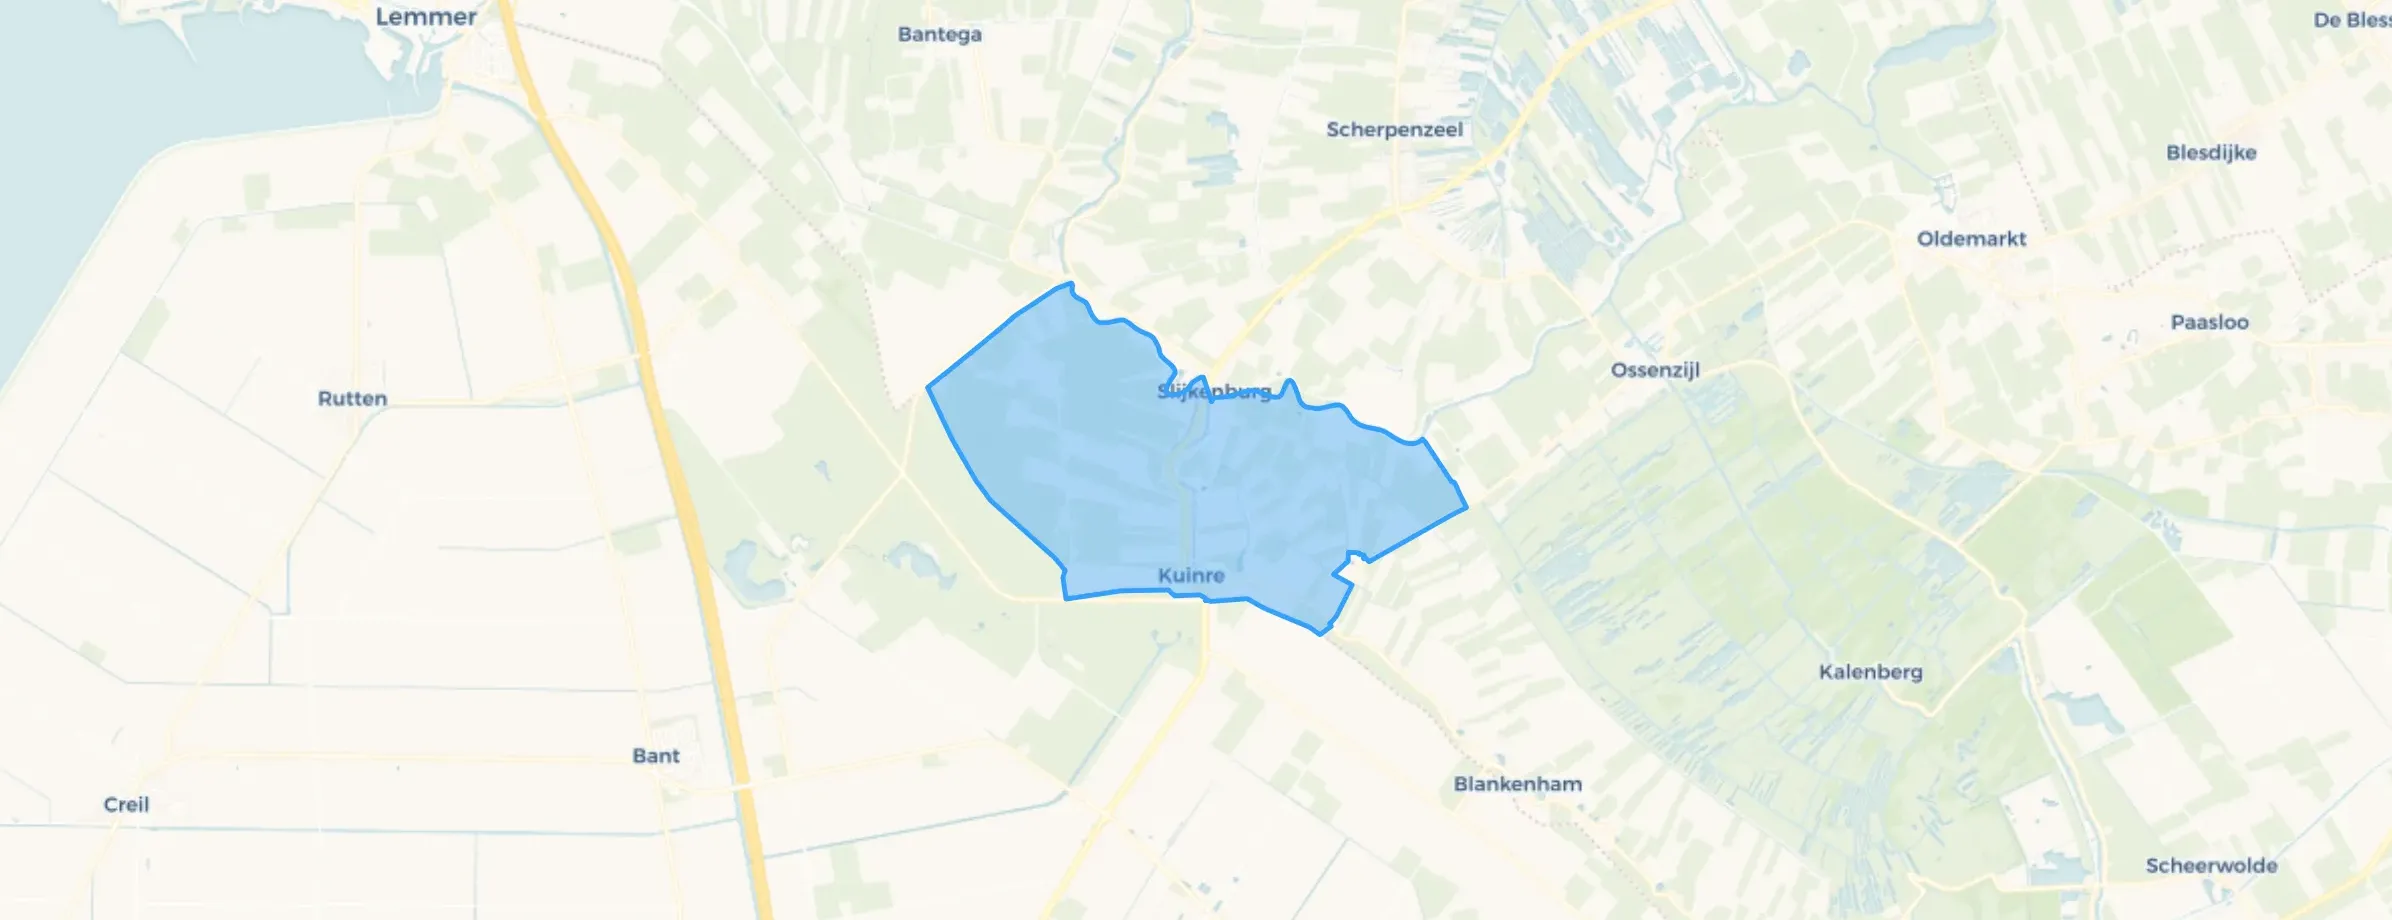
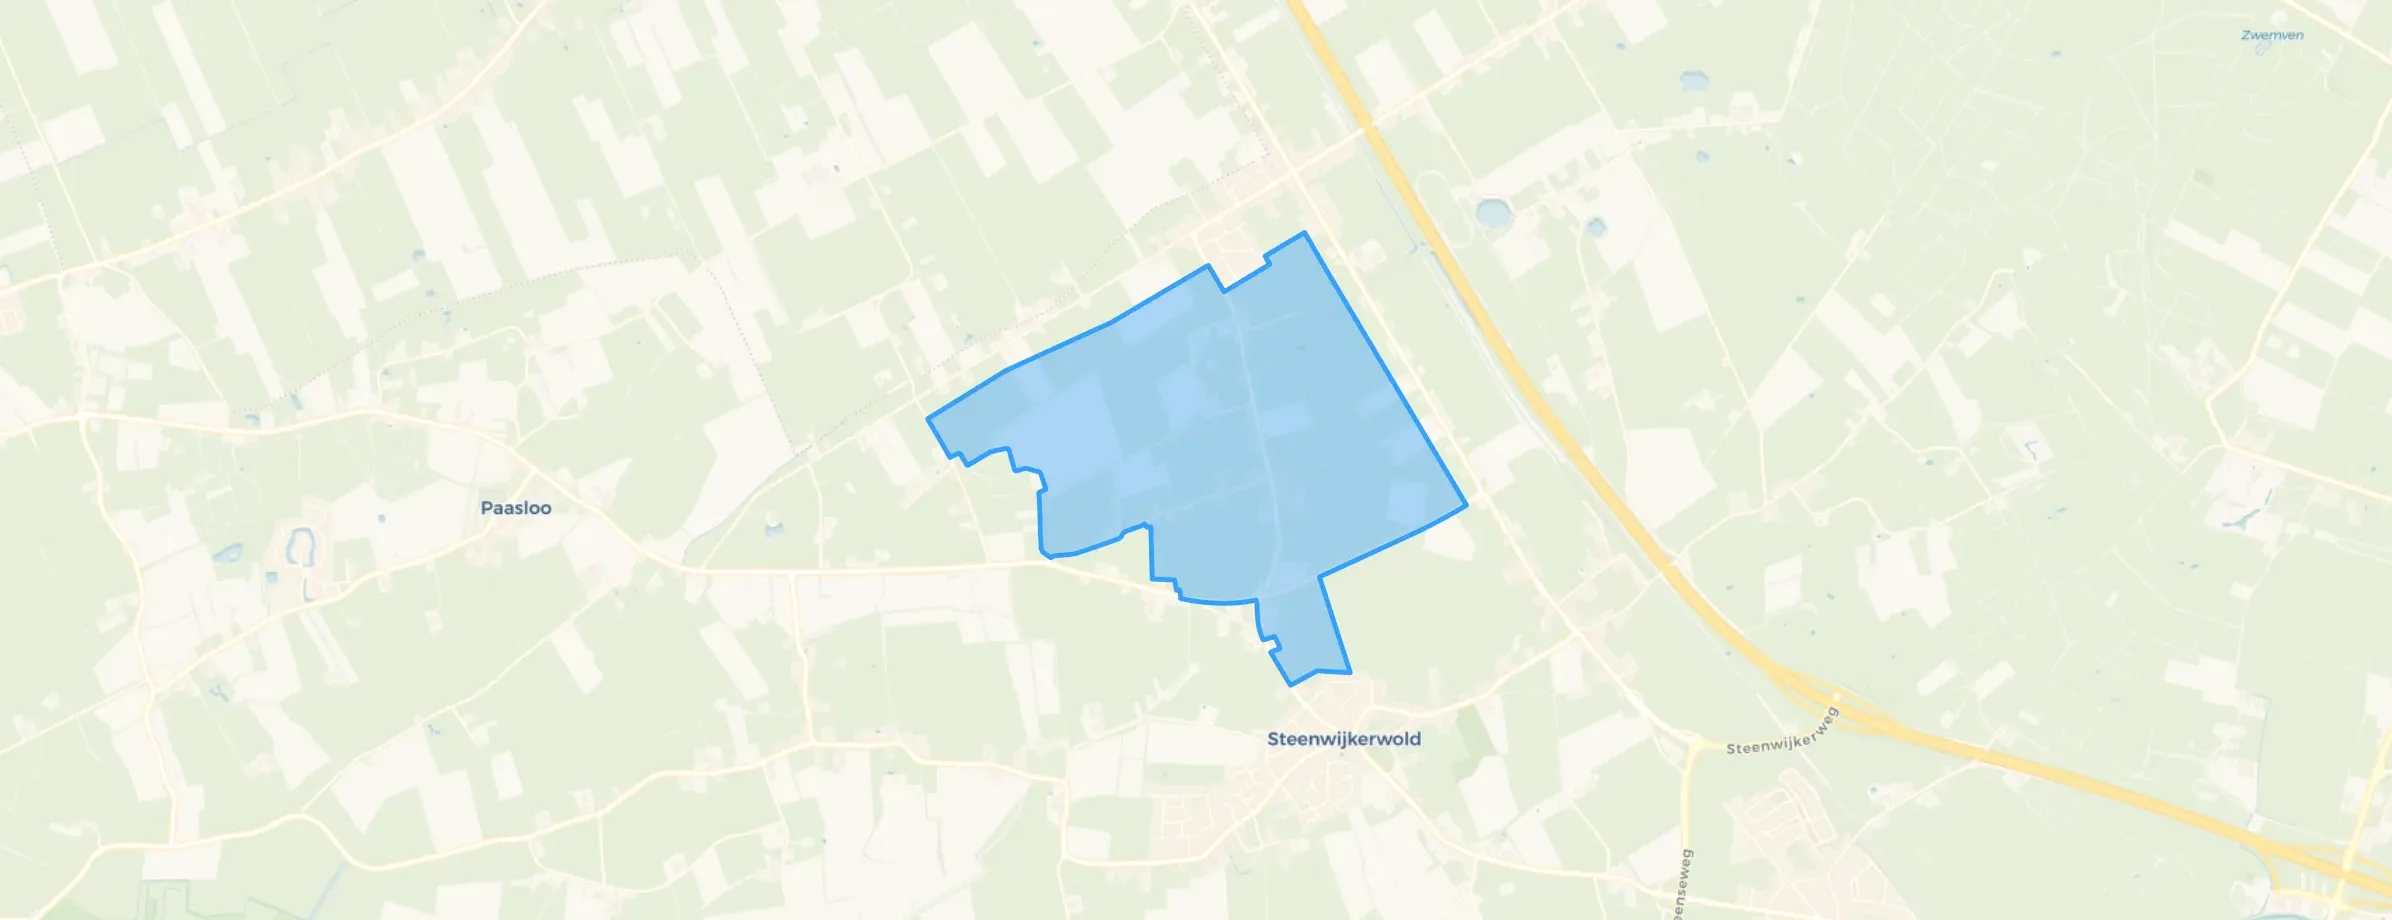
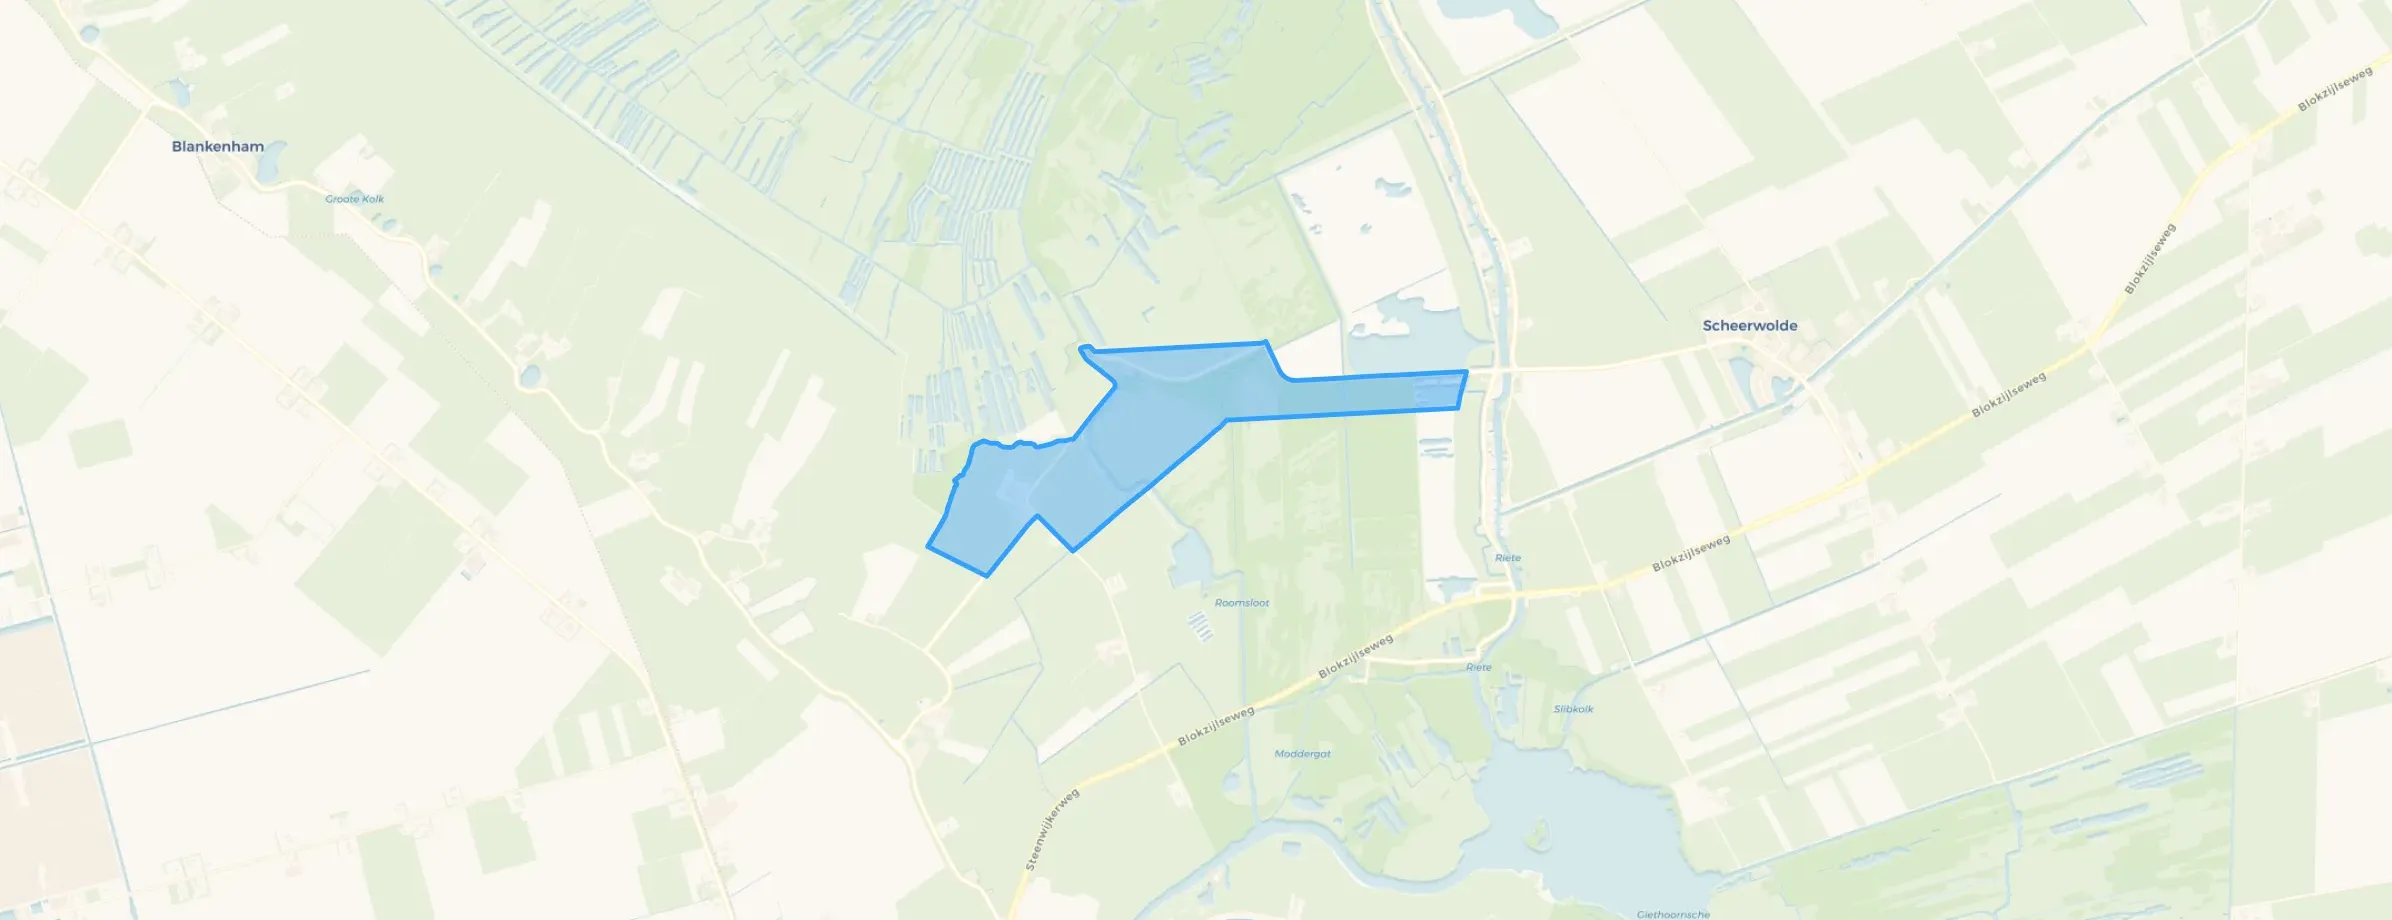
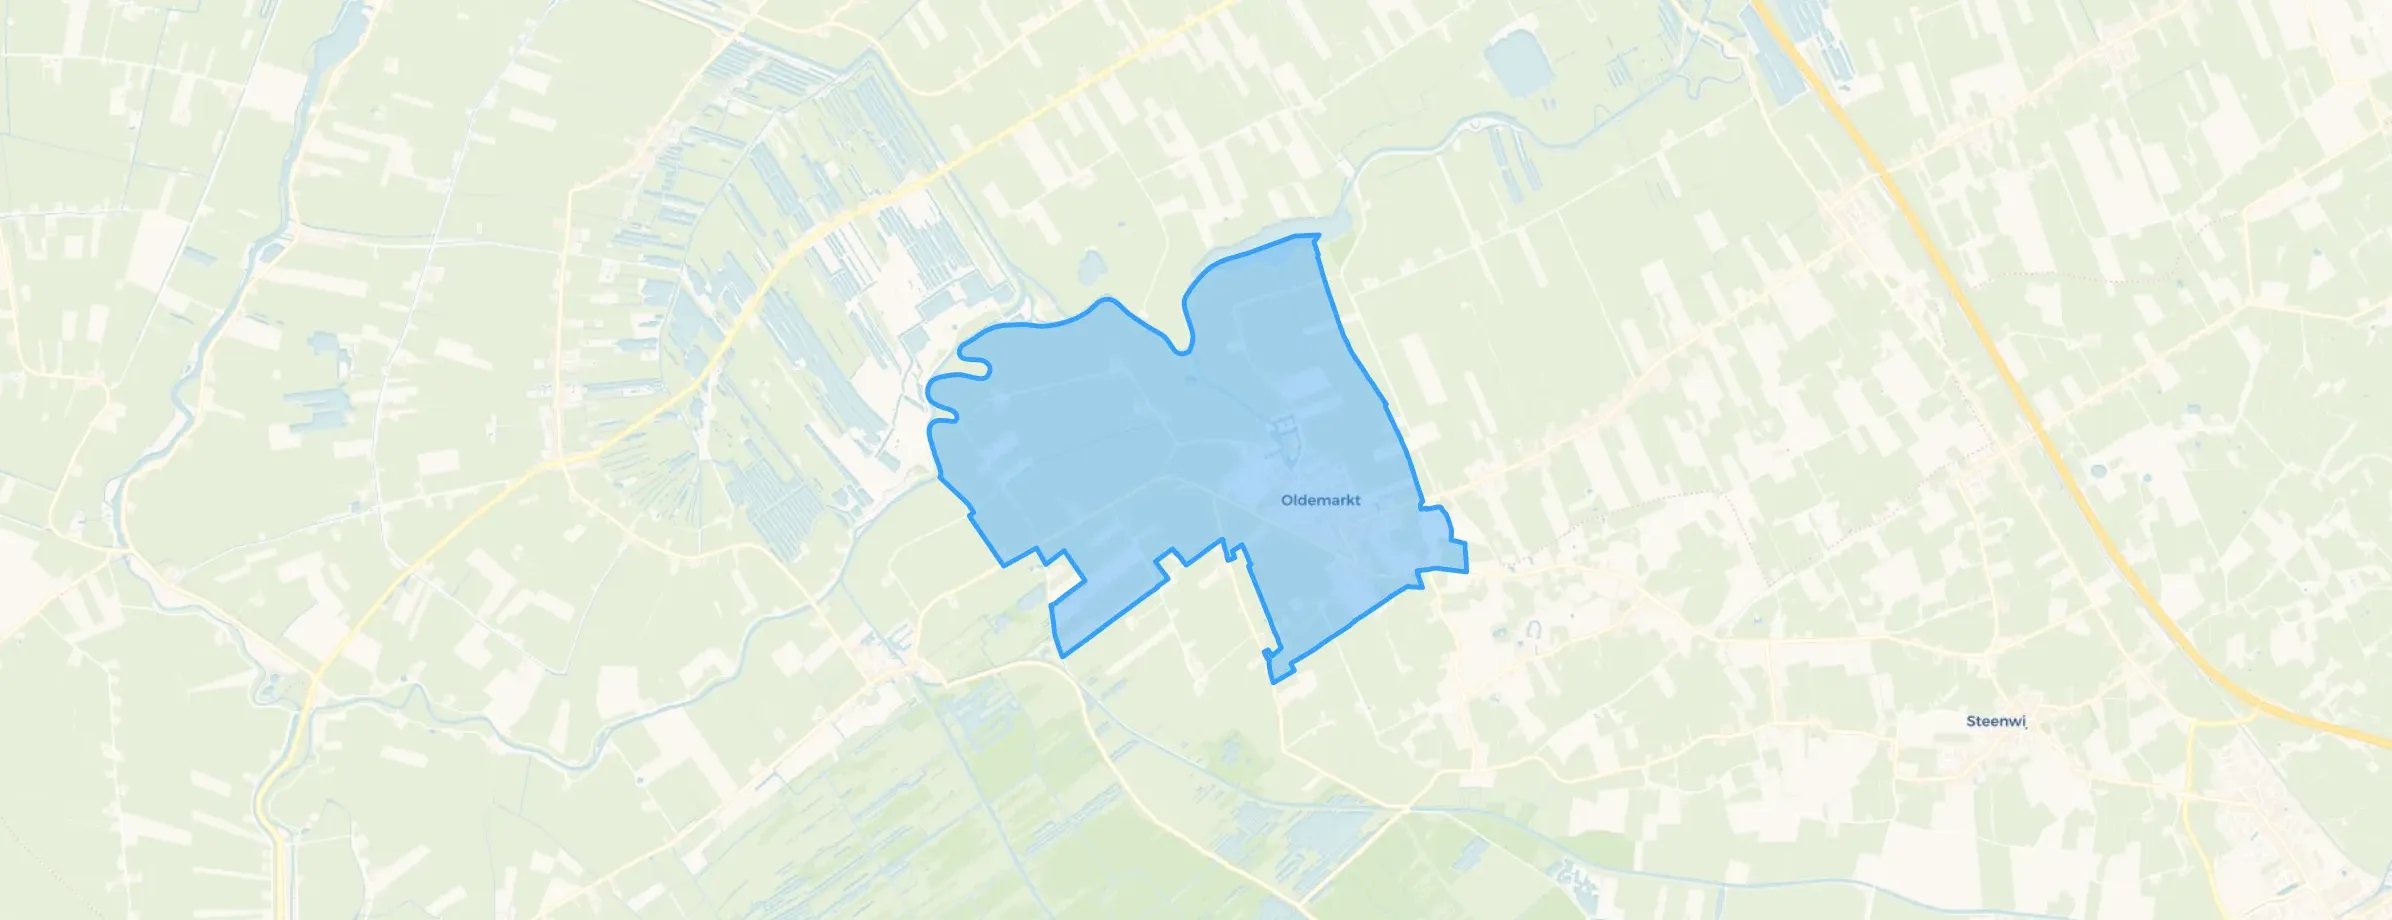
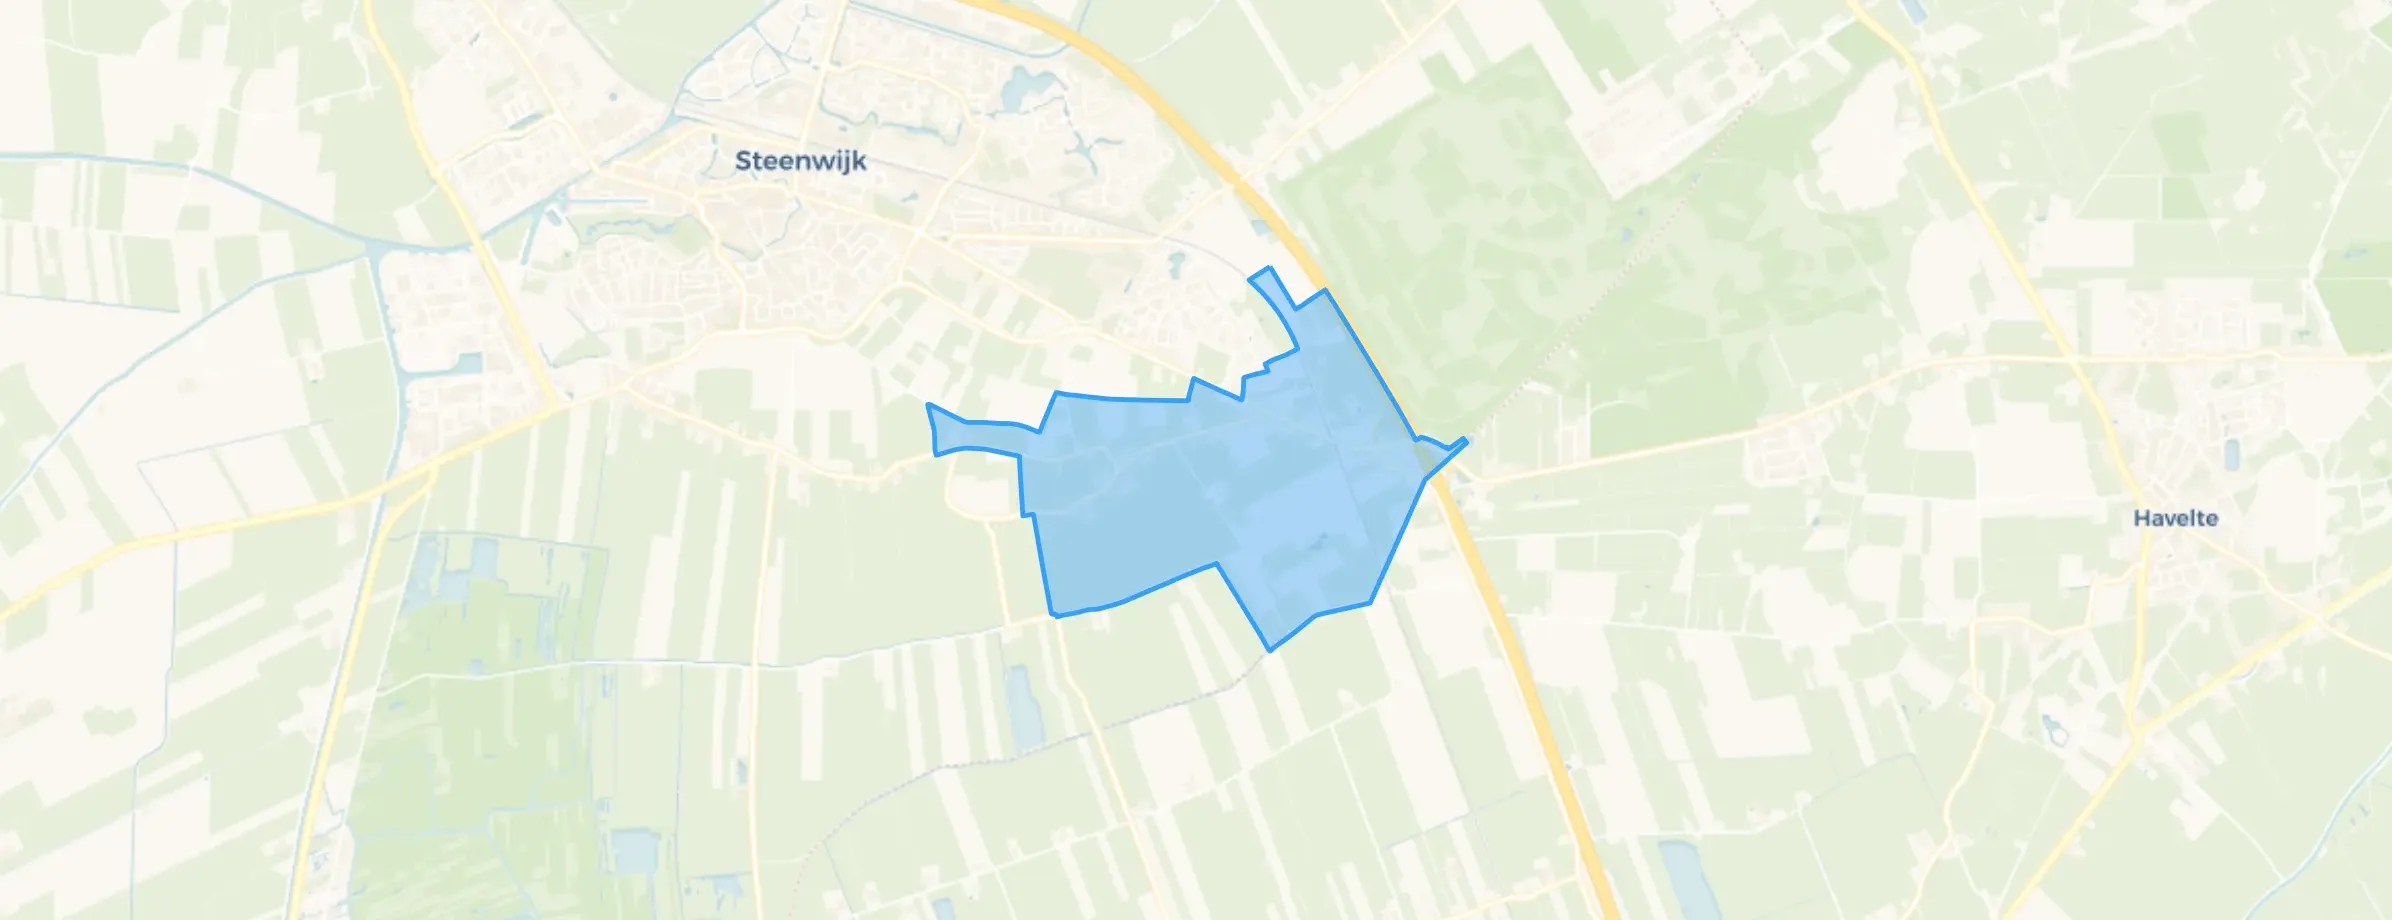
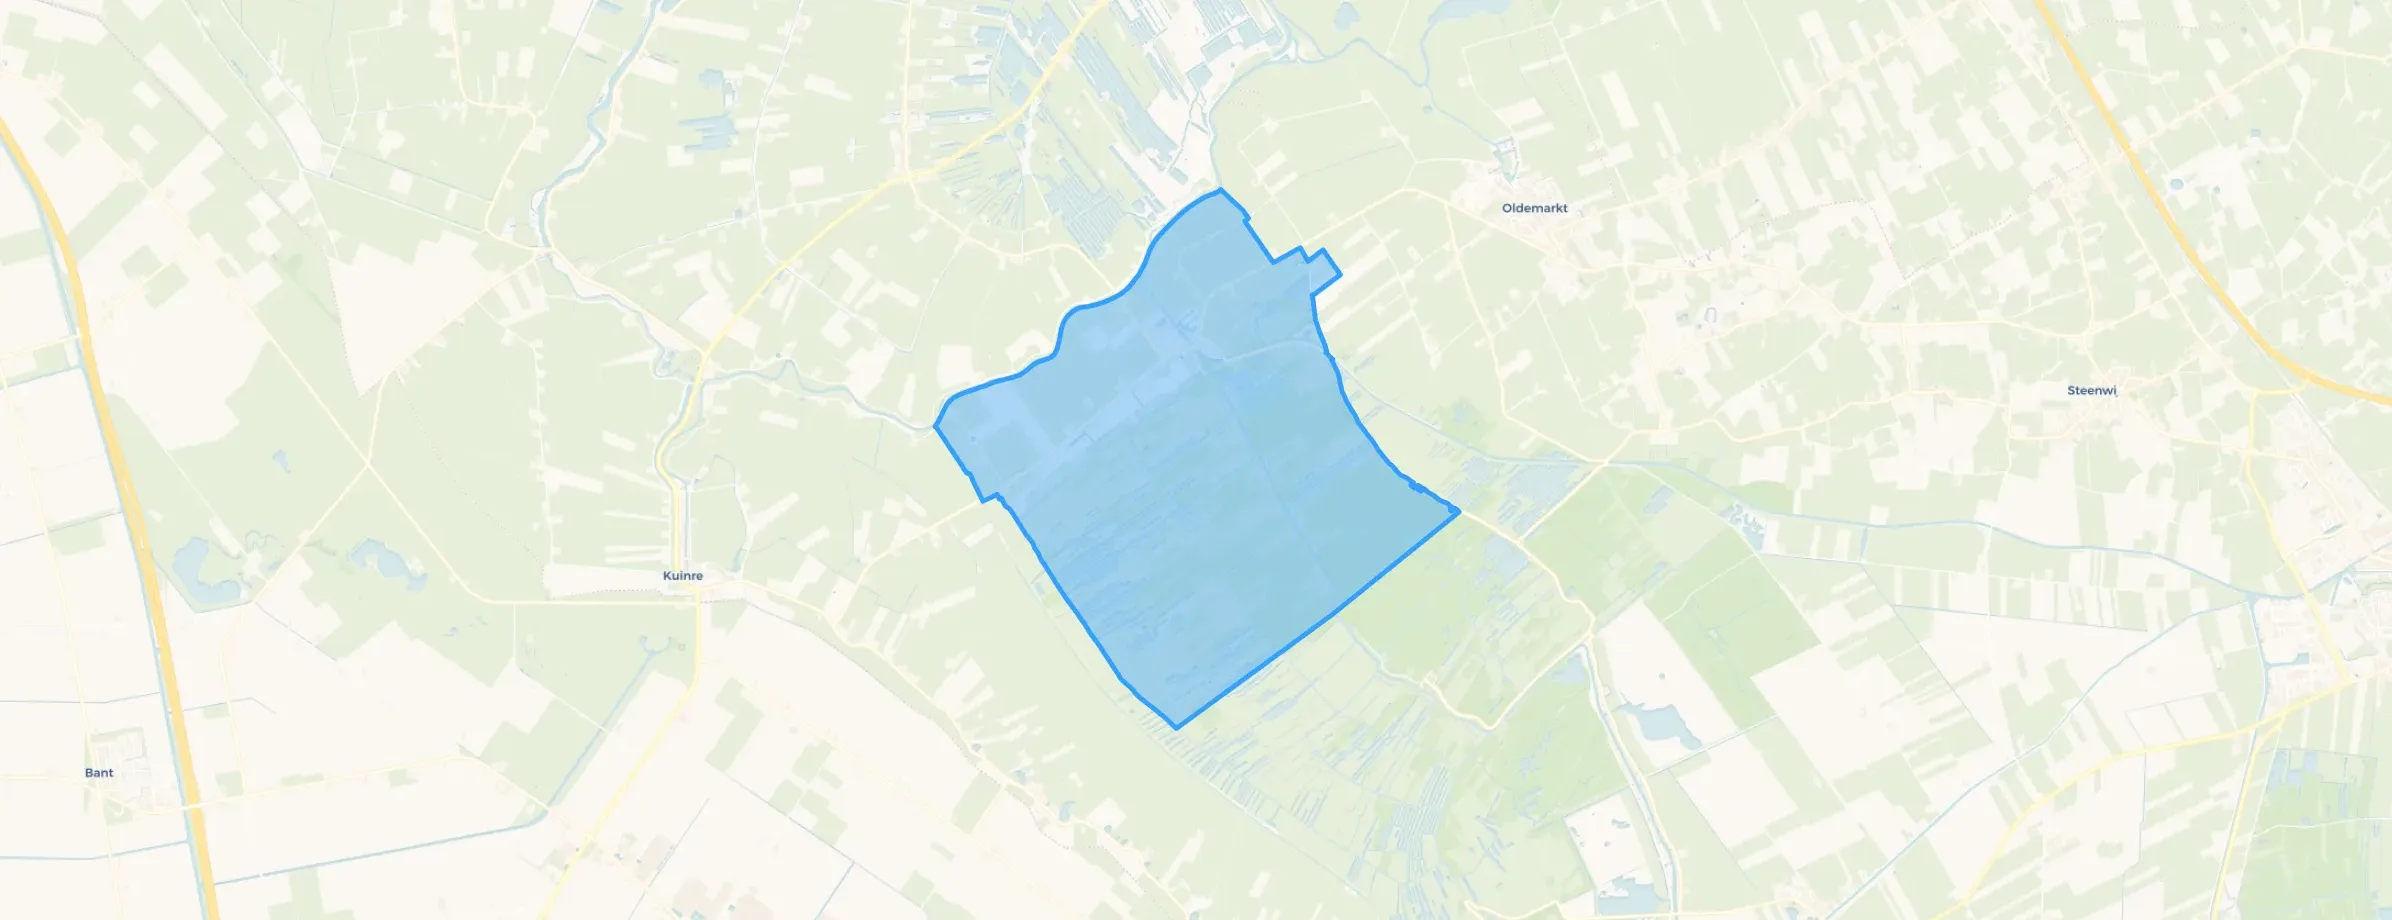

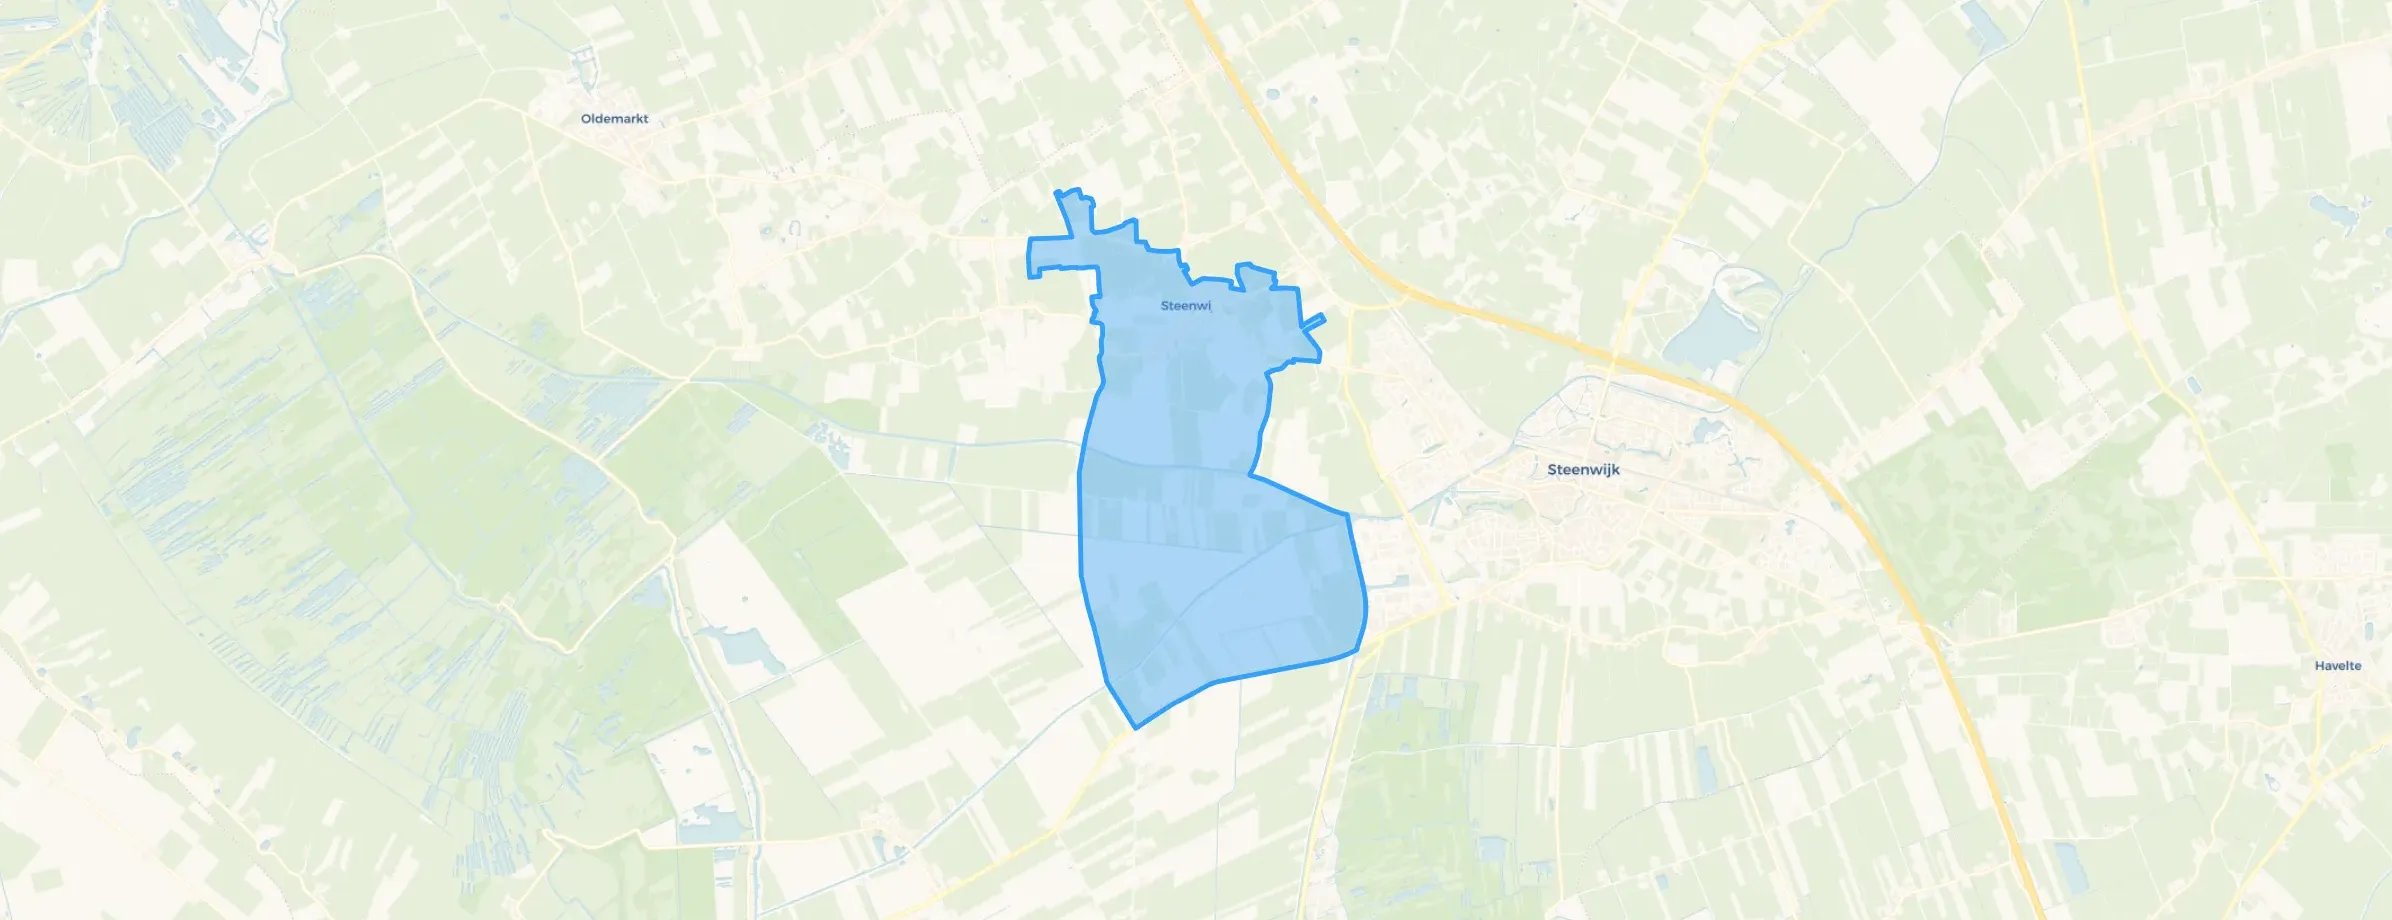

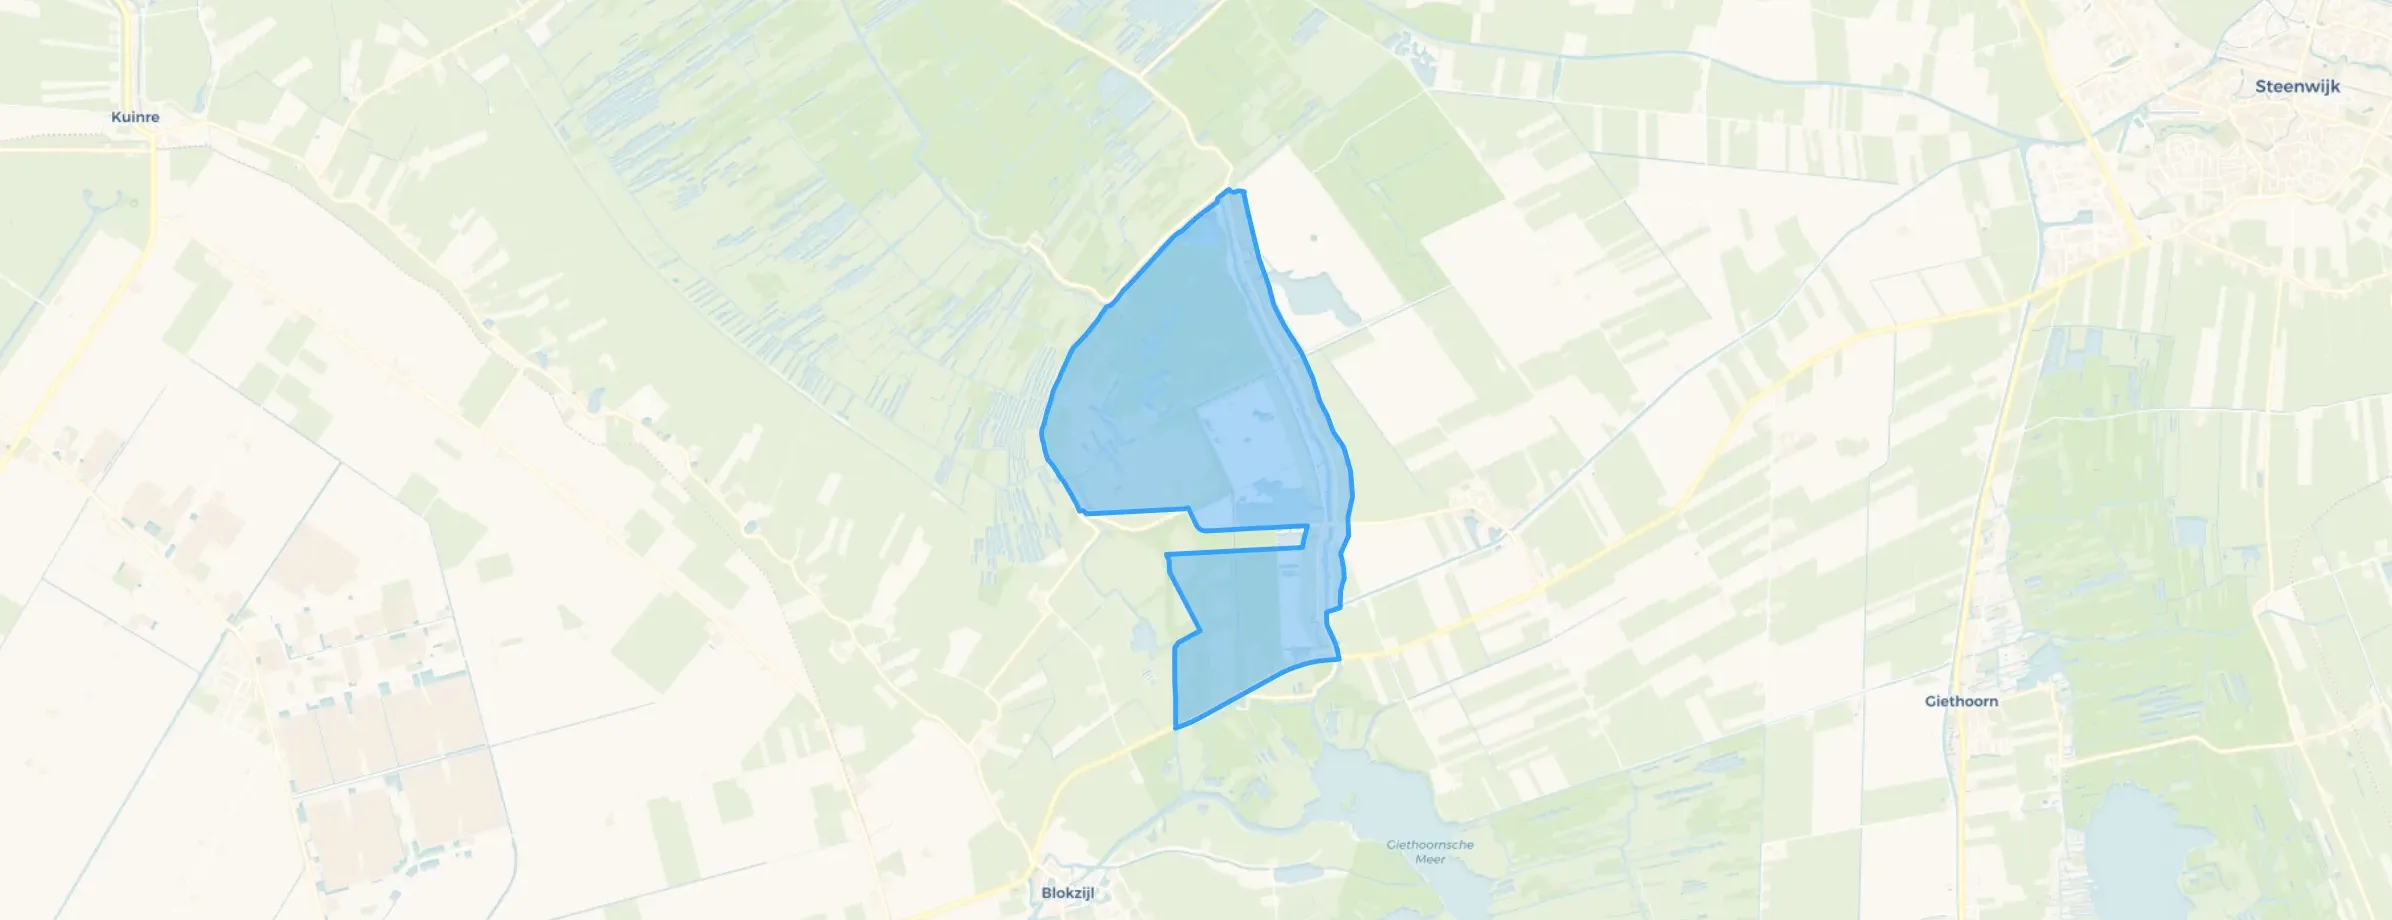

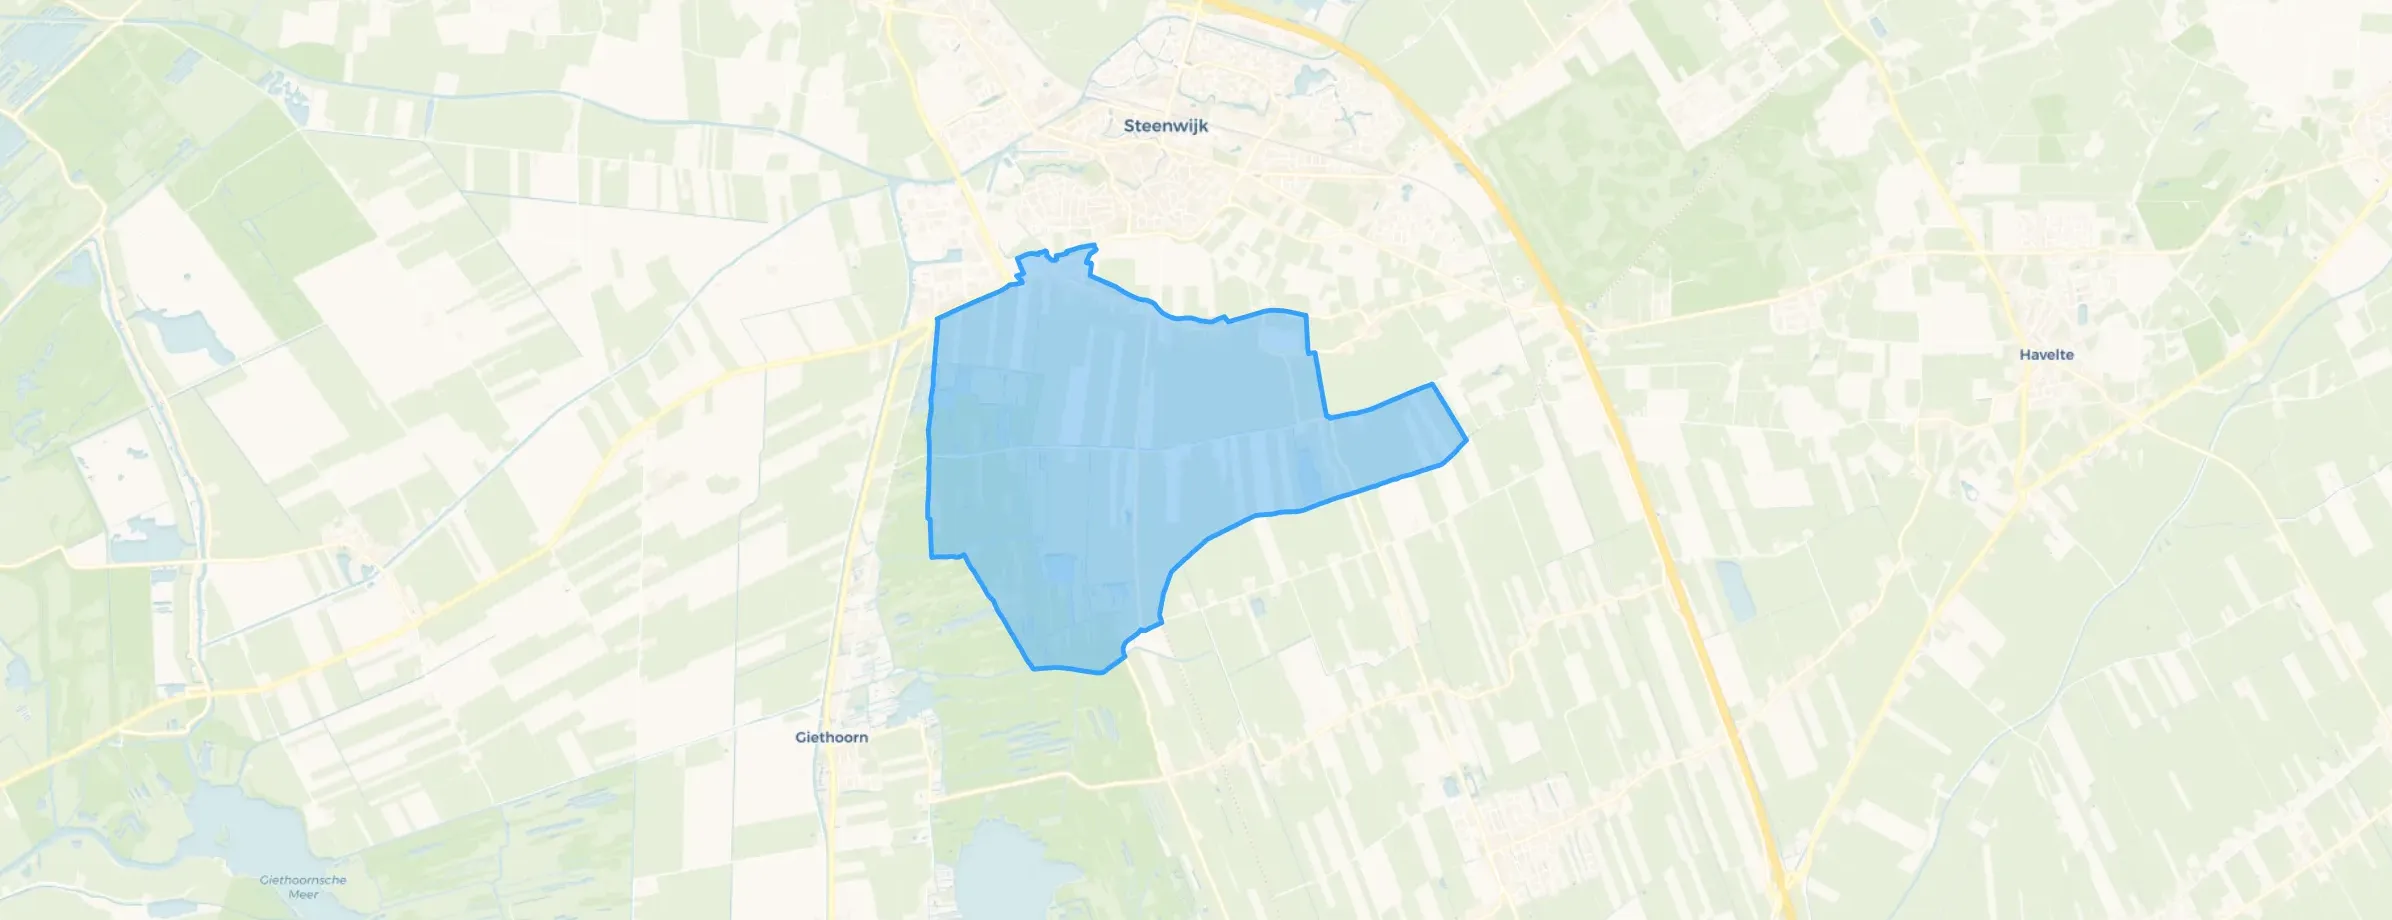
De Woldmeenthe is a nice place to live. It is green, quiet and safe. All amenities are within walking or cycling distance. A very nice area to grow up in, with many playgrounds, cycle paths, greenery and water. There is no problem with litter and the greenery is well maintained. The streets are also wide and very clear.
Auto-translated to English by AICosy neighbourhood and a safe neighbourhood, we really enjoy living here!!
Auto-translated to English by AIMy experience in this neighbourhood is that it is one of the safest neighbourhoods in the Steenwijk area, although there is slight nuisance from drug dealing and junkies who go into, for example, the park at the popular pond.
Auto-translated to English by AINice neighbourhood to live in, people are very much to themselves. Few playgrounds that look decent for small children. Very good schools though. An Albert Heijn and a snack bar and the centre a 20-minute walk away... Bus facilities I personally don't find very convenient.
Auto-translated to English by AITuk is a quiet place. The people are friendly but also keep to themselves. The only downside is the park near the Karre, where many drunk young people hang around. There is also often litter there and there are no bins nearby. But that's really the only major drawback. Tuk has a playground made from natural materials, which is good. Furthermore, it is easily accessible and you can do quite a lot here. You can go bowling, play tennis, go to the gym, a chip shop/bar, and more. It's a nice neighbourhood for families because there is also a primary school nearby and a secondary school is a 15-minute bike ride away.
Auto-translated to English by AIWonderfully quiet living. No buses running at the weekends.
Auto-translated to English by AIBy bike you're straight into De Weerribben or the woods. Giethoorn easily accessible
Auto-translated to English by AIBeautiful neighbourhood, child-friendly. Small village but not far from the towns of Steenwijk and Wolvega: 6 km! Wooded area but also Giethoorn a 20-minute drive away. Cycle to the Weerribben or swim in De Linde near Wolvega! Living in the heart; Willemsoord!
Auto-translated to English by AI
Over the past year a home for sale in Steenwijkerland was listed for an average of €472,490 (€3,409 per m²). Last quarter prices rose by 9%.
A rental home in Steenwijkerland cost an average of €1,079 per month (€11 per m²).
Residents give Steenwijkerland a 8.0 out of 10 based on 11 reviews. Nature and greenery stands out with a 8.7; amenities lags behind with a 7.4.
The housing supply in Steenwijkerland is remarkably efficient: 51% has an A, A+ or B label. The average natural gas consumption per household is 1,220 m³ per year.
From Steenwijkerland you can on average reach a supermarket at 1.6 km, a GP at 1.9 km, a railway station at 7.5 km, a primary school at 1.0 km (as the crow flies, source: CBS).
Right now you will find 339 homes for sale and 8 homes for rent in Steenwijkerland. A home for sale here is listed for an average of 76 days — relatively long for the current market.

Buurtje.nl uses cookies to make the site work and to improve it. In doing so, we process data such as your IP address and the pages you visit.
We use this data for three purposes: running the website (functional), measuring visits so we can improve Buurtje.nl (analytics), and — if you allow it — tailoring ads to your interests (marketing).
How we handle your data is described in our privacy policy. You can change your preferences at any time via 'Cookie preferences' at the bottom of every page.
Choose per category which cookies we may place. Read more in our privacy policy.