Municipality in Utrecht
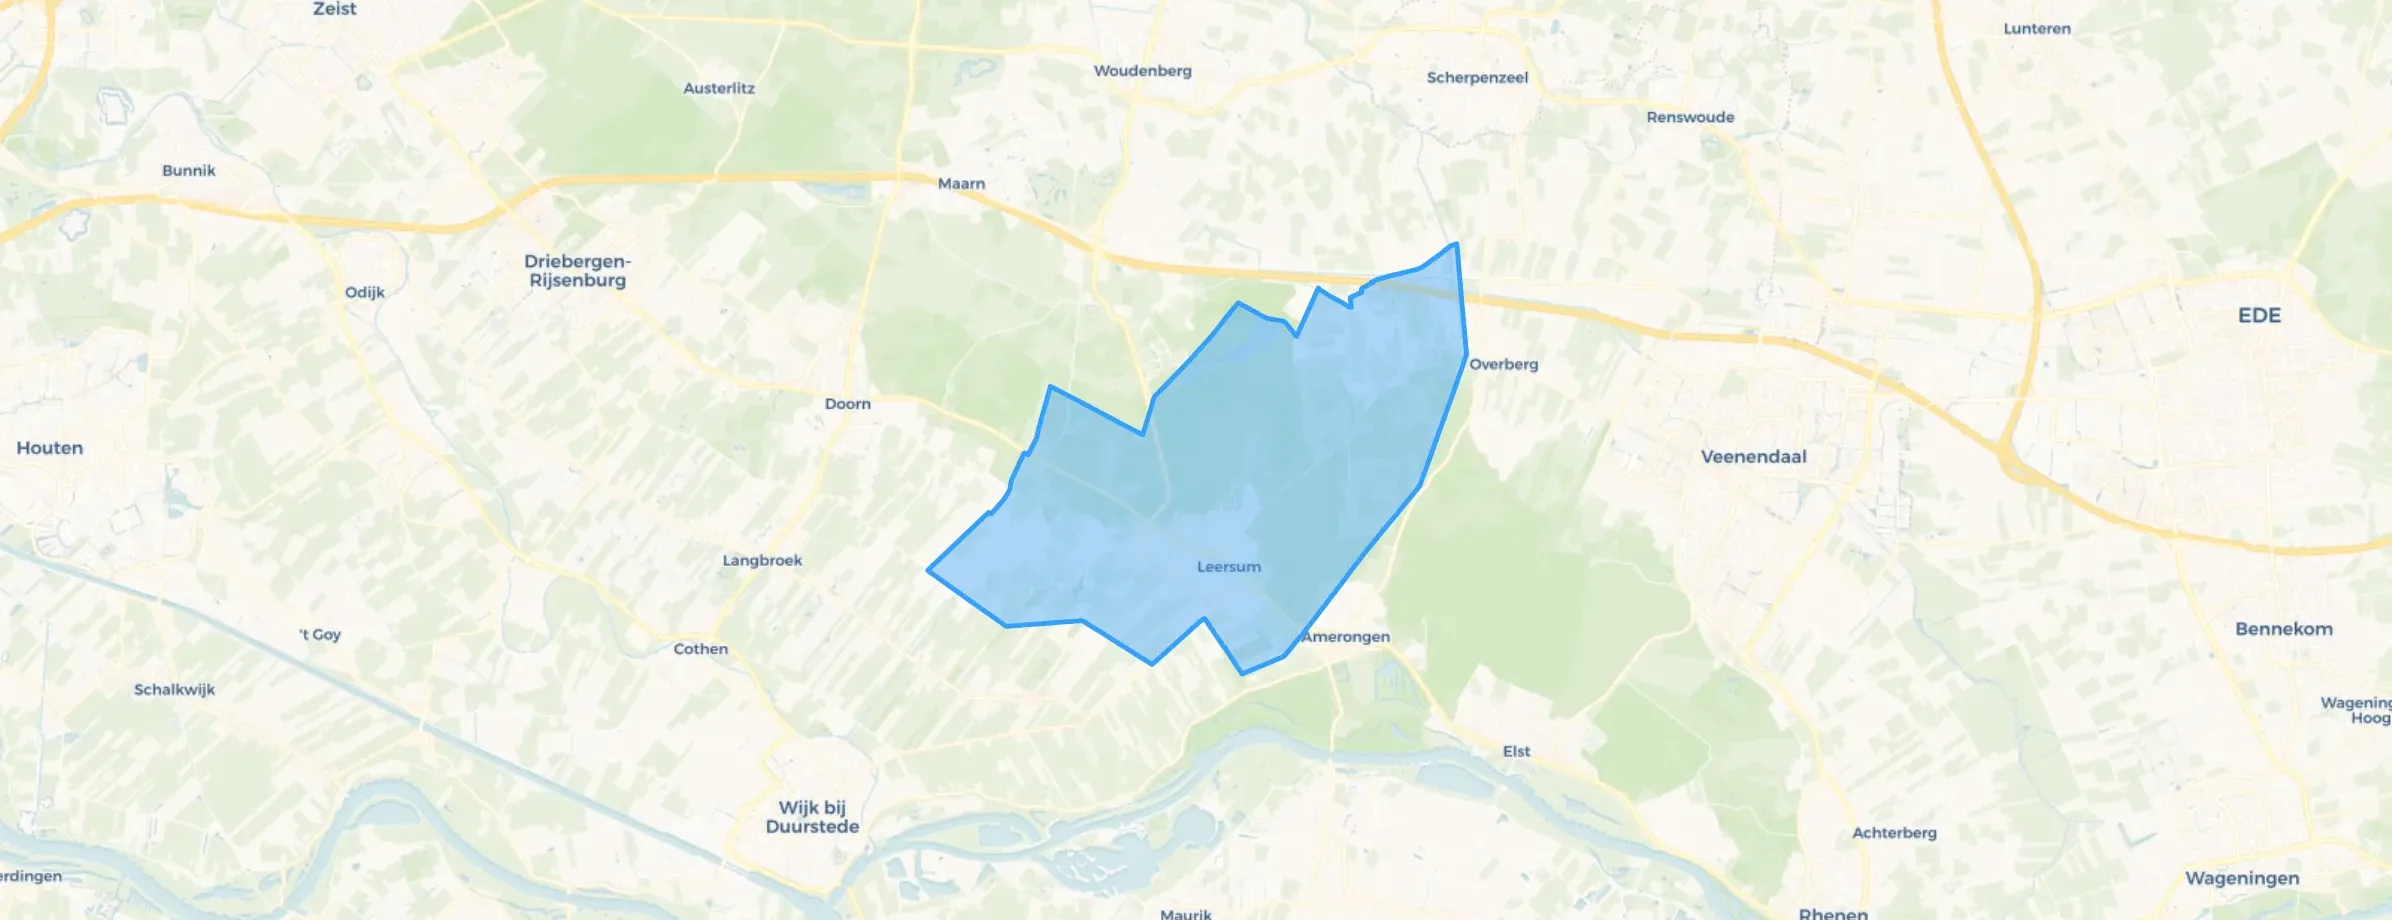
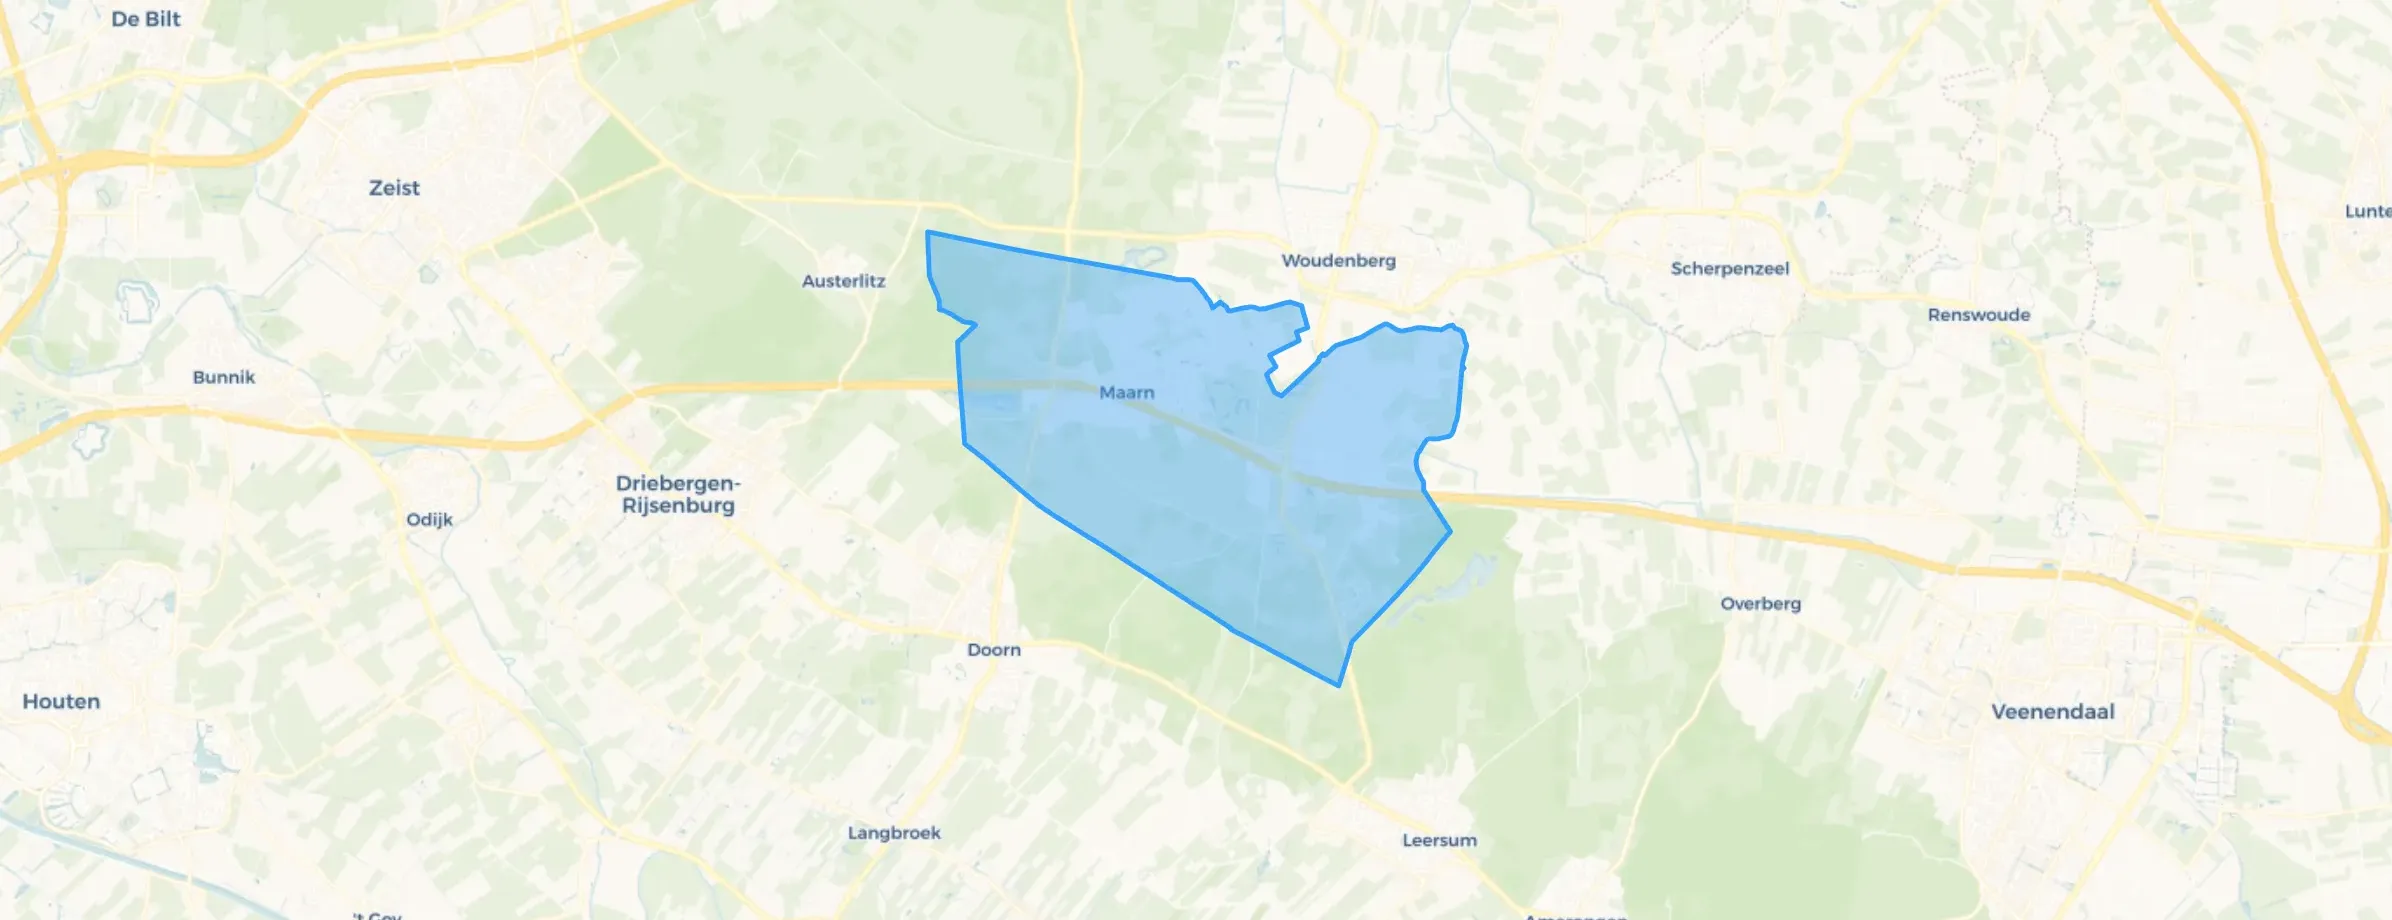
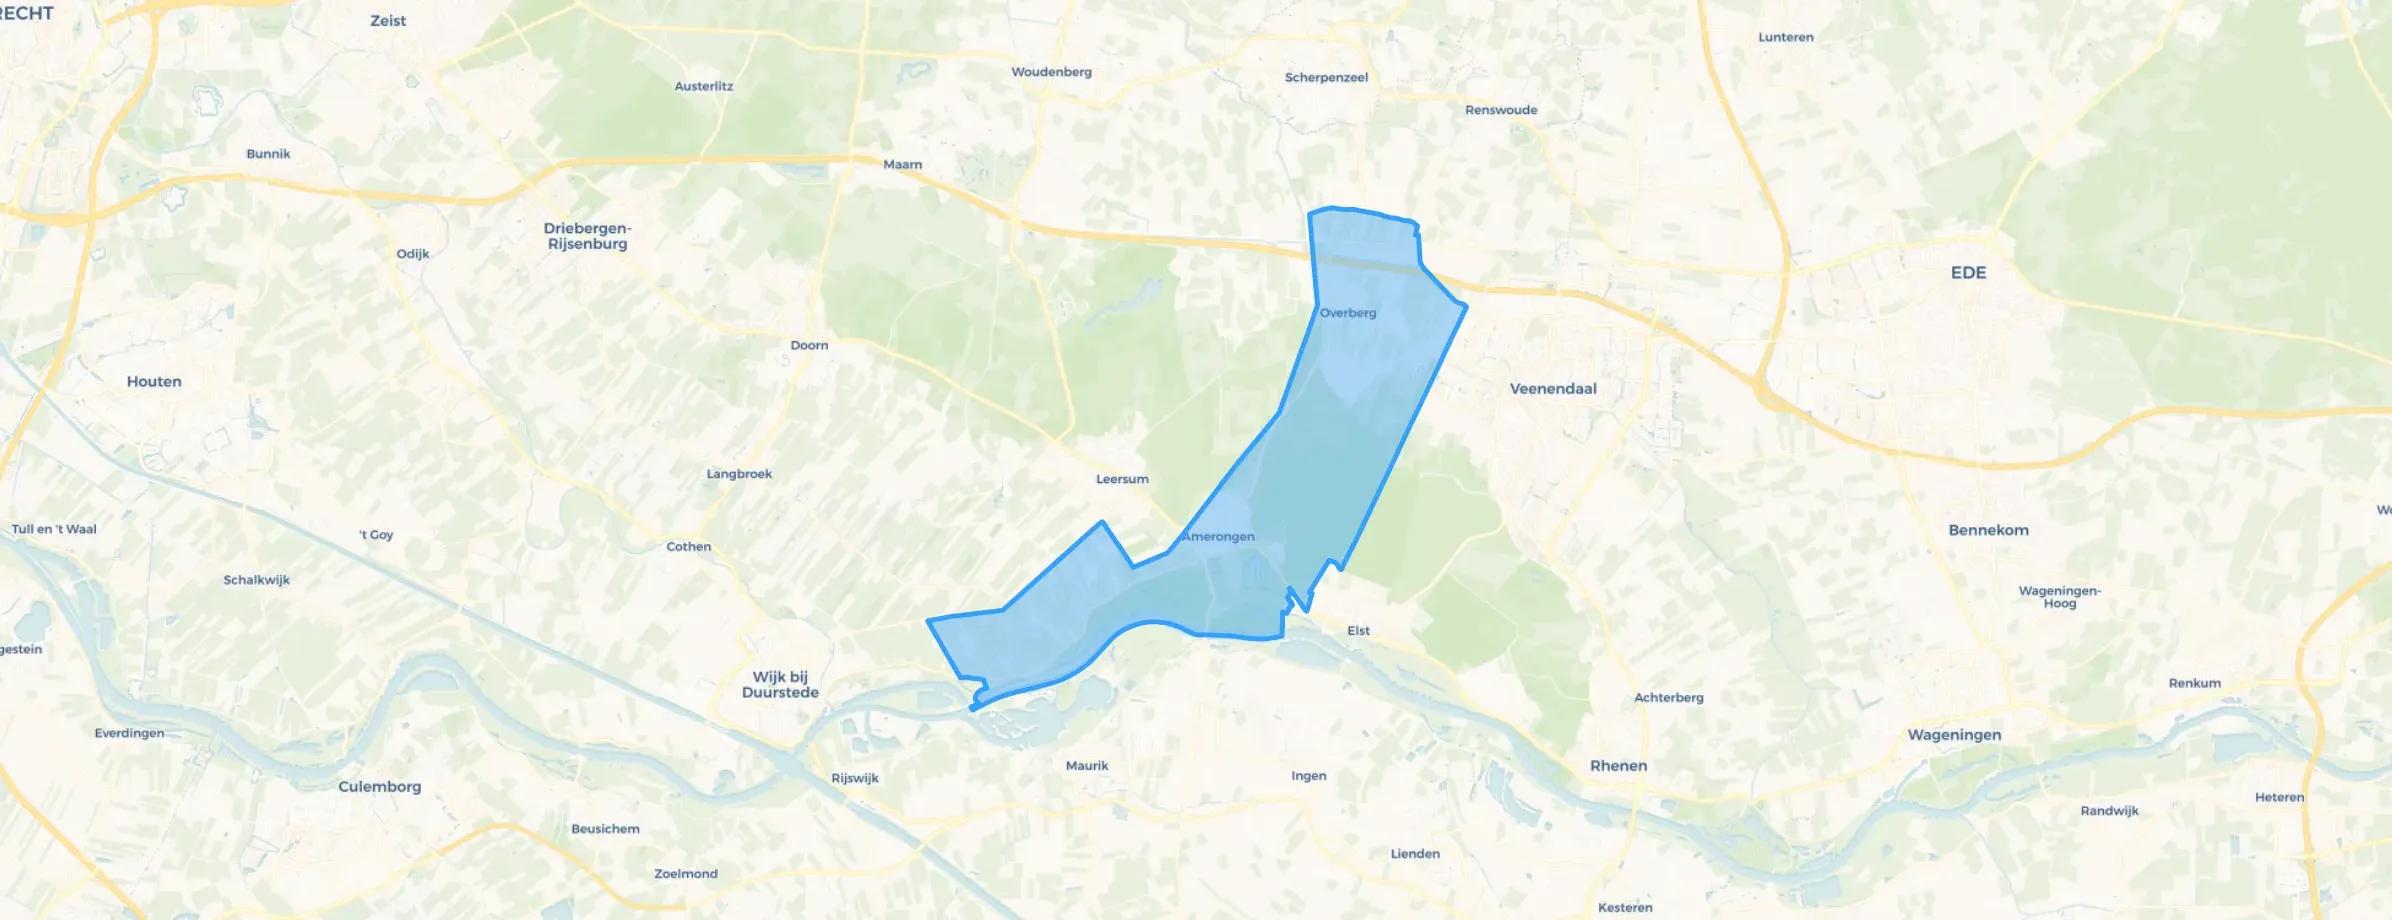
Utrechtse Heuvelrug is located in the province of Utrecht The municipality has a total area of 13.394 hectares, of which 13.202 hectares are land and 192 hectares are water. The municipality is coded as GM1581. The postcode area is 3941AA-3972ZE.
Utrechtse Heuvelrug has 50.550 residents. Of these, 48,9% are men and 51,1% are women. Most residents are 45 to 65 years (28,8%). The other age groups are 25,4% for '65 years or older', 19,2% for '25 to 45 years', 15,8% for '0 to 15 years' and 10,7% for '15 to 25 years'. Of the residents, 44,8% is unmarried, 41,4% is married, 7,6% is divorced and 6,1% is widowed. 41.126 residents originate from the Netherlands, 2.961 come from Europe and 6.463 come from countries outside Europe.
There are 22.251 households in Utrechtse Heuvelrug. 36,4% of these are single-person households, 31,2% households without children and 32,4% households with children. The average household size is 2,2 persons.
In Utrechtse Heuvelrug there are 39.200 income recipients. The average income per income recipient is €44.700, which is €8.900 (25%) higher than the national average of €35.800. Per resident, the average income is €36.400, which is €7.200 (25%) higher than the national average of €29.200. Most residents of Utrechtse Heuvelrug are highly educated. 44,8% have a university or higher professional education (HBO/WO), 33,8% have an intermediate education (HAVO, VWO or MBO 2-4) and 21,4% have a lower education (VMBO or MBO 1).
Of the 50.550 residents, around 65% are in paid employment, which amounts to 32.858 people. This is 0% lower than the national average of 65%. The majority of workers are in salaried employment (76%), while 24% are self-employed. In Utrechtse Heuvelrug, 29% of residents receive a benefit. The largest group is those receiving a state pension (AOW). 11.550 people receive this benefit.
In Utrechtse Heuvelrug there are 22.121 homes with an average assessed value (WOZ) of €494.000. Of these, around 94% are occupied and 6% unoccupied. Most homes are owner-occupied. This amounts to 35% rental homes and 65% owner-occupied homes. Of the homes, 65% privately owned, 23% owned by housing associations and 12% owned by other landlords. The most common construction periods in Utrechtse Heuvelrug are 1950-1970 (27%) and 1970-1980 (20%).
There are currently no homes for sale in Utrechtse Heuvelrug. The most recently listed home is Oude Rijksstraatweg 6 by Heiko Gorter Makelaars op Vastgoed Nederland. No homes were sold in Utrechtse Heuvelrug over the past year.
There are currently no homes for rent in Utrechtse Heuvelrug. The most recent home is Sterkenburgerlaan 6, offered by Guntenaar Wonen Bemiddeling en advies op Funda. No homes were let in Utrechtse Heuvelrug over the past year.
No recent rental data available for Utrechtse Heuvelrug.
In Utrechtse Heuvelrug there are 22.118 addresses with a registered energy label. The most common labels are C (29%), A (17%) and B (15%). On average, an address in Utrechtse Heuvelrug uses 2.970 kWh of electricity per year. This is 6% above the national average of 2.810 kWh. Natural gas consumption in this neighbourhood, at 1.280 m³ per year, exactly matches the national average.
good
Auto-translated to English by AIQuiet, friendly people, all amenities within 1 kilometre and nature around the corner. The bus to Utrecht, Wageningen or Veenendaal stops 4 times per hour 400 metres away. Great place to live.
Auto-translated to English by AIIt's a quiet neighbourhood. I live on the edge of Driebergen, on a street with almost only farms, and it's very quiet. Furthermore, the neighbourhood is not involved with each other and there is hardly any contact with the neighbours or the neighbourhood. I've been living here for 4 years now and I haven't managed to make any friends in Driebergen, which is a shame. Otherwise, it's clean and tidy, and there is never any rubbish or things on the street.
Auto-translated to English by AIBlissful on a dead-end road ending at a forest with a pond, it's peaceful living. Except for the nocturnal adventurers who sit on the bench. What do they do? Unfortunately, they throw their scavenged wrappers on the ground while there's a bin within two steps. Otherwise, great place to live.
Auto-translated to English by AISafe neighbourhood with almost no problems, lovely to live in and nice and quiet.
Auto-translated to English by AII grew up here as a child, Driebergen will always have a place in my heart. Because there were (then fewer) children, my sister and I always went out exploring and discovered the nicest things together. Since Driebergen is located in a wooded area, there is a lot to discover. The village festivals are also getting better and better! Last year there was a Christmas market and it felt so cosy and connected. We live close to everything, nice and close to shops, forest, Utrecht, it's just a shame that few activities are organised for children. Driebergen also has no secondary schools, but that's not a problem. In recent years I have come to appreciate Driebergen more! Like learning more about the history of the village and the architecture, for example. What I also find interesting is that they now organise all sorts of things on Liberation Day so we can learn more about Driebergen. A very nice neighbourhood! As a child I always felt safe, in recent years a bit less so, especially in the evenings, because of loitering youths. As I said before, Driebergen is very green, in most streets you see shrubs, trees, flowers, plants everywhere, especially now in spring it makes me very happy!
Auto-translated to English by AIYou can make it as long as you want. It's a large park with a beautiful lake and well-maintained. If you want to go for a walk, this is a top choice!
Auto-translated to English by AIEveryone here is so friendly and greets each other when you see each other walking or cycling. Other than that, there is plenty to see.
Auto-translated to English by AI
The housing stock is mainly post-war — 59% was built between 1945 and 1990.
Over the past year a home for sale in Utrechtse Heuvelrug was listed for an average of €653,442 (€5,173 per m²). Last quarter prices rose by 13%.
A rental home in Utrechtse Heuvelrug cost an average of €1,782 per month (€15 per m²).
Residents give Utrechtse Heuvelrug a 8.3 out of 10 based on 29 reviews. Especially nature and greenery (9.0) scores well; amenities (7.6) receives the lowest rating.
From Utrechtse Heuvelrug you can on average reach a supermarket at 1.1 km, a GP at 1.1 km, a railway station at 4.5 km, a primary school at 0.7 km (as the crow flies, source: CBS).
Right now you will find 320 homes for sale and 20 homes for rent in Utrechtse Heuvelrug.

Buurtje.nl uses cookies to make the site work and to improve it. In doing so, we process data such as your IP address and the pages you visit.
We use this data for three purposes: running the website (functional), measuring visits so we can improve Buurtje.nl (analytics), and — if you allow it — tailoring ads to your interests (marketing).
How we handle your data is described in our privacy policy. You can change your preferences at any time via 'Cookie preferences' at the bottom of every page.
Choose per category which cookies we may place. Read more in our privacy policy.