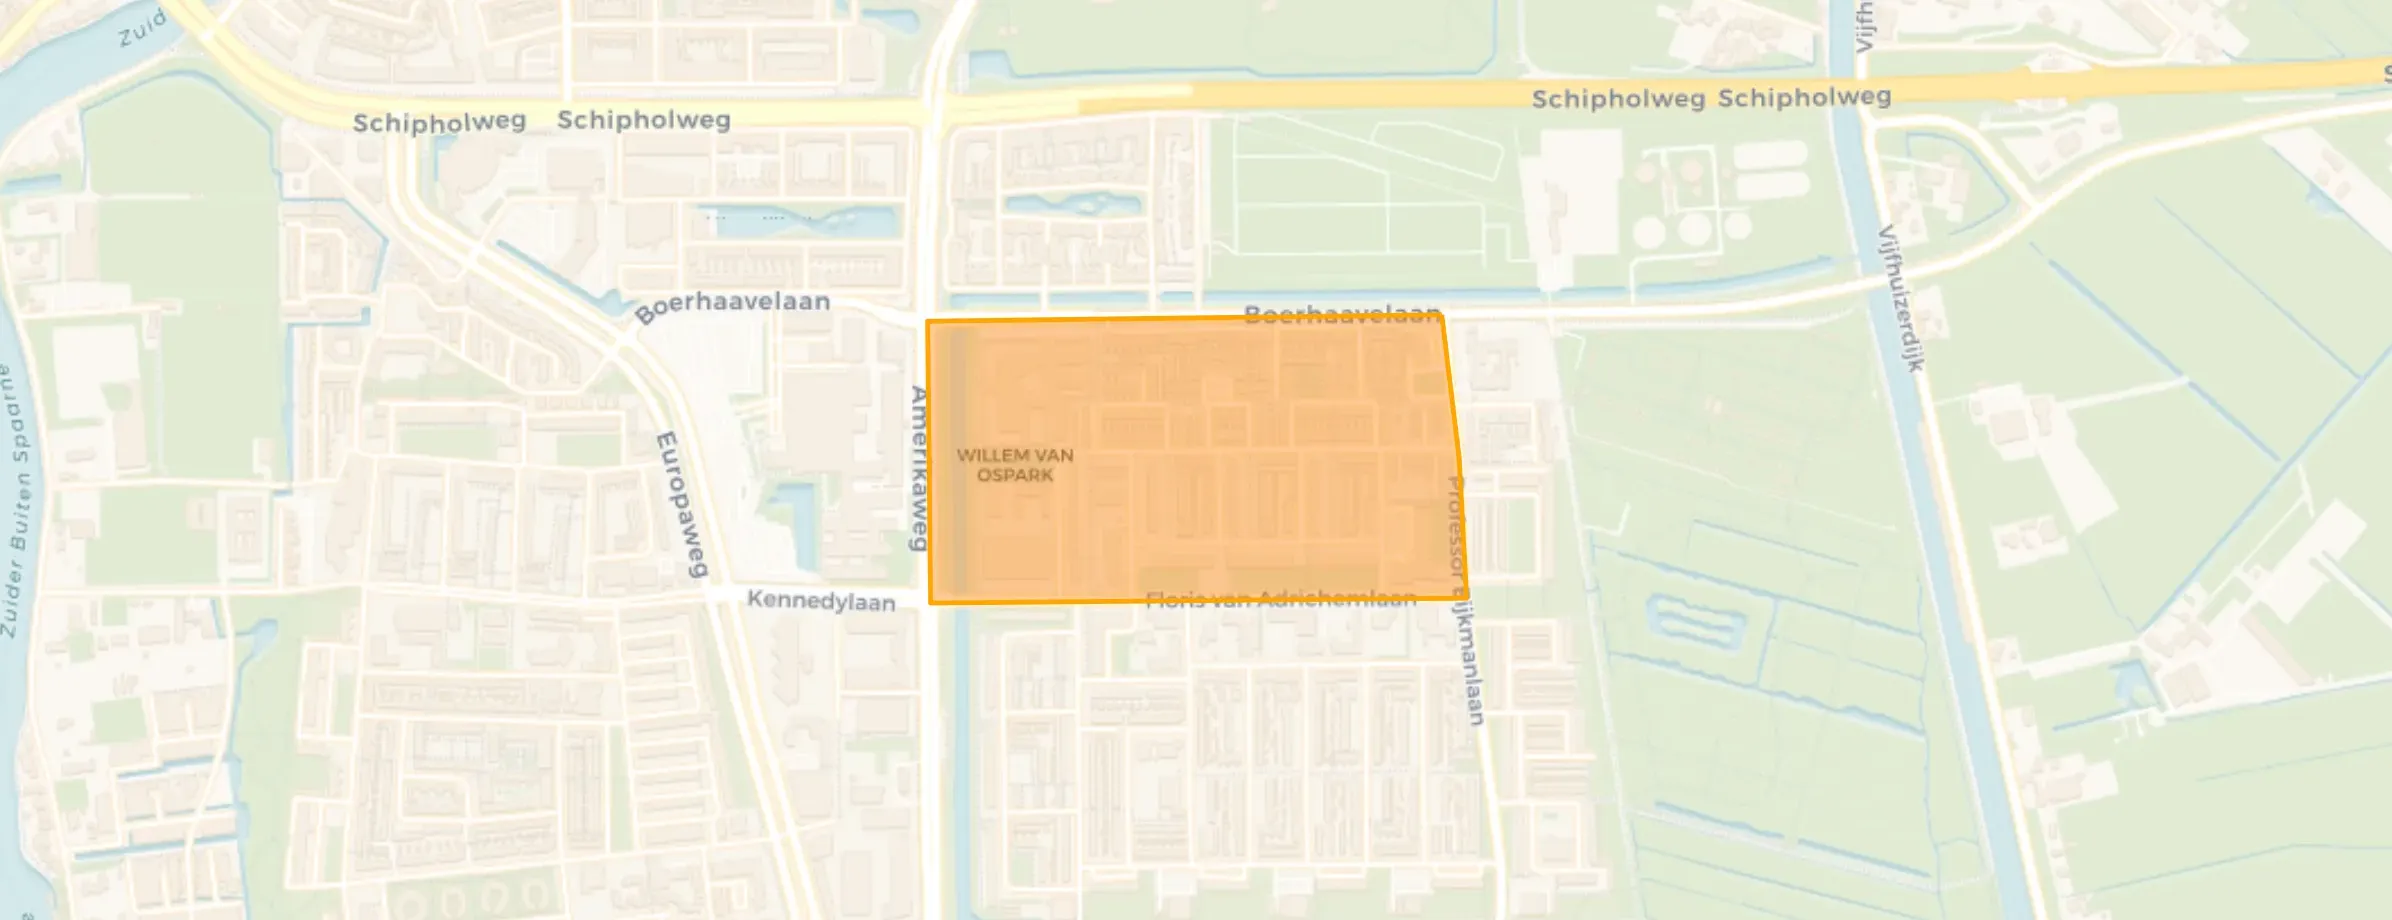
Neighbourhood in Haarlem
Geleerdenbuurt is located in the province of Noord-Holland, in the municipality of Haarlem, in the district Boerhaavewijk The neighbourhood has a total area of 25 hectares, of which 24 hectares are land and 1 hectares are water. The neighbourhood is coded as BU03921903. The postcode area is 2035PA-2035XB.
Four residents rate the neighbourhood as very good with a score of 8.3. They describe it as 'Easy to want to stay', 'Very good' and 'Decent neighbourhood'. Aspects such as education, amenities, safety are rated well in this neighbourhood, while housing and cleanliness score less well.
Geleerdenbuurt has 2.730 residents. Of these, 47,3% are men and 52,7% are women. Most residents are 25 to 45 years (29,9%). The other age groups are 22,2% for '45 to 65 years', 20,5% for '0 to 15 years', 17,6% for '65 years or older' and 9,9% for '15 to 25 years'. Of the residents, 50,2% is unmarried, 34,6% is married, 9,7% is divorced and 5,5% is widowed. 1.195 residents originate from the Netherlands, 165 come from Europe and 1.375 come from countries outside Europe.
There are 1.075 households in Geleerdenbuurt. 34,0% of these are single-person households, 22,3% households without children and 43,7% households with children. The average household size is 2,4 persons. The national average is 2,1 persons.
In Geleerdenbuurt there are 2.000 income recipients. The average income per income recipient is €33.700, which is €8.500 (20%) lower than the national average of €42.200. Per resident, the average income is €28.500, which is €6.400 (18%) lower than the national average of €34.900. Most residents of Geleerdenbuurt are educated to an intermediate level. 47,6% have an intermediate education (HAVO, VWO or MBO 2-4), 30,4% have a lower education (VMBO or MBO 1) and 22,0% have a university or higher professional education (HBO/WO).
Of the 2.730 residents, around 66% are in paid employment, which amounts to 1.802 people. This is 6% lower than the national average of 72%. The majority of workers are in salaried employment (85%), while 15% are self-employed. In Geleerdenbuurt, 29% of residents receive a benefit. The largest group is those receiving a state pension (AOW). 450 people receive this benefit.
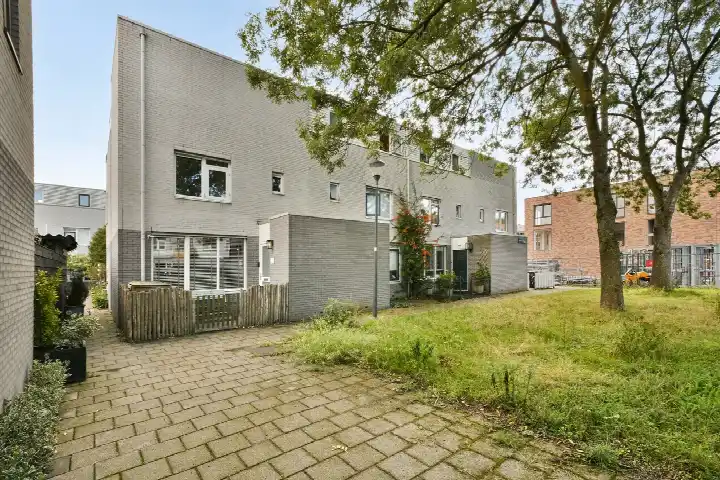
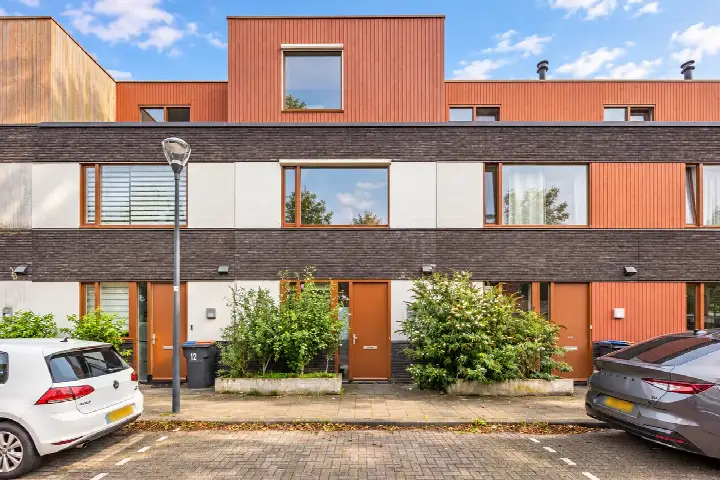
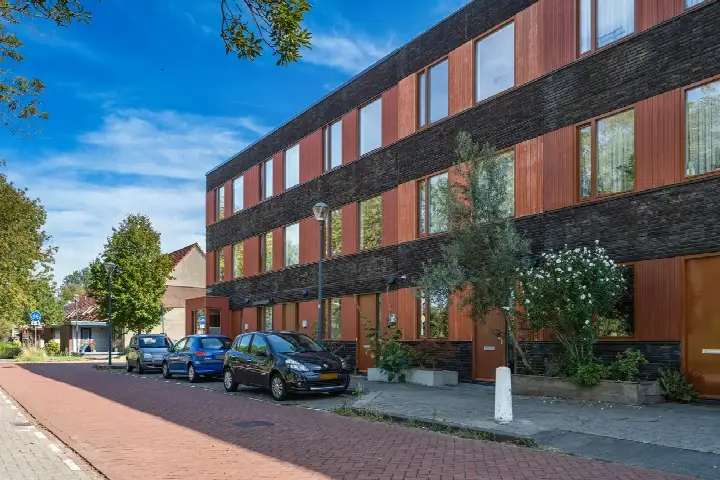
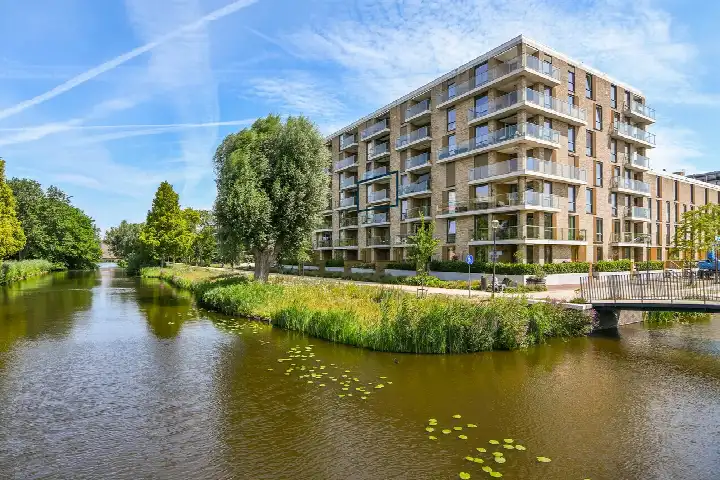
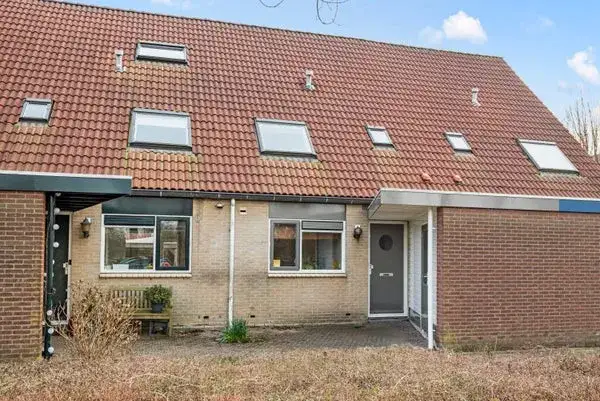
In Geleerdenbuurt there are 1.207 homes with an average assessed value (WOZ) of €391.000. Of these, around 96% are occupied and 4% unoccupied. Most homes are rental properties. This amounts to 72% rental homes and 28% owner-occupied homes. Of the homes, 28% privately owned, 48% owned by housing associations and 23% owned by other landlords. The most common construction periods in Geleerdenbuurt are 1950-1970 (33%) and 2020 and later (26%).
There are currently 8 homes for sale in Geleerdenbuurt. The most recently listed home is Floris van Adrichemkade 6 by Overspaern Makelaardij op Funda. Over the past year, 47 homes were sold in Geleerdenbuurt. On average, a home was sold within 41 days.
The average asking price for a home for sale in Geleerdenbuurt over the past year was €598.340. This is 53% higher than the average assessed value (WOZ) of €391.000. The average asking price per m² of plot is €4.070.
There are 4 homes for rent in Geleerdenbuurt. The most recent home is Hans Henneveldpad 93, offered by vb&t Verhuurmakelaars. Over the past year, 39 homes were let in Geleerdenbuurt. On average, a listing was let within 38 days.
The average rent for a rental home in Geleerdenbuurt over the past year was €1.550 per month. Per m² of plot area that is €21 per month.
In Geleerdenbuurt there are 965 addresses with a registered energy label. The most common labels are A (27%), C (27%) and A+++ (23%). On average, an address in Geleerdenbuurt uses 2.130 kWh of electricity per year. This is 16% below the national average of 2.550 kWh. With an annual consumption of 580 m³ per address, natural gas consumption is 28% below the national average of 800 m³.
It has been a place where I feel safe and at home all my life. I find the people very sociable and there is always something to do.
Auto-translated to English by AIIt is very good, but the only problem is accessibility. There is only bus 3 every half hour.
Auto-translated to English by AINice neighbourhood, there could be fewer loitering youths and fewer apartment blocks, but they are working on that. Furthermore, lovely people and neighbours and you have everything you need and the motorway is a minute from your home.
Auto-translated to English by AIThe neighbourhood is nice and helpful, kind neighbours who look after each other. However, it is densely populated with apartments and there is often rubbish on the street. The loitering youths are not too bad and are somewhat present at the nearby Lidl, but fortunately that is a bit further away. We have the Rooie Pad behind us as green space, but there could certainly be more.
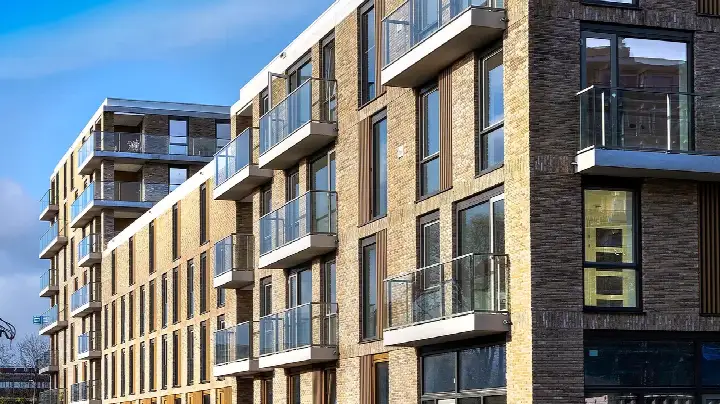
Auto-translated to English by AIThe housing stock is relatively young — 90% dates from after 1990. In addition, the most common type is flats (69%).
Over the past year a home for sale in Geleerdenbuurt was listed for an average of €603,000 (€5,468 per m²). That is 14% above the Dutch national average.
A rental home in Geleerdenbuurt cost an average of €1,717 per month (€23 per m²). That is 20% below the national average.
Residents give Geleerdenbuurt a 8.3 out of 10 based on 4 reviews. Especially amenities (9.3) scores well; cleanliness (6.8) receives the lowest rating.
Buurt Geleerdenbuurt has 2,730 residents. The largest age group is 25 to 45 years (30%). Many families: 44% of the households have children.
The housing supply in Geleerdenbuurt is remarkably efficient: 96% has an A, A+ or B label. The average natural gas consumption per household is 580 m³ per year.
From Geleerdenbuurt you can on average reach a supermarket at 0.4 km, a GP at 1.3 km, a railway station at 4.0 km, a primary school at 0.4 km (as the crow flies, source: CBS).
Right now you will find 8 homes for sale and 4 homes for rent in Geleerdenbuurt.