Neighbourhood in Hilversum
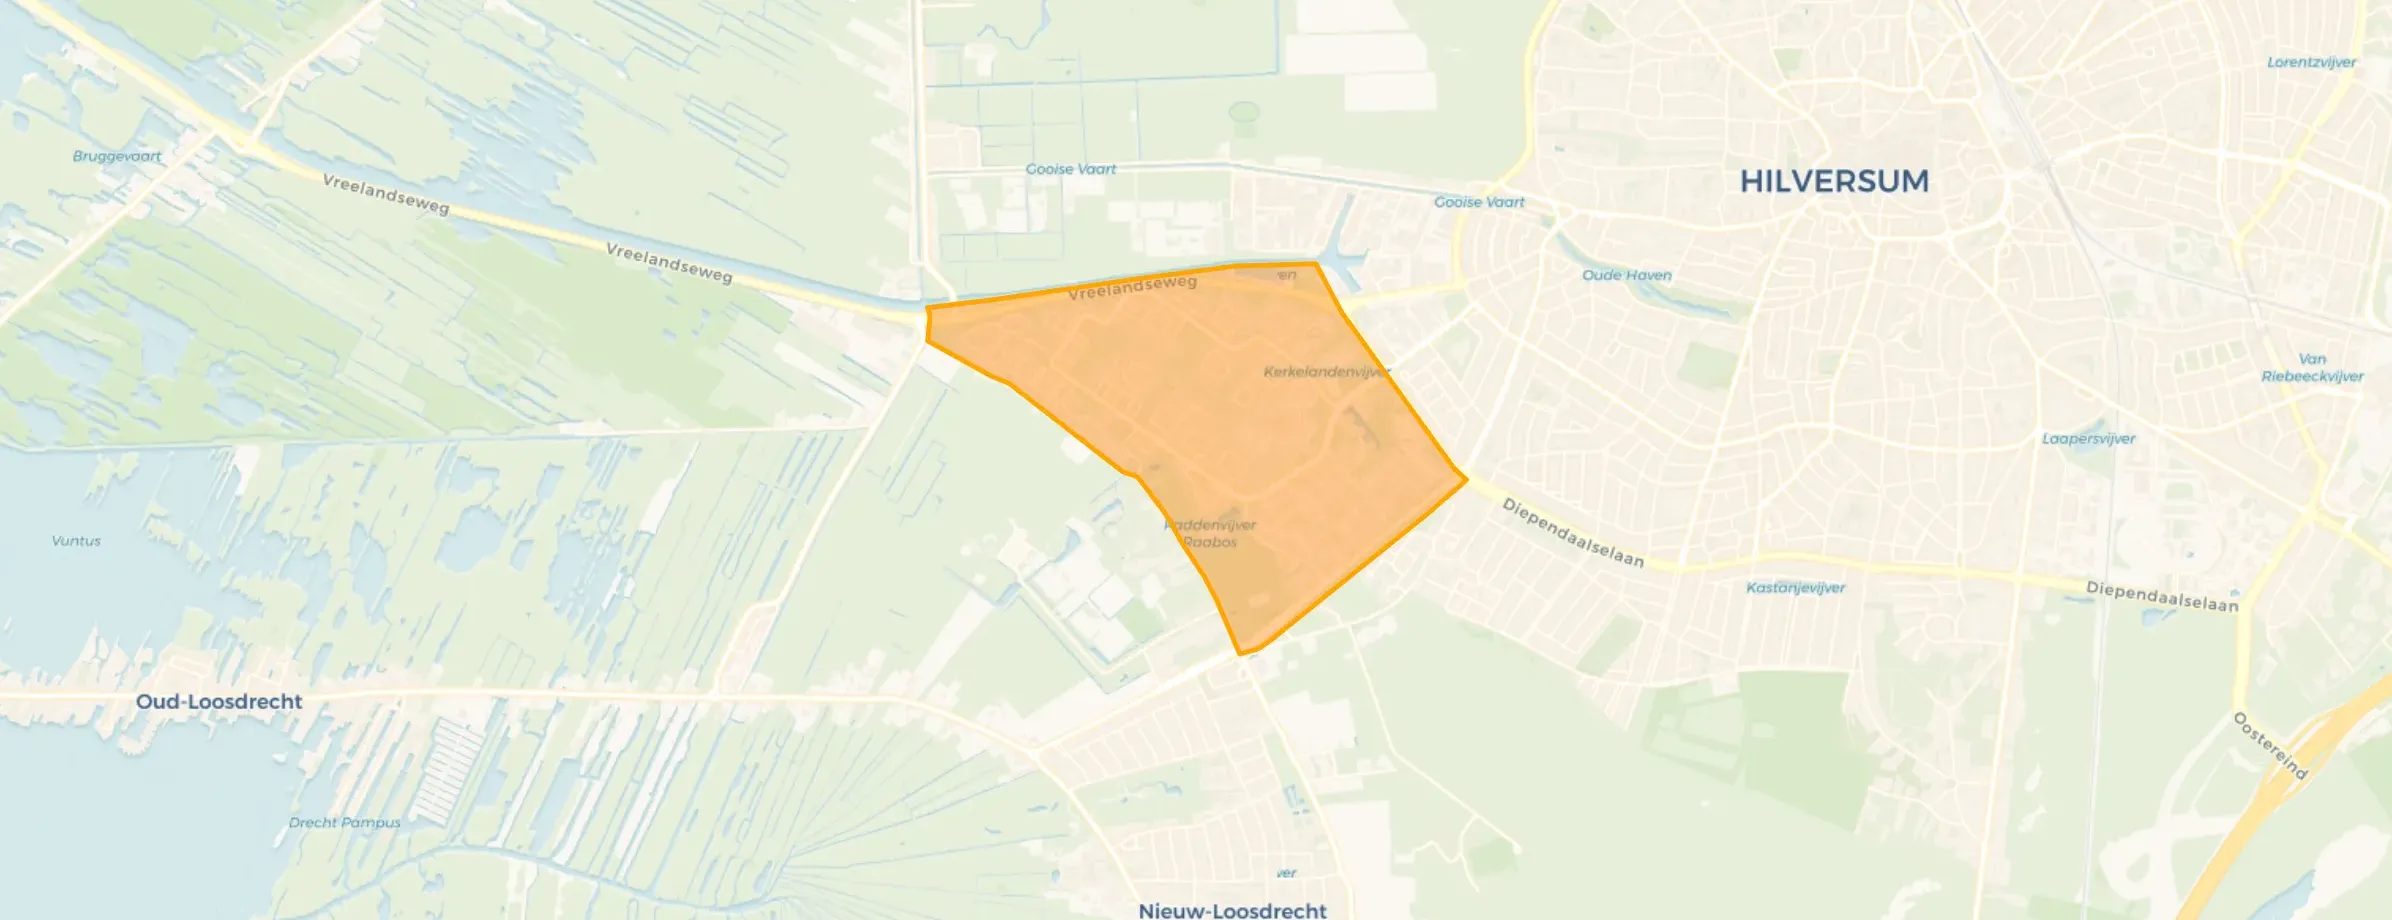
Kerkelanden is located in the province of Noord-Holland, in the municipality of Hilversum, in the district Zuidwest The neighbourhood has a total area of 145 hectares, of which 140 hectares are land and 5 hectares are water. The neighbourhood is coded as BU04020304. The postcode area is 1215KD-1216TK.
Six residents rate the neighbourhood as more than satisfactory with a score of 6.5. They describe it as 'Kerkelanden', 'Quiet beautiful neighbourhood' and 'Noisy 1970s houses'. Aspects such as amenities, greenery, education are rated well in this neighbourhood, while cleanliness and housing score less well.
Kerkelanden has 6.025 residents. Of these, 47,4% are men and 52,6% are women. Most residents are 65 years or older (31,0%). The other age groups are 22,9% for '45 to 65 years', 21,1% for '25 to 45 years', 14,8% for '0 to 15 years' and 10,3% for '15 to 25 years'. Of the residents, 44,9% is unmarried, 35,9% is married, 9,7% is divorced and 9,5% is widowed. 4.000 residents originate from the Netherlands, 415 come from Europe and 1.610 come from countries outside Europe.
There are 2.880 households in Kerkelanden. 45,7% of these are single-person households, 25,2% households without children and 29,2% households with children. The average household size is 2,0 persons. The national average is 2,1 persons.
In Kerkelanden there are 4.800 income recipients. The average income per income recipient is €38.000, which is €4.200 (10%) lower than the national average of €42.200. Per resident, the average income is €31.500, which is €3.400 (10%) lower than the national average of €34.900. Most residents of Kerkelanden are educated to an intermediate level. 44,1% have an intermediate education (HAVO, VWO or MBO 2-4), 28,4% have a university or higher professional education (HBO/WO) and 27,6% have a lower education (VMBO or MBO 1).
Of the 6.025 residents, around 69% are in paid employment, which amounts to 4.157 people. This is 3% lower than the national average of 72%. The majority of workers are in salaried employment (82%), while 18% are self-employed. In Kerkelanden, 35% of residents receive a benefit. The largest group is those receiving a state pension (AOW). 1.680 people receive this benefit.
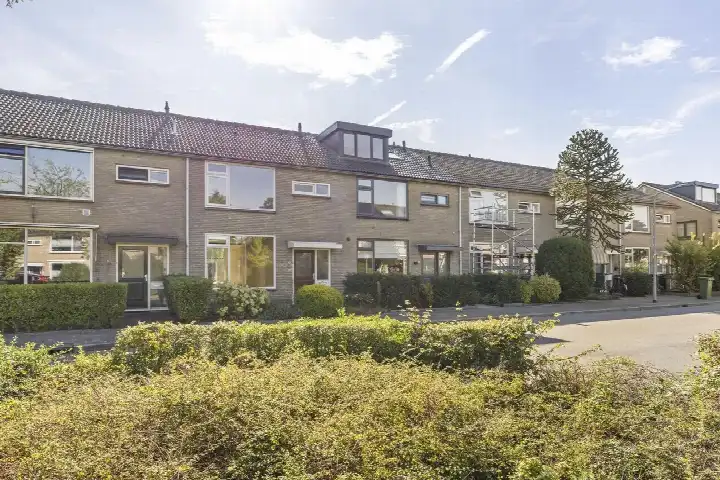
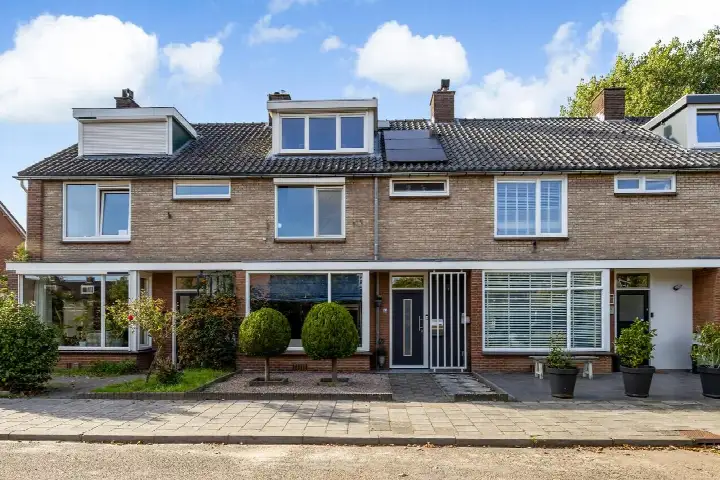
In Kerkelanden there are 3.046 homes with an average assessed value (WOZ) of €359.000. Of these, around 97% are occupied and 3% unoccupied. Most homes are rental properties. This amounts to 62% rental homes and 38% owner-occupied homes. Of the homes, 38% privately owned, 40% owned by housing associations and 22% owned by other landlords. The most common construction periods in Kerkelanden are 1950-1970 (44%) and 1970-1980 (32%).
There are currently 24 homes for sale in Kerkelanden. The most recently listed home is Lutherhof 36 by CORPOwonen op Funda. Over the past year, 61 homes were sold in Kerkelanden. On average, a home was sold within 30 days.
The average asking price for a home for sale in Kerkelanden over the past year was €442.036. This is 23% higher than the average assessed value (WOZ) of €359.000. The average asking price per m² of plot is €5.023.
There are 5 homes for rent in Kerkelanden. The most recent home is Franciscusweg 27, offered by ikwilhuren.nl. Over the past year, 64 homes were let in Kerkelanden. On average, a listing was let within 39 days.
The average rent for a rental home in Kerkelanden over the past year was €1.436 per month. Per m² of plot area that is €18 per month.
In Kerkelanden there are 2.137 addresses with a registered energy label. The most common labels are A (37%), B (27%) and C (25%). On average, an address in Kerkelanden uses 2.090 kWh of electricity per year. This is 18% below the national average of 2.550 kWh. With an annual consumption of 780 m³ per address, natural gas consumption is 3% below the national average of 800 m³.
Safe neighbourhood, occasionally some nuisance from young people
Auto-translated to English by AIKerkelanden is very safe during the day, at night there is sometimes some nuisance but hardly anything that bothers you. Public transport connection is relatively good, bus goes every 15 minutes during the day and every 30 minutes in the evening, which could be improved to make public transport better for young people who want to go out in the evening.
Auto-translated to English by AIThe apartment where I live is very noisy. If you don't get along with the neighbours, you can follow their every move. Safety has also deteriorated greatly in the neighbourhood. Fireworks are thrown at people and animals, things are being demolished, set on fire, and rapidly falling into disrepair. It's a green neighbourhood, but a strange nature policy is applied. Every week/day, mowing or leaf removal is done with the necessary noise! Clean and tidy takes precedence over the welfare of the animals, unfortunately! The cosiness is hard to find, unfortunately!
Auto-translated to English by AITerrible neighbourhood, sad how it's going downhill and Moroccans try to call the shots. Neighbourhood police and BOA are nowhere to be seen. Lots of traffic nuisance Assaults, stabbings caught on camera. Intimidation
Auto-translated to English by AIIt's a nice neighbourhood but public transport is terrible.
Auto-translated to English by AIKerkelanden is a cosy neighbourhood with many elderly people. All amenities are nearby in Kerkelanden shopping centre. Plenty of sports facilities with a small swimming pool and various gyms. It is generally quiet in the neighbourhood, with a few exceptions. Downsides for me are that there is little greenery and a lot of traffic.
Auto-translated to English by AIThe housing stock is mainly post-war — 100% was built between 1945 and 1990. In addition, the most common type is flats (53%).
Over the past year a home for sale in Kerkelanden was listed for an average of €421,197 (€4,541 per m²). That is 20% below the Dutch national average. Last quarter prices fell by 11%.
A rental home in Kerkelanden cost an average of €1,069 per month (€17 per m²). That is 50% below the national average.
Residents give Kerkelanden a 6.5 out of 10 based on 6 reviews. The strongest score is for amenities (7.5), the weakest for housing (5.3).
Buurt Kerkelanden has 6,025 residents. The largest age group is 65+ years (31%).
The housing supply in Kerkelanden is remarkably efficient: 66% has an A, A+ or B label. The average natural gas consumption per household is 780 m³ per year.
From Kerkelanden you can on average reach a supermarket at 0.9 km, a GP at 1.0 km, a railway station at 4.3 km, a primary school at 1.0 km (as the crow flies, source: CBS).
Right now you will find 21 homes for sale and 1 homes for rent in Kerkelanden.