Neighbourhood in Rotterdam
Lombardijen is located in the province of Zuid-Holland, in the municipality of Rotterdam, in the district IJsselmonde The neighbourhood has a total area of 263 hectares, of which 261 hectares are land and 1 hectares are water. The neighbourhood is coded as BU05991284. The postcode area is 3076AA-3079DA.
17 residents rate the neighbourhood as more than satisfactory with a score of 6.8. They describe it as '(Deels)geboren en getogen', 'Quiet' and 'Decent neighbourhood'. Aspects such as accessibility, education, greenery are rated well in this neighbourhood, while community and cleanliness score less well.
Lombardijen has 15.565 residents. Of these, 50,0% are men and 50,0% are women. Most residents are 25 to 45 years (31,8%). The other age groups are 22,1% for '45 to 65 years', 18,9% for '0 to 15 years', 15,4% for '65 years or older' and 11,8% for '15 to 25 years'. Of the residents, 58,1% is unmarried, 27,0% is married, 11,0% is divorced and 3,9% is widowed. 5.220 residents originate from the Netherlands, 1.965 come from Europe and 8.375 come from countries outside Europe.
There are 7.480 households in Lombardijen. 47,5% of these are single-person households, 17,8% households without children and 34,6% households with children. The average household size is 2,0 persons. The national average is 2,1 persons.
In Lombardijen there are 11.300 income recipients. The average income per income recipient is €33.700, which is €8.500 (20%) lower than the national average of €42.200. Per resident, the average income is €26.200, which is €8.700 (25%) lower than the national average of €34.900. Most residents of Lombardijen are educated to an intermediate level. 41,6% have an intermediate education (HAVO, VWO or MBO 2-4), 40,4% have a lower education (VMBO or MBO 1) and 18,0% have a university or higher professional education (HBO/WO).
Of the 15.565 residents, around 64% are in paid employment, which amounts to 9.962 people. This is 8% lower than the national average of 72%. The majority of workers are in salaried employment (82%), while 18% are self-employed. In Lombardijen, 25% of residents receive a benefit. The largest group is those receiving a state pension (AOW). 2.050 people receive this benefit.
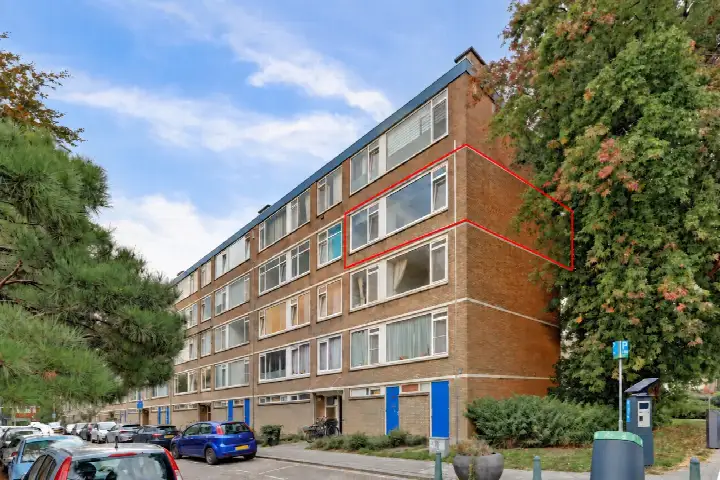
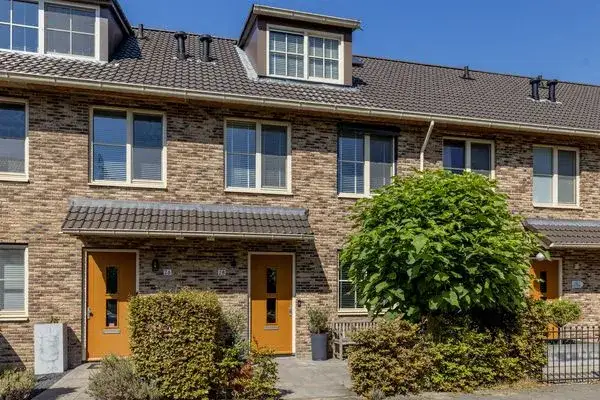
In Lombardijen there are 7.321 homes with an average assessed value (WOZ) of €261.000. Of these, around 94% are occupied and 6% unoccupied. Most homes are rental properties. This amounts to 69% rental homes and 31% owner-occupied homes. Of the homes, 31% privately owned, 51% owned by housing associations and 18% owned by other landlords. The most common construction periods in Lombardijen are 1950-1970 (71%) and 2010-2020 (7%).
There are currently 62 homes for sale in Lombardijen. The most recently listed home is Socratesstraat 174 by Zuidstad Makelaars op Funda. Over the past year, 337 homes were sold in Lombardijen. On average, a home was sold within 57 days.
The average asking price for a home for sale in Lombardijen over the past year was €323.320. This is 24% higher than the average assessed value (WOZ) of €261.000. The average asking price per m² of plot is €3.170.
There are 4 homes for rent in Lombardijen. The most recent home is Spinozaweg 251, offered by Rental Rotterdam. Over the past year, 99 homes were let in Lombardijen. On average, a listing was let within 26 days.
The average rent for a rental home in Lombardijen over the past year was €1.488 per month. Per m² of plot area that is €30 per month.
In Lombardijen there are 5.671 addresses with a registered energy label. The most common labels are C (32%), D (15%) and A (15%). On average, an address in Lombardijen uses 2.130 kWh of electricity per year. This is 16% below the national average of 2.550 kWh. With an annual consumption of 660 m³ per address, natural gas consumption is 18% below the national average of 800 m³.
Over het algemeen is alles goed bereikbaar. Ik woon hier al jaren en het is uiteraard een mening.
Auto-translated to English by AII think that neighbourhood is completely quiet
Auto-translated to English by AIDecent neighbourhood with everything at hand such as shops, hospital, public transport, etc.
Auto-translated to English by AILively neighbourhood with everything at hand such as shops, hospital
Auto-translated to English by AIIt's a shame that so much rubbish is thrown outside the bins in the neighbourhood, and that bulky waste is not reported by residents, resulting in a lot of litter and vermin.
Auto-translated to English by AIUnfortunately, Lombardijen has deteriorated significantly, especially in the last 10 years. You can see it visibly becoming impoverished, which is such a shame for such a beautiful neighbourhood that always had a reputation as a nice, clean, tidy neighbourhood. Unfortunately, both the residents and certainly the municipality of Rotterdam contribute to this. Safety is hard to find, drug nuisance, nuisance at the underground containers where all household items are just dumped. Rubbish on the street, which a number of residents try to keep up with by regularly picking it up, otherwise we see the rats and mice dancing merrily around the containers. And this is just a small impression of the waste pit of Rotterdam. The municipality must stop cutting costs and handing out fewer bonuses to the higher-ups, use money for the neighbourhoods and ensure that it becomes liveable again for the real Rotterdammers.
Auto-translated to English by AIIt's a decent neighbourhood but there could be improvements like more bins and more cleaning of the rubbish on the street.
Auto-translated to English by AII think it has really gone downhill. I've lived here for almost 10 years now and see no improvement in my neighbourhood or area. In my apartment building itself it has deteriorated, not much is done about it. You can tell that Lombardij has become more of a deprived neighbourhood. I no longer enjoy living here. I am also looking for another social housing outside Rotterdam.
Auto-translated to English by AIThe housing stock is mainly post-war — 84% was built between 1945 and 1990. In addition, the most common type is flats (71%).
Over the past year a home for sale in Lombardijen was listed for an average of €336,041 (€3,772 per m²). That is 36% below the Dutch national average.
A rental home in Lombardijen cost an average of €1,367 per month (€17 per m²). That is 37% below the national average.
Residents give Lombardijen a 6.8 out of 10 based on 17 reviews. The strongest score is for accessibility (7.8), the weakest for cleanliness (5.3).
Buurt Lombardijen has 15,565 residents. The largest age group is 25 to 45 years (32%). Many families: 35% of the households have children.
A considerable share of the supply in Lombardijen is less efficient: 37% has an E, F or G label. The average natural gas consumption per household is 660 m³ per year.
From Lombardijen you can on average reach a supermarket at 0.6 km, a GP at 0.5 km, a railway station at 1.1 km, a primary school at 0.6 km (as the crow flies, source: CBS).
Right now you will find 66 homes for sale and 8 homes for rent in Lombardijen.