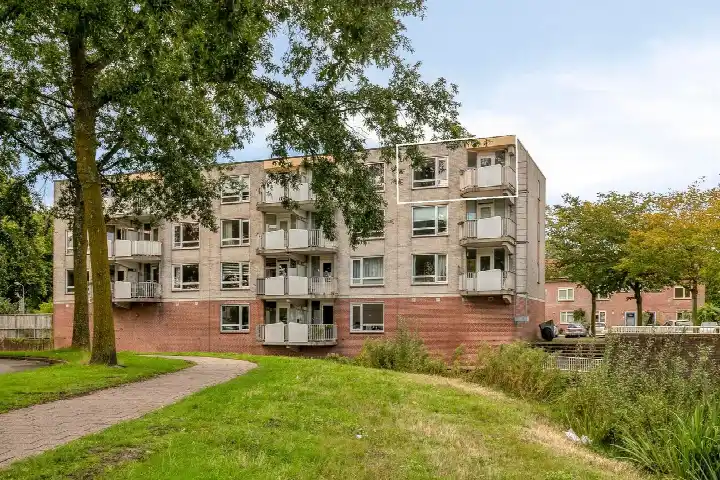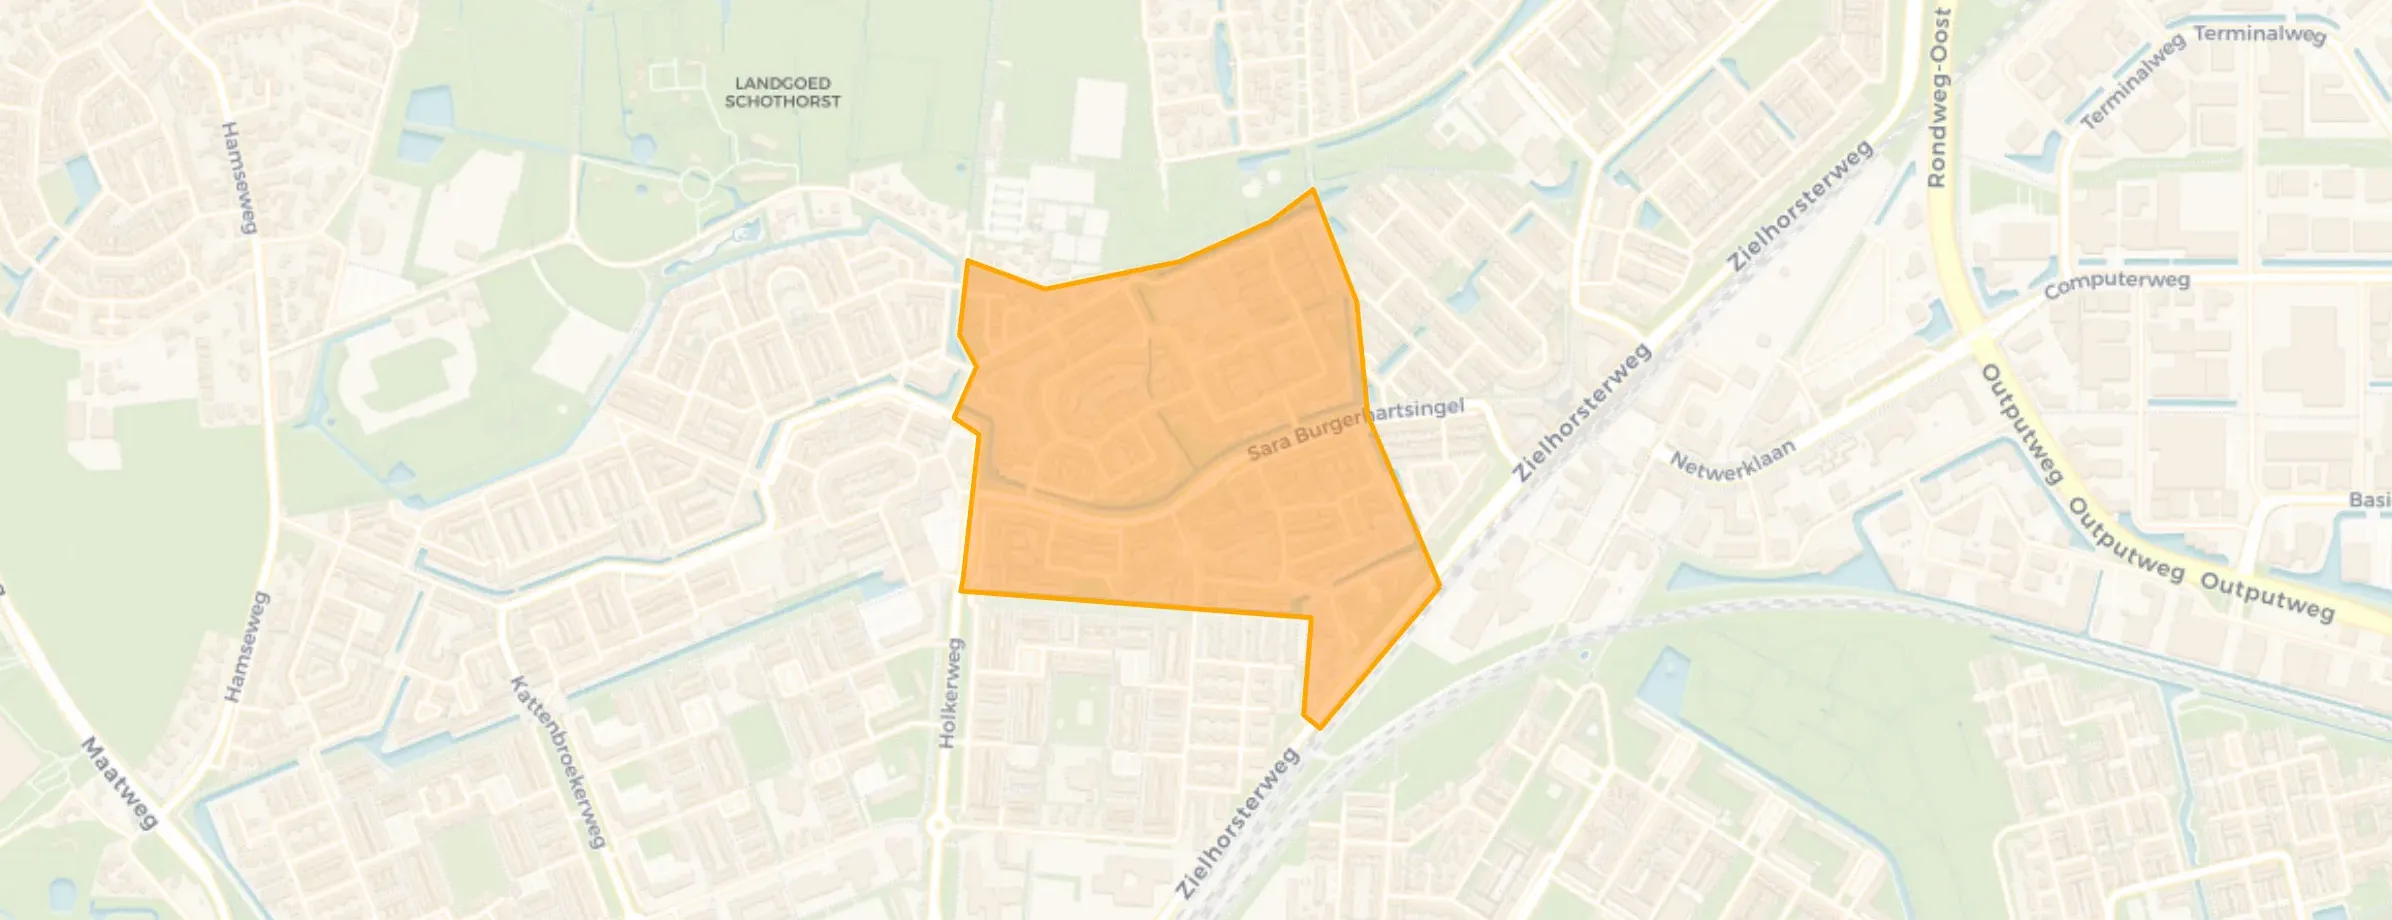
Queekhoven en omgeving is located in the province of Utrecht, in the municipality of Amersfoort, in the district Schothorst-Noord. The neighbourhood has a total area of 31 hectares, of which 30 hectares are land and 1 hectares are water. The neighbourhood is coded as BU03070903. The postcode area is 3813KG-3822NB.
Two residents rate the neighbourhood as good with a score of 7.6. They describe it as 'Beautiful neighbourhood with lots of nature!' and 'Beautiful neighbourhood with a few small points for improvement!'. Based on a limited number of reviews, no clear trends are visible yet in this neighbourhood.
Queekhoven en omgeving has 2.160 residents. Of these, 48,6% are men and 51,4% are women. Most residents are 45 to 65 years (25,7%). The other age groups are 25,5% for '25 to 45 years', 25,2% for '65 years or older', 15,0% for '0 to 15 years' and 8,6% for '15 to 25 years'. Of the residents, 46,1% is unmarried, 40,3% is married, 9,7% is divorced and 3,7% is widowed. 1.570 residents originate from the Netherlands, 100 come from Europe and 485 come from countries outside Europe.
There are 1.050 households in Queekhoven en omgeving. 39,5% of these are single-person households, 31,0% households without children and 29,5% households with children. The average household size is 2,0 persons. The national average is 2,1 persons.
In Queekhoven en omgeving there are 1.800 income recipients. The average income per income recipient is €36.200, which is €6.000 (14%) lower than the national average of €42.200. Per resident, the average income is €30.500, which is €4.400 (13%) lower than the national average of €34.900. Most residents of Queekhoven en omgeving are highly educated. 36,1% have a university or higher professional education (HBO/WO), 35,5% have an intermediate education (HAVO, VWO or MBO 2-4) and 28,4% have a lower education (VMBO or MBO 1).
Of the 2.160 residents, around 65% are in paid employment, which amounts to 1.404 people. This is 7% lower than the national average of 72%. The majority of workers are in salaried employment (86%), while 14% are self-employed. In Queekhoven en omgeving, 32% of residents receive a benefit. The largest group is those receiving a state pension (AOW). 480 people receive this benefit.
In Queekhoven en omgeving there are 1.030 homes with an average assessed value (WOZ) of €374.000. Of these, around 99% are occupied and 1% unoccupied. In Queekhoven en omgeving there are roughly as many rental as owner-occupied homes. This amounts to 48% rental homes and 52% owner-occupied homes. Of the homes, 52% privately owned, 47% owned by housing associations and 1% owned by other landlords. The most common construction periods in Queekhoven en omgeving are 1980-1990 (97%) and 1990-2000 (1%).
There are currently 5 homes for sale in Queekhoven en omgeving. The most recently listed home is Ruigenhof 29 by Negenplus Makelaars Amersfoort op Funda. Over the past year, 20 homes were sold in Queekhoven en omgeving. On average, a home was sold within 26 days.
The average asking price for a home for sale in Queekhoven en omgeving over the past year was €466.850. This is 25% higher than the average assessed value (WOZ) of €374.000. The average asking price per m² of floor area is €4.820.
There are currently no homes for rent in Queekhoven en omgeving. The most recent home is Batostraat 16, offered by Huispedia. Over the past year, 1 homes were let in Queekhoven en omgeving. On average, a listing was let within 15 days.
The average rent for a rental home in Queekhoven en omgeving over the past year was €1.850 per month. Per m² of floor area that is €16 per month.
In Queekhoven en omgeving there are 690 addresses with a registered energy label. The most common labels are B (39%), C (34%) and A (25%). On average, an address in Queekhoven en omgeving uses 2.040 kWh of electricity per year. This is 20% below the national average of 2.550 kWh. With an annual consumption of 710 m³ per address, natural gas consumption is 11% below the national average of 800 m³.
There's a relaxed atmosphere here in the neighbourhood. Everyone gets along well. Unfortunately, we do regularly have trouble with loitering youths, especially in the evenings. This gives a rather unsafe feeling, as I've also heard stories of street robberies. We would therefore like to see more police presence, as there is hardly any here. There are many schools in the area, so that's fine. There are also plenty of supermarkets, as well as snack bars and cinemas, for example. The city centre is also close by. It's reasonably clean here, but it could be better. The neighbourhood is easily accessible by car, bike, and on foot.
Auto-translated to English by AII've lived here for 12 years and it's truly a beautiful neighbourhood! However, we regularly have trouble with young people hanging around the school playground. We also see very little police, which is a real shame. Our street is very cosy, but unfortunately it's not like we regularly visit each other for coffee or anything, I'd like to see more of that. The neighbourhood is easily accessible by both public transport and car. There are more than enough amenities in the area, such as supermarkets, sports clubs, playgrounds, schools, etc. As mentioned, there are many schools, both primary, secondary and higher education. Education here is actually very good. All in all, it's a very nice, well-equipped and sociable neighbourhood, but we would really appreciate seeing more police.
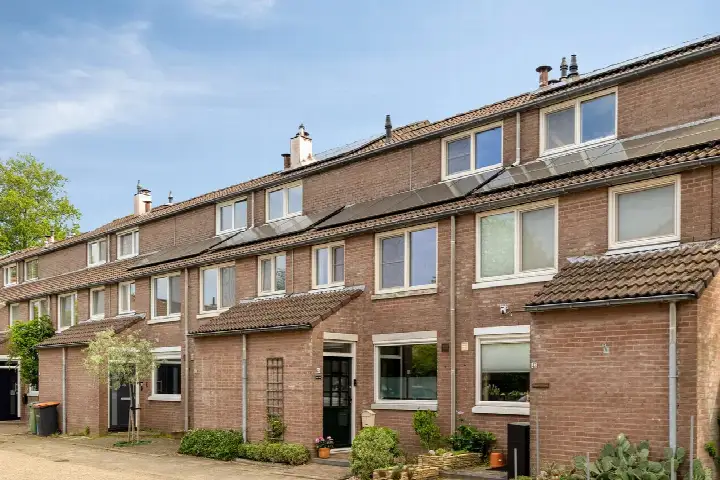
Auto-translated to English by AIThe housing stock is mainly post-war — 95% was built between 1945 and 1990. In addition, the most common type is terraced houses (50%).
Over the past year a home for sale in Queekhoven en omgeving was listed for an average of €466,850 (€4,820 per m²). That is 10% below the Dutch national average.
The housing supply in Queekhoven en omgeving is remarkably efficient: 58% has an A, A+ or B label. The average natural gas consumption per household is 710 m³ per year.
From Queekhoven en omgeving you can on average reach a supermarket at 0.5 km, a GP at 0.8 km, a railway station at 1.2 km, a primary school at 0.4 km (as the crow flies, source: CBS).