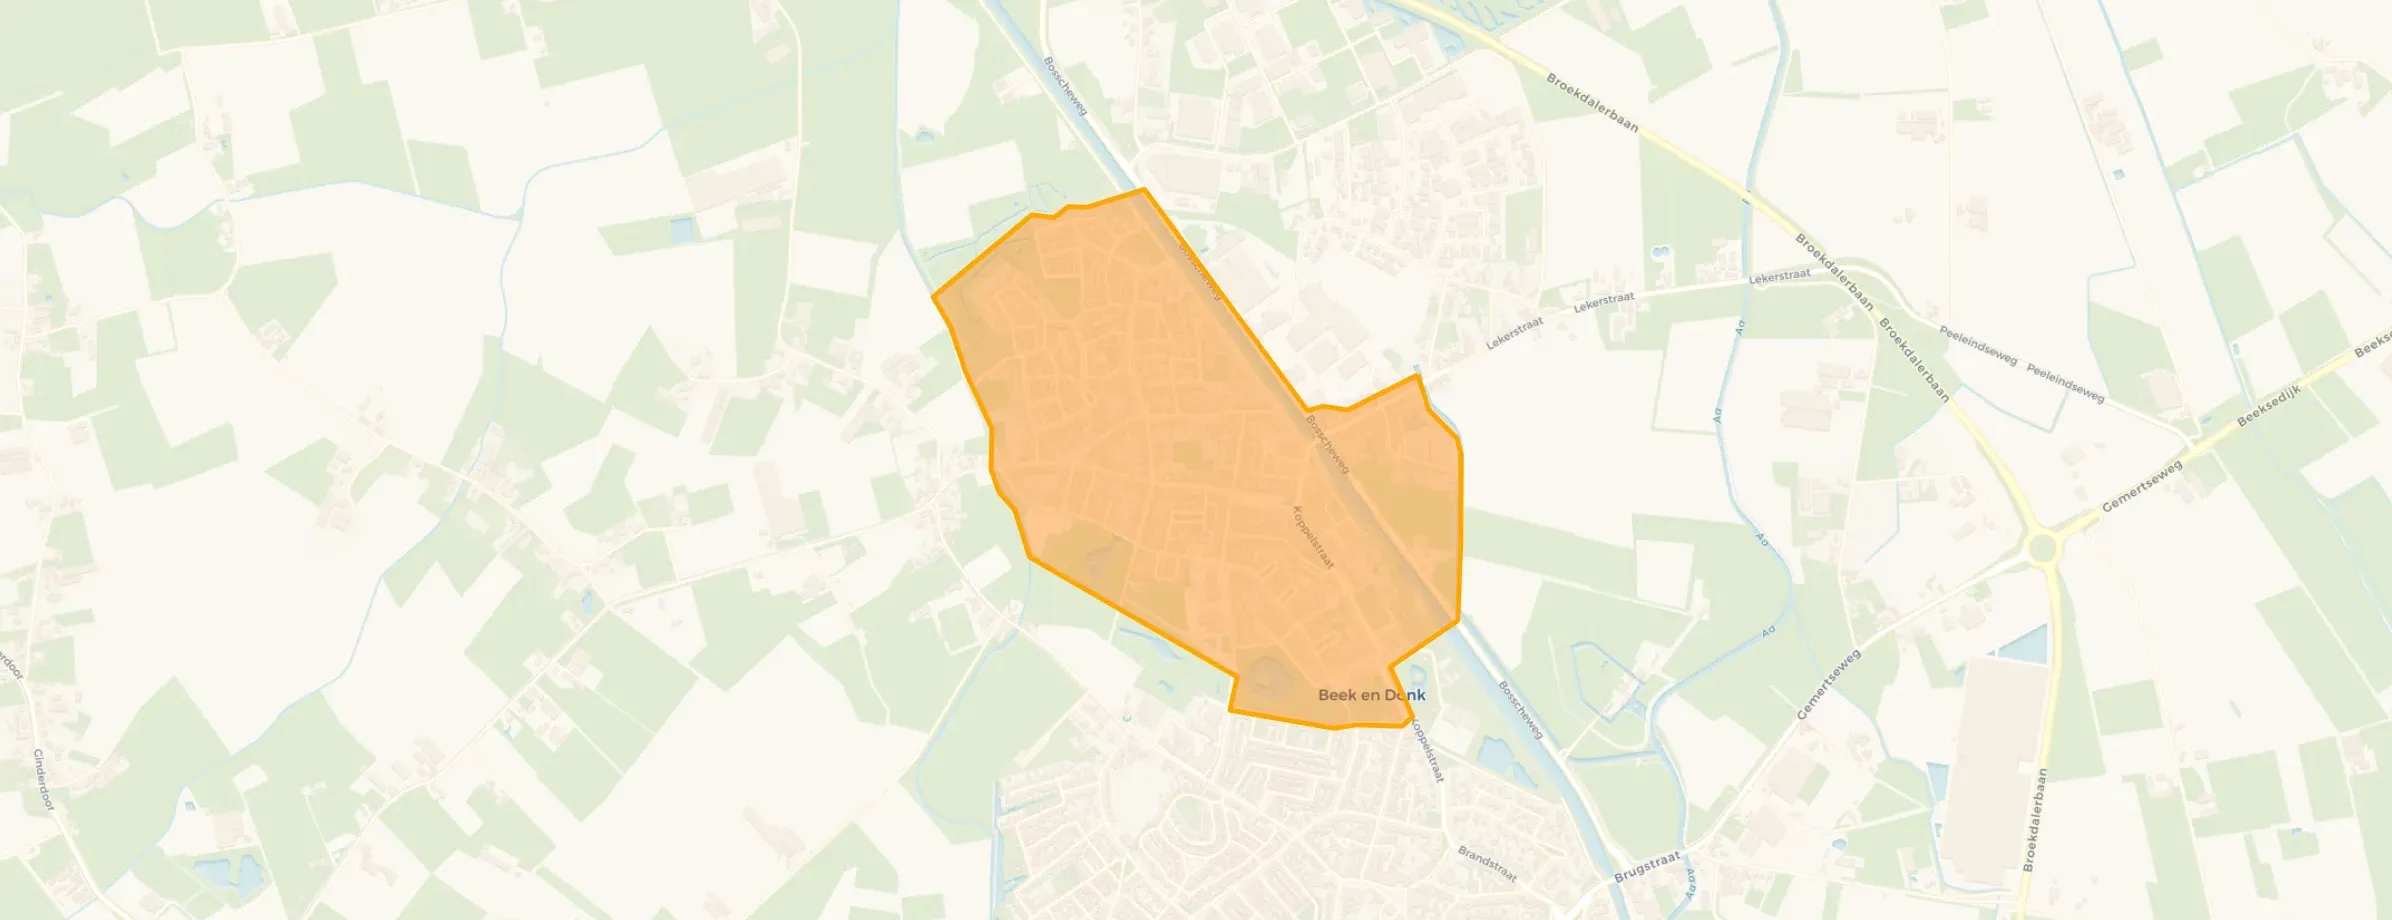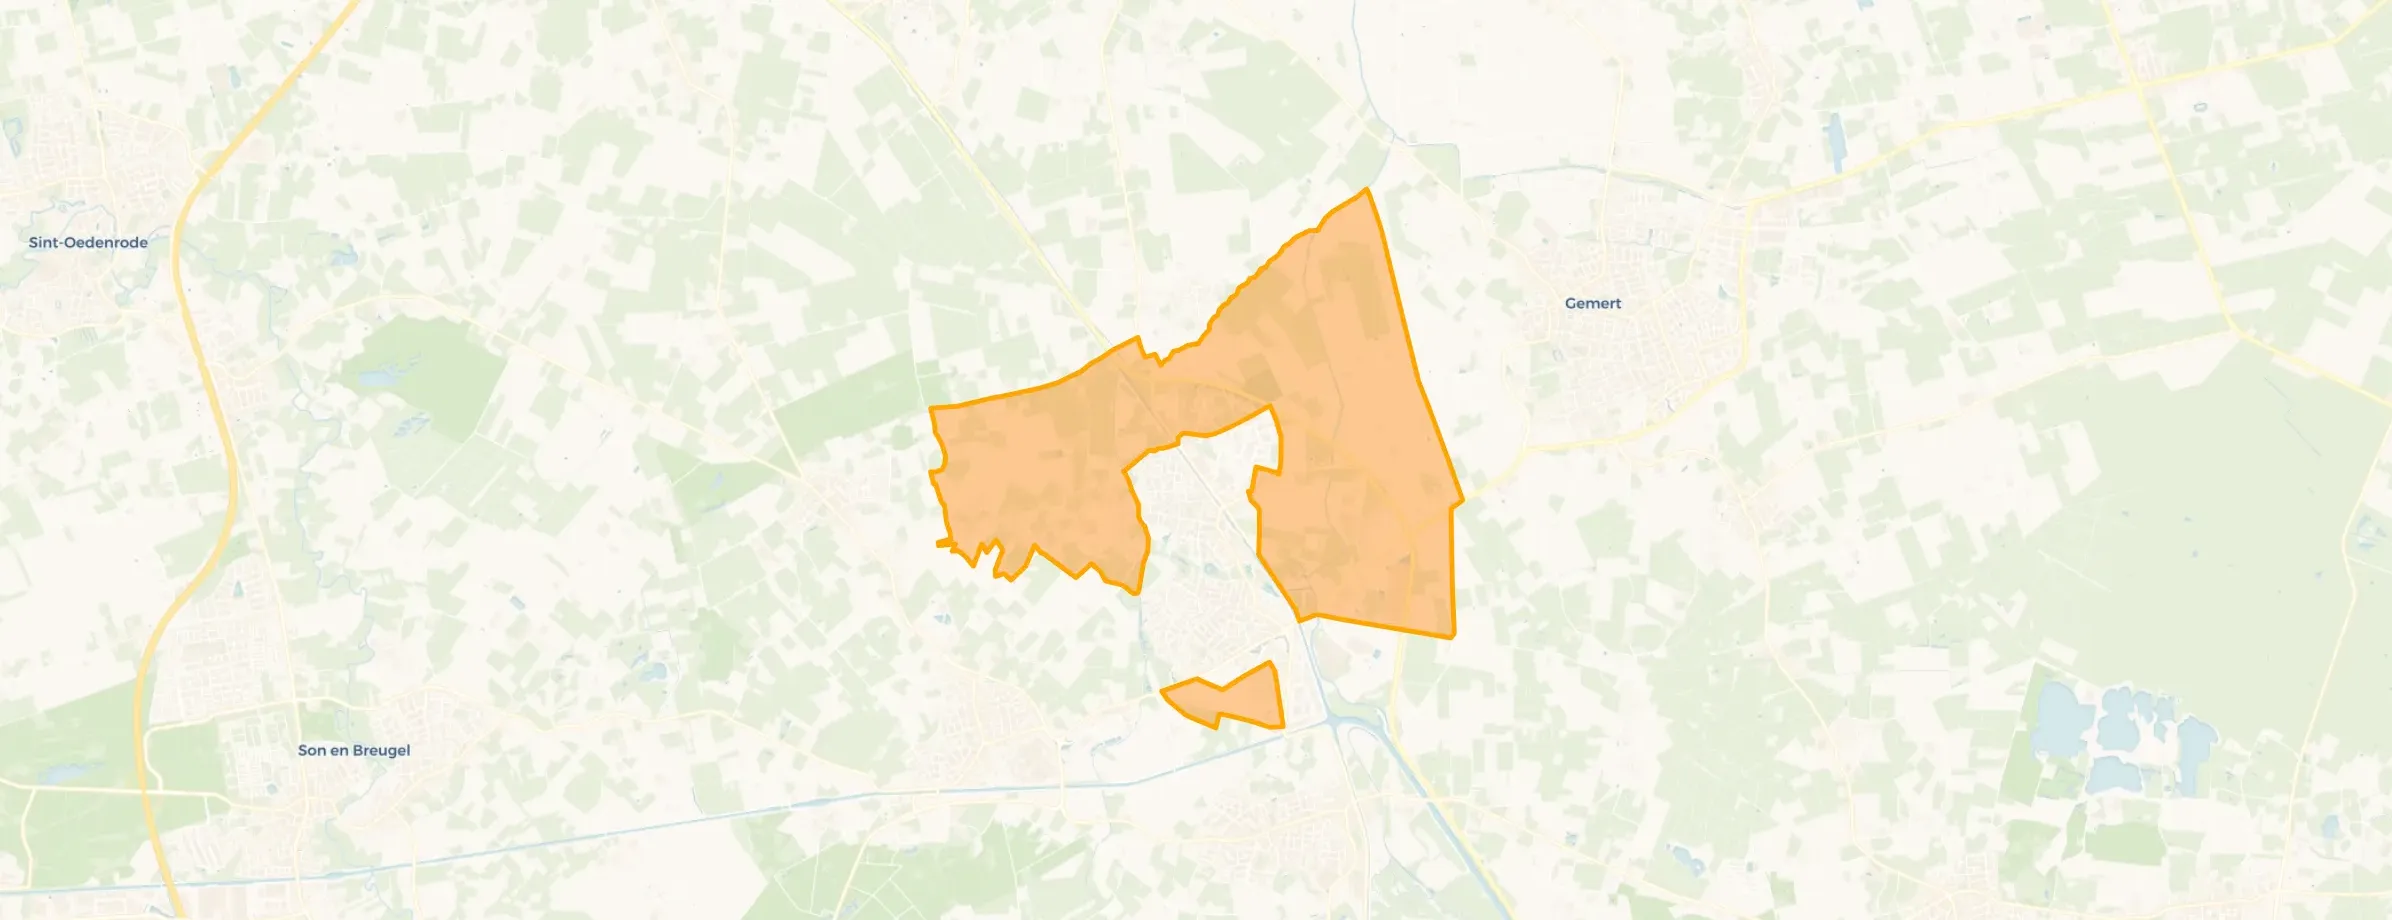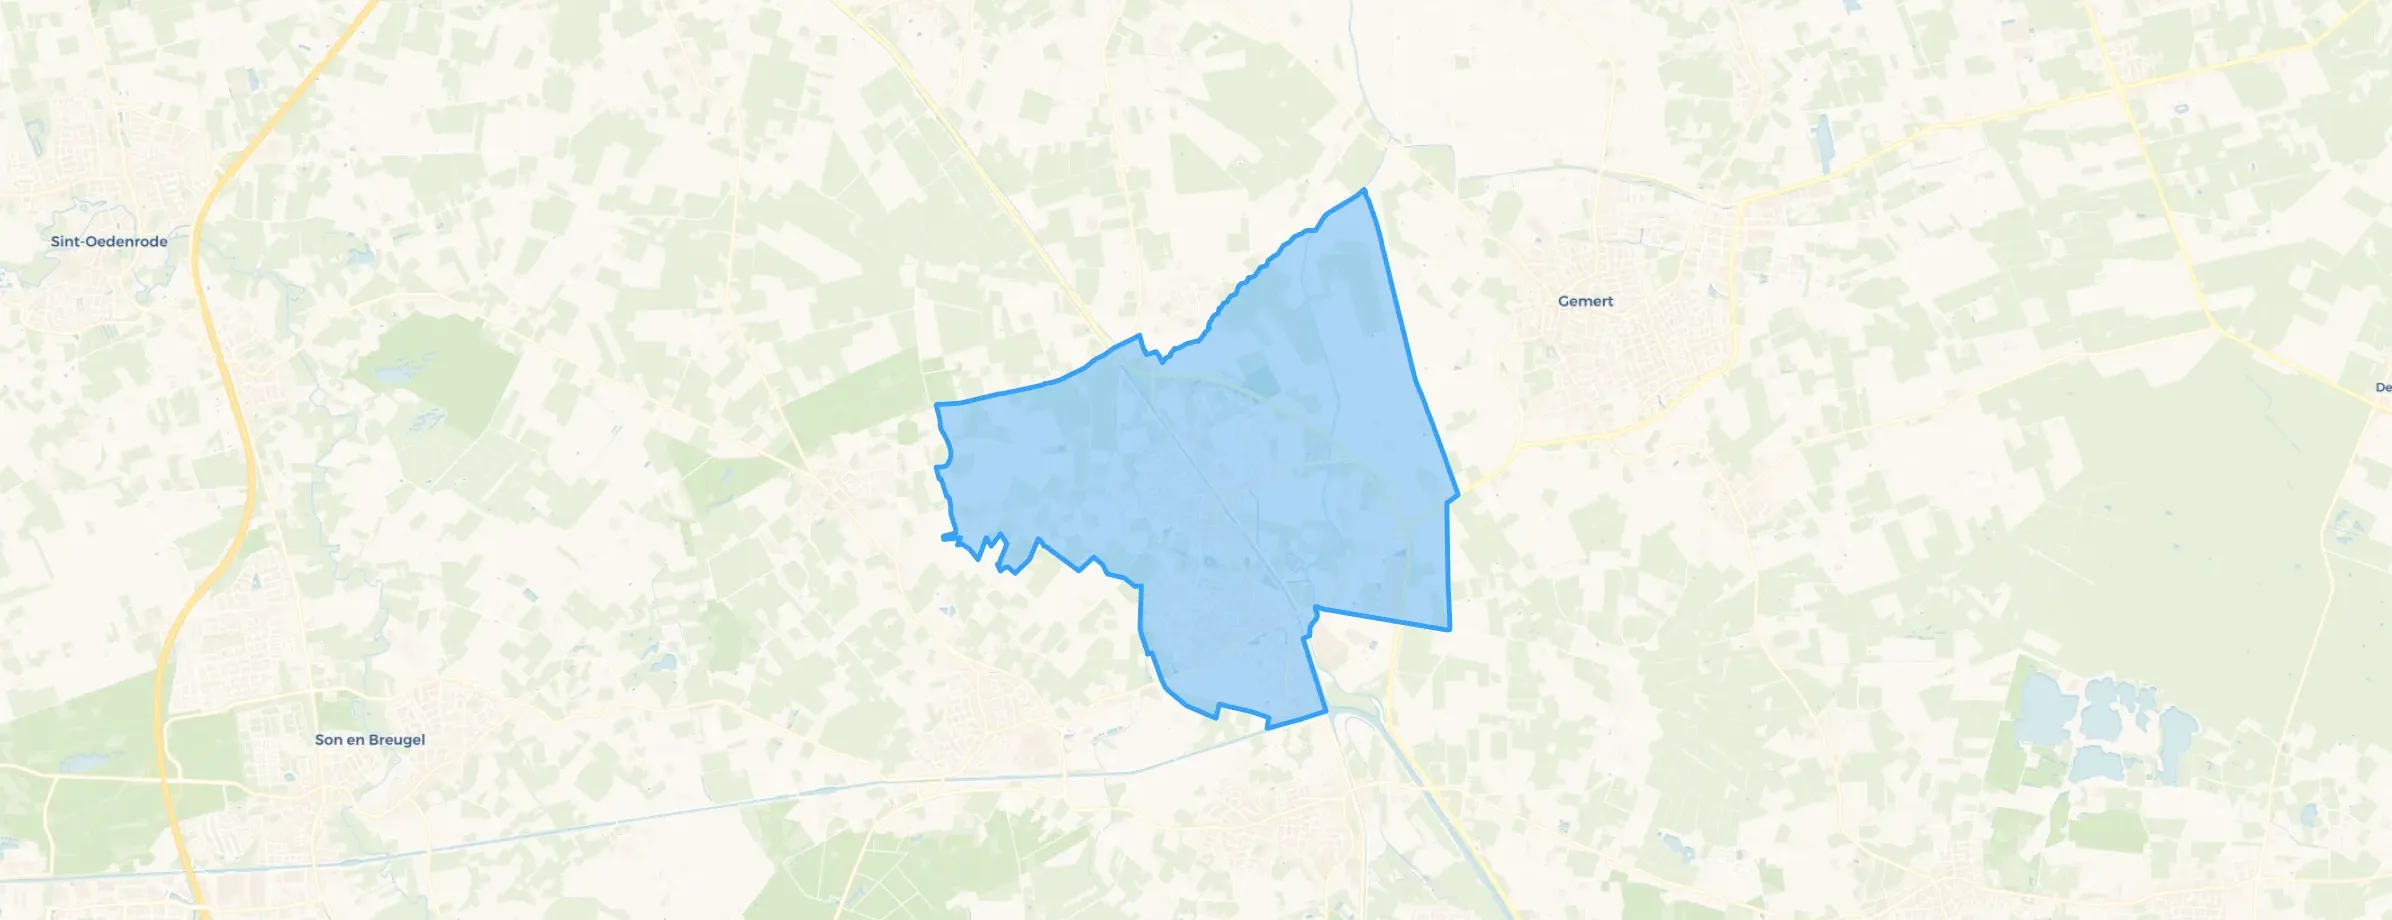
District in Laarbeek
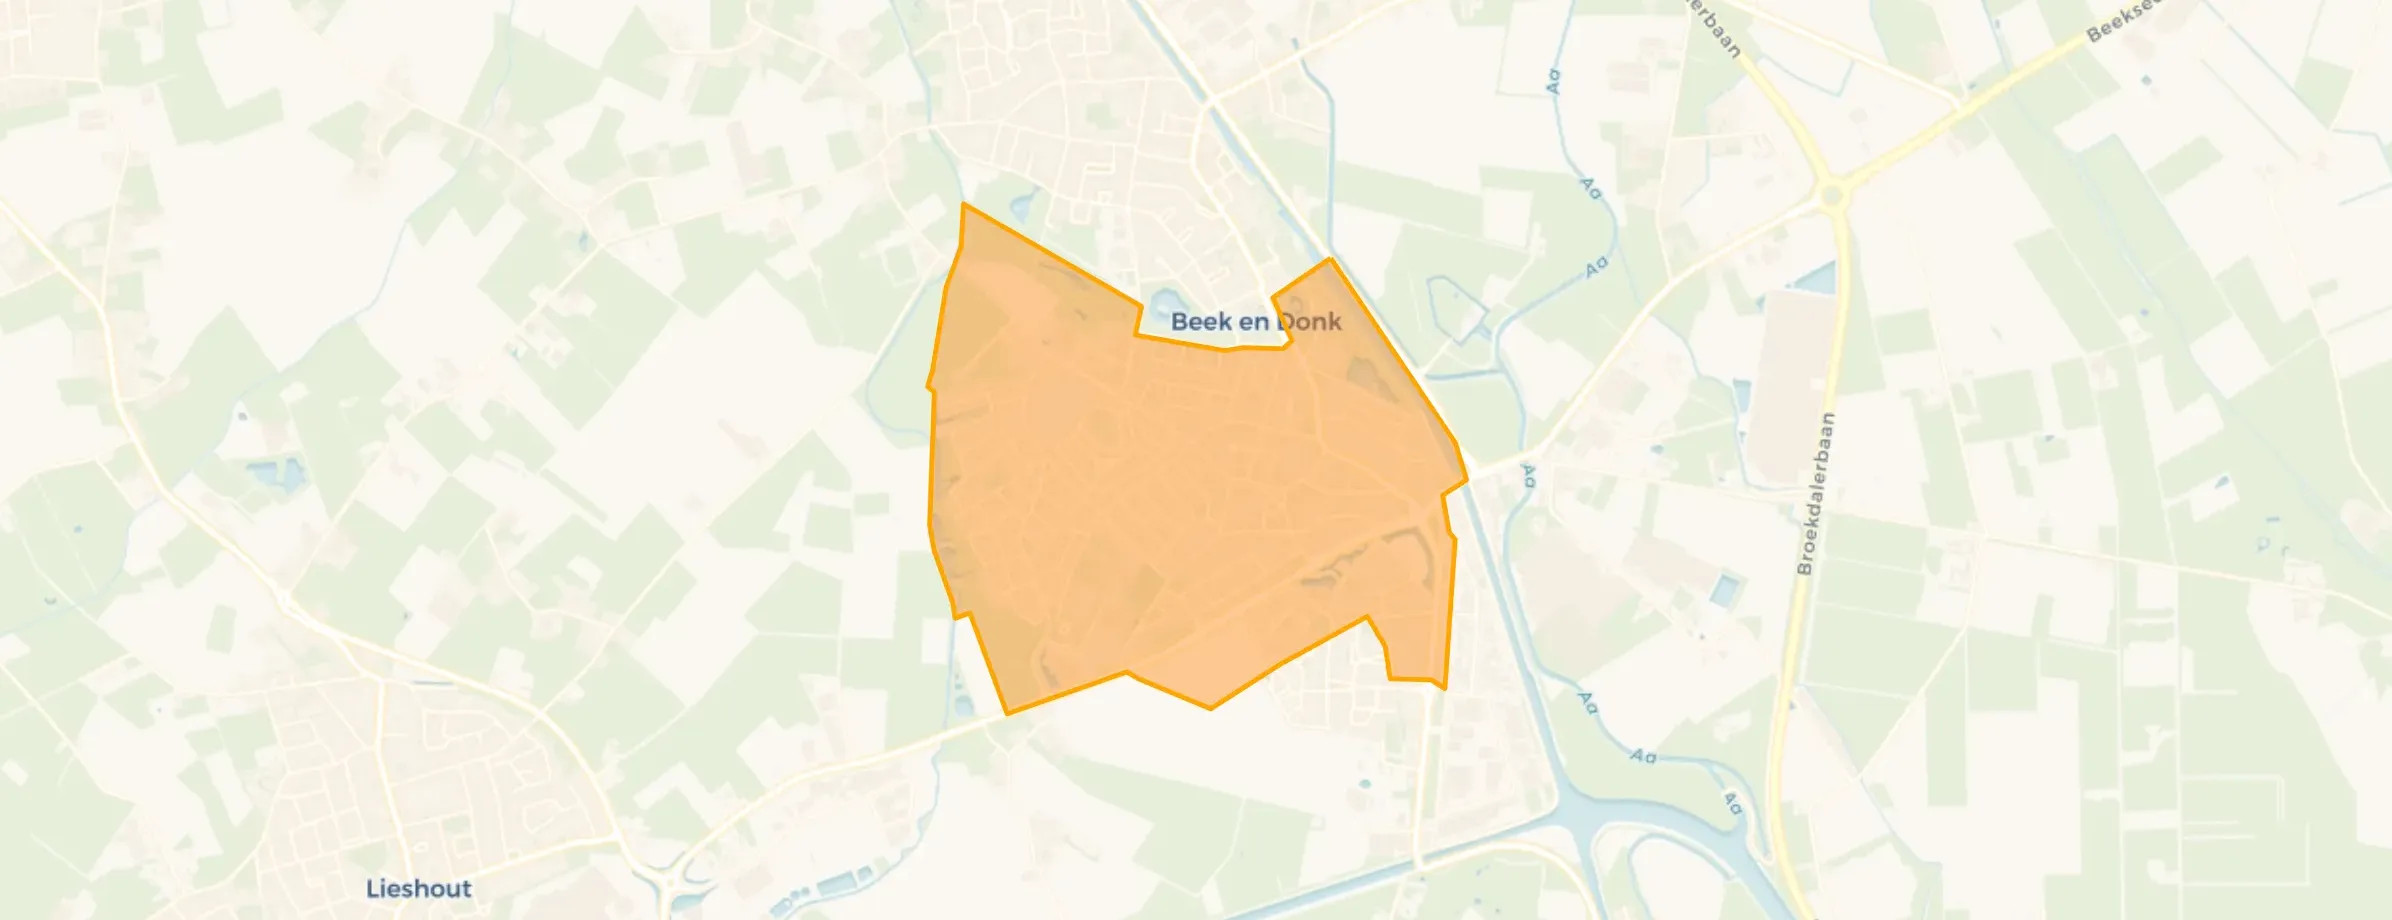
Beek en Donk is located in the province of Noord-Brabant, in the municipality of Laarbeek The district has a total area of 1.680 hectares, of which 1.654 hectares are land and 26 hectares are water. The district is coded as WK165900. The postcode area is 5741AR-5741XZ.
Beek en Donk has 11.055 residents. Of these, 50,6% are men and 49,5% are women. Most residents are 45 to 65 years (25,4%). The other age groups are 24,9% for '25 to 45 years', 22,9% for '65 years or older', 16,4% for '0 to 15 years' and 10,4% for '15 to 25 years'. Of the residents, 46,6% is unmarried, 40,8% is married, 7,1% is divorced and 5,6% is widowed. 9.485 residents originate from the Netherlands, 770 come from Europe and 800 come from countries outside Europe.
There are 4.750 households in Beek en Donk. 31,4% of these are single-person households, 31,5% households without children and 37,2% households with children. The average household size is 2,3 persons. The national average is 2,1 persons.
In Beek en Donk there are 8.900 income recipients. The average income per income recipient is €39.200, which is €3.000 (7%) lower than the national average of €42.200. Per resident, the average income is €32.400, which is €2.500 (7%) lower than the national average of €34.900. Most residents of Beek en Donk are educated to an intermediate level. 47,6% have an intermediate education (HAVO, VWO or MBO 2-4), 29,4% have a lower education (VMBO or MBO 1) and 23,0% have a university or higher professional education (HBO/WO).
Of the 11.055 residents, around 75% are in paid employment, which amounts to 8.291 people. This is 3% higher than the national average of 72%. The majority of workers are in salaried employment (83%), while 17% are self-employed. In Beek en Donk, 27% of residents receive a benefit. The largest group is those receiving a state pension (AOW). 2.280 people receive this benefit.
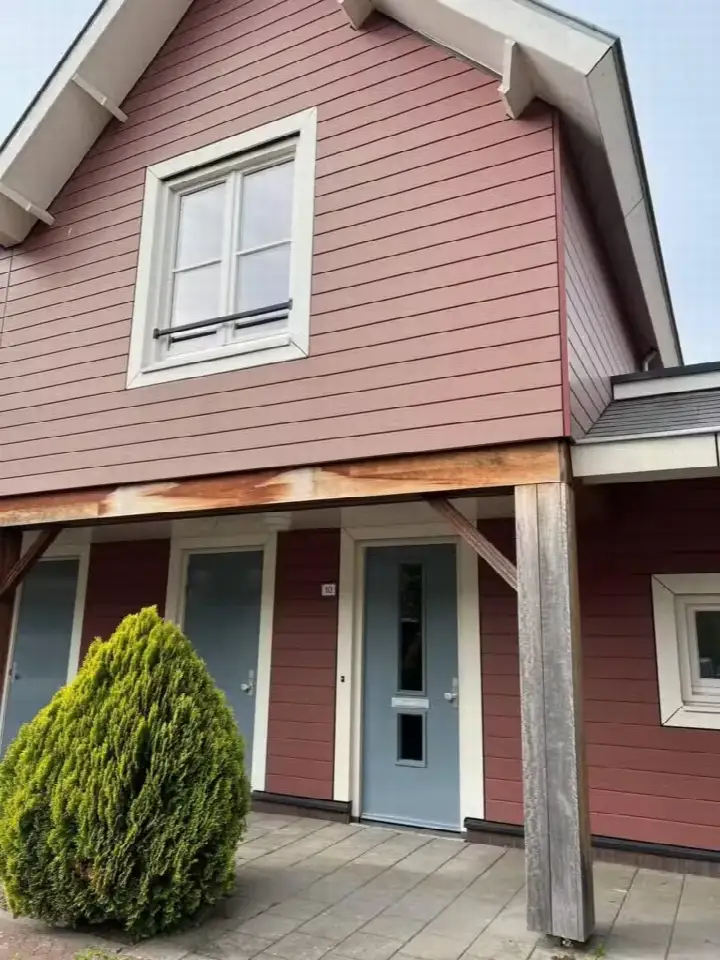
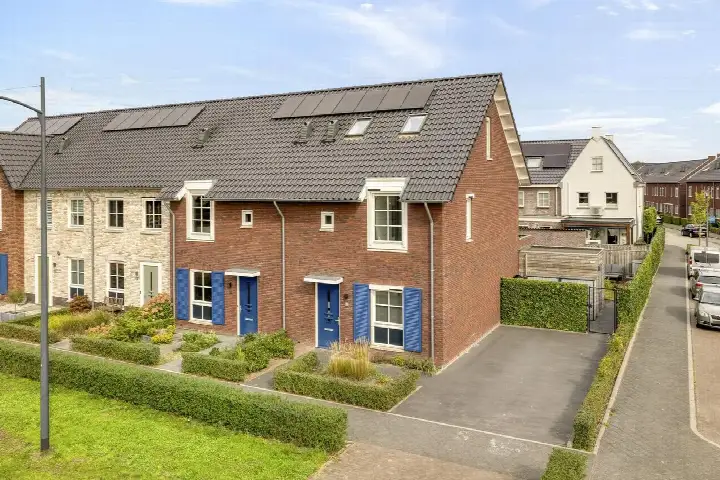
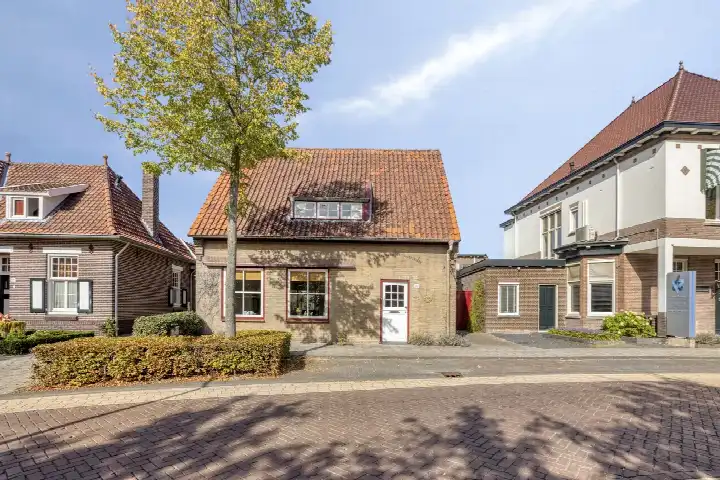
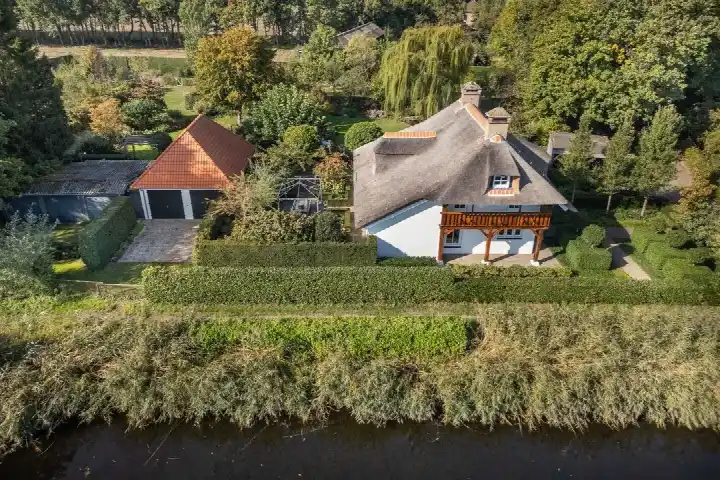
In Beek en Donk there are 4.867 homes with an average assessed value (WOZ) of €402.000. Of these, around 97% are occupied and 3% unoccupied. Most homes are owner-occupied. This amounts to 35% rental homes and 65% owner-occupied homes. Of the homes, 65% privately owned, 27% owned by housing associations and 8% owned by other landlords. The most common construction periods in Beek en Donk are 1950-1970 (20%) and 1970-1980 (20%).
There are currently no homes for sale in Beek en Donk. The most recently listed home is Leliestraat 86 by Wijman & Jansen ERA makelaars. No homes were sold in Beek en Donk over the past year.
There are currently no homes for rent in Beek en Donk. The most recent home is Lage Heesweg 88, offered by www.wooniezie.nl. No homes were let in Beek en Donk over the past year.
No recent rental data available for Beek en Donk.
In Beek en Donk there are 3.252 addresses with a registered energy label. The most common labels are A (37%), C (24%) and B (18%). On average, an address in Beek en Donk uses 2.900 kWh of electricity per year. This is 14% above the national average of 2.550 kWh. Natural gas consumption, at 900 m³ per year, is 13% above the national average of 800 m³.

It's really a nice area to live in, I've lived here all my life and never wanted to live anywhere else. Lots of amenities in the neighbourhood, enforcement officers who patrol regularly, also plenty of schools.
Auto-translated to English by AIApart from my neighbours, I actually have very little contact with anyone from the neighbourhood. When I meet someone on the street, I always say hello, and most people in the neighbourhood say hello back pleasantly. I like that. I also feel safe in my neighbourhood because nothing bad ever happens that would make me feel less safe. The education in the neighbourhood is fine; there are several primary schools and also a secondary school. I also think the greenery in the neighbourhood is good; there are quite a lot of trees and enough small parks where you can walk. Amenities, such as schools, supermarkets, drugstores, and restaurants, are also plentiful. Moreover, Beek is easily accessible, and all streets are tidy and accessible.
Auto-translated to English by AIEveryone gets along well with each other and it's quiet and well-maintained. No street litter or overflowing bins.
Auto-translated to English by AIWe live on a paved road where cars and motorcycles are allowed to drive 50 km/h. Previously, we had to cross the dangerous road. With and without small children!!! A few years ago, the municipality built a roundabout, making crossing safer and reducing the speed of cars. From Beek you can easily reach Helmond, Eindhoven, or the motorways to Nijmegen and Utrecht, Den Bosch, Venlo, etc. In this neighbourhood we have a WhatsApp neighbourhood watch and volunteers who walk a daily round through the village wearing an orange vest, where you can always go. The municipality keeps the trees and hedges along the road tidy, and there is almost never any litter in our neighbourhood.
Auto-translated to English by AIThe housing stock is mainly post-war — 59% was built between 1945 and 1990.
Over the past year a home for sale in Beek en Donk was listed for an average of €485,051 (€3,566 per m²). Last quarter prices rose by 40%.
Residents give Beek en Donk a 7.9 out of 10 based on 4 reviews. The strongest score is for accessibility (8.5), the weakest for cleanliness (7.3).
Wijk Beek en Donk has 11,055 residents. Many families: 37% of the households have children.
The housing supply in Beek en Donk is remarkably efficient: 52% has an A, A+ or B label. The average natural gas consumption per household is 900 m³ per year.
From Beek en Donk you can on average reach a supermarket at 0.8 km, a GP at 1.0 km, a railway station at 8.2 km, a primary school at 0.7 km (as the crow flies, source: CBS).
Right now you will find 46 homes for sale and 3 homes for rent in Beek en Donk.