District in Ede
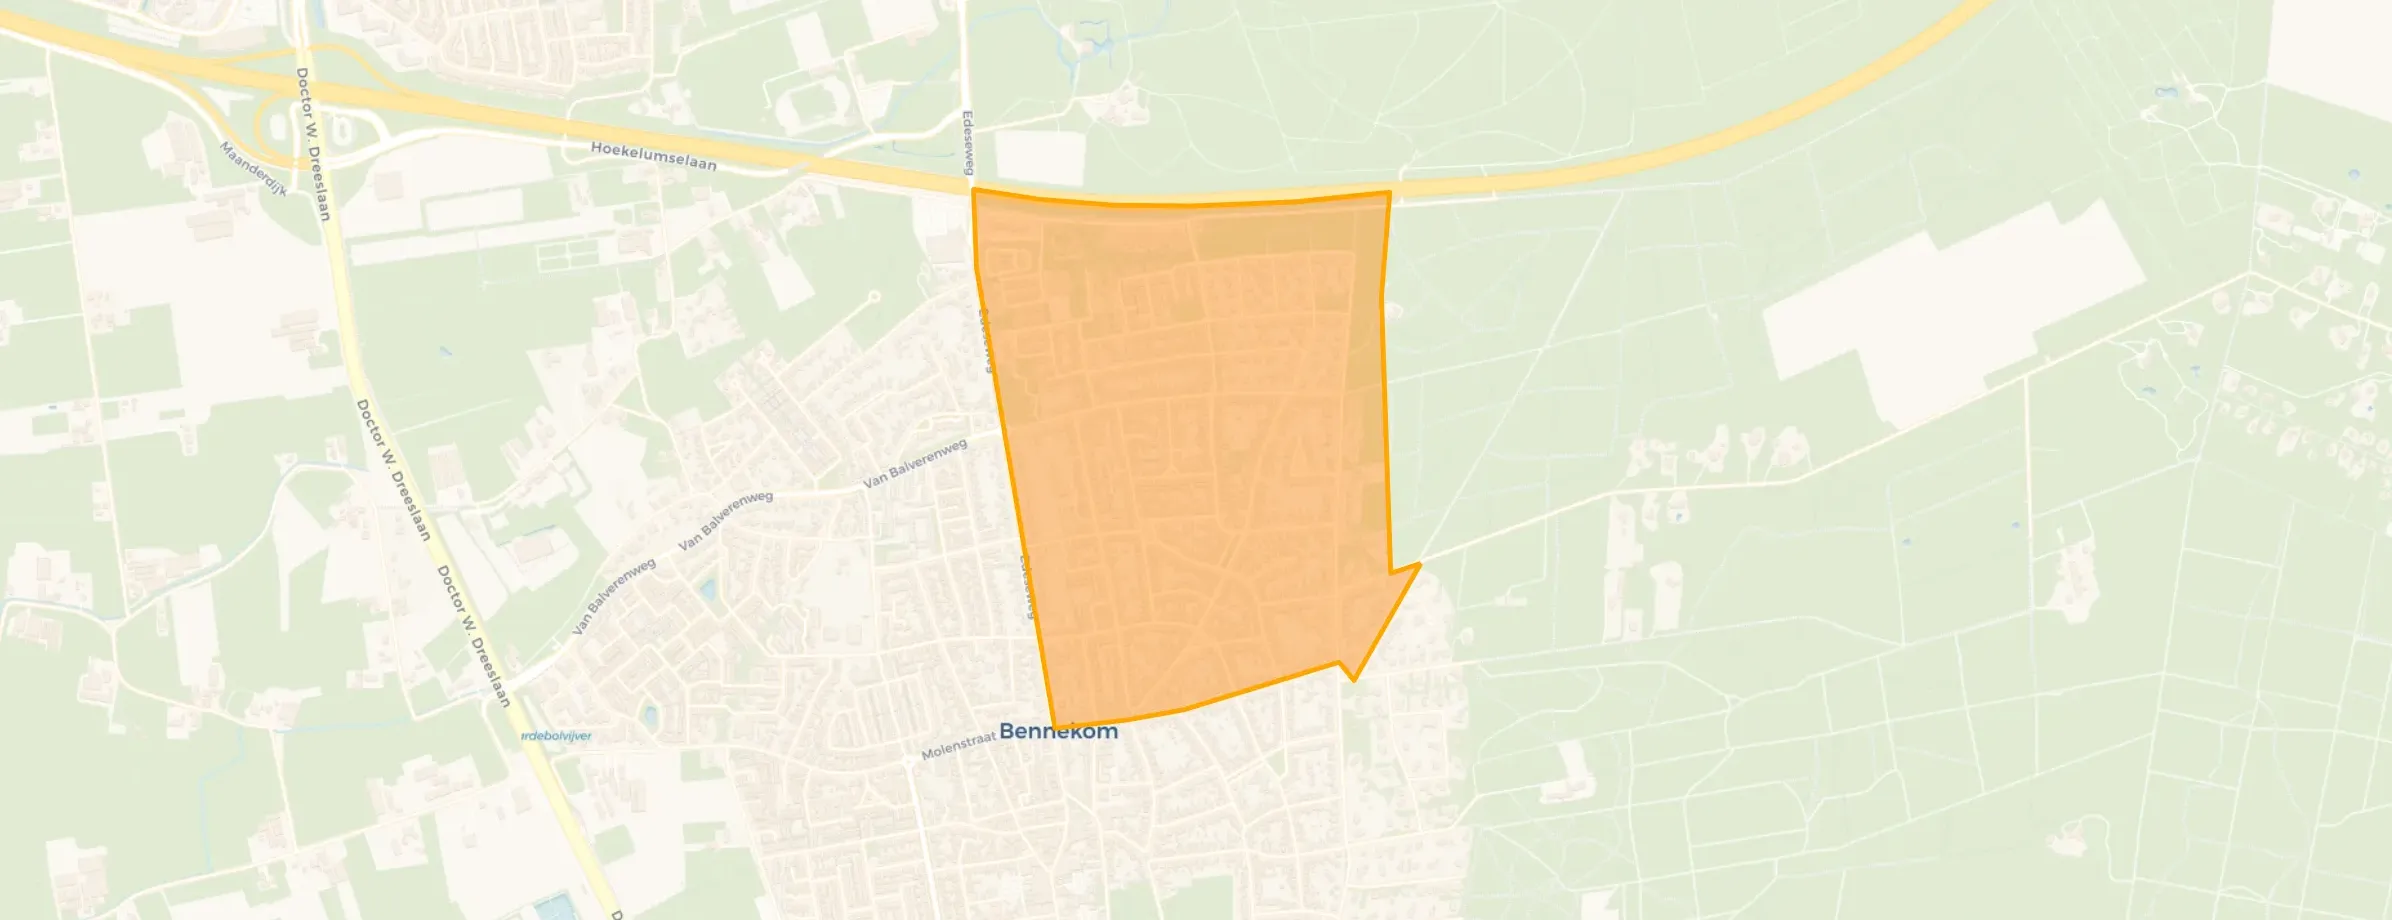
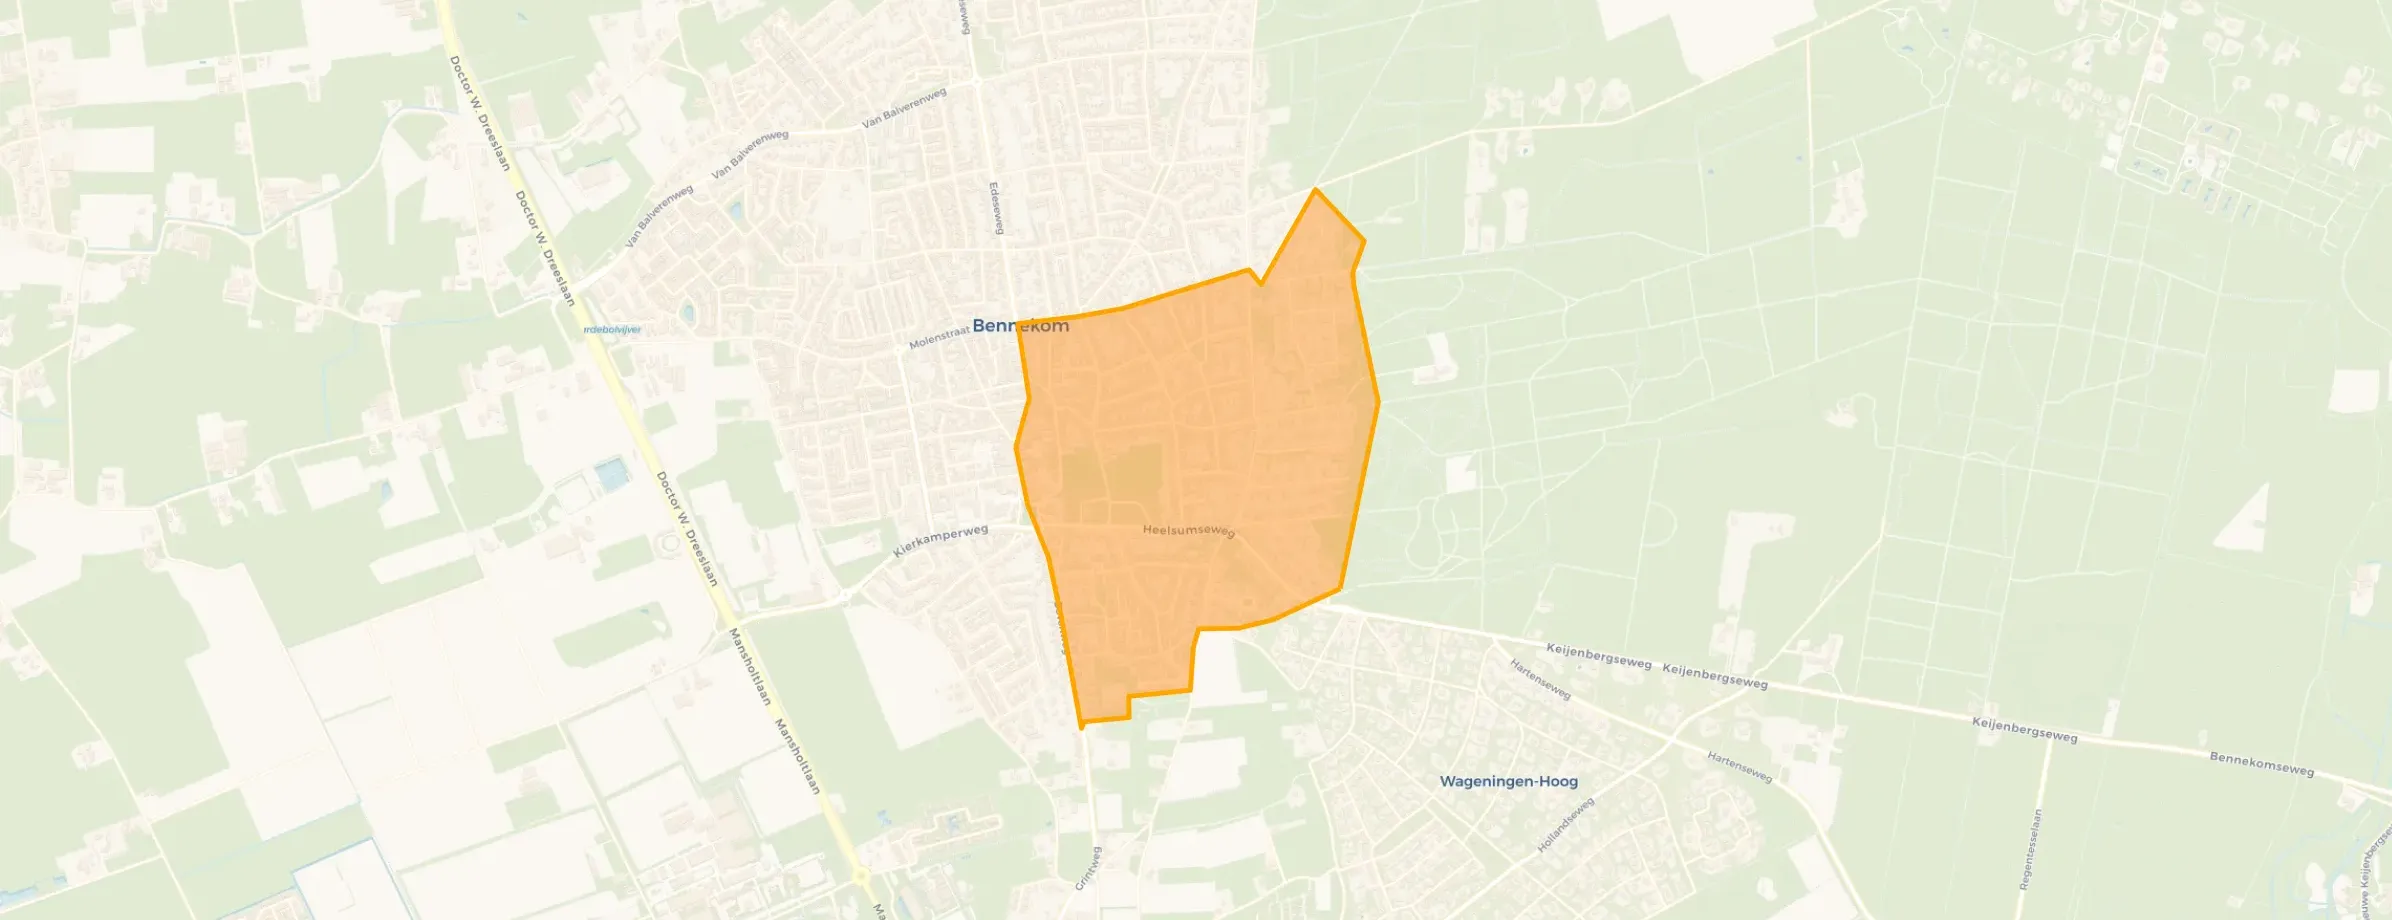
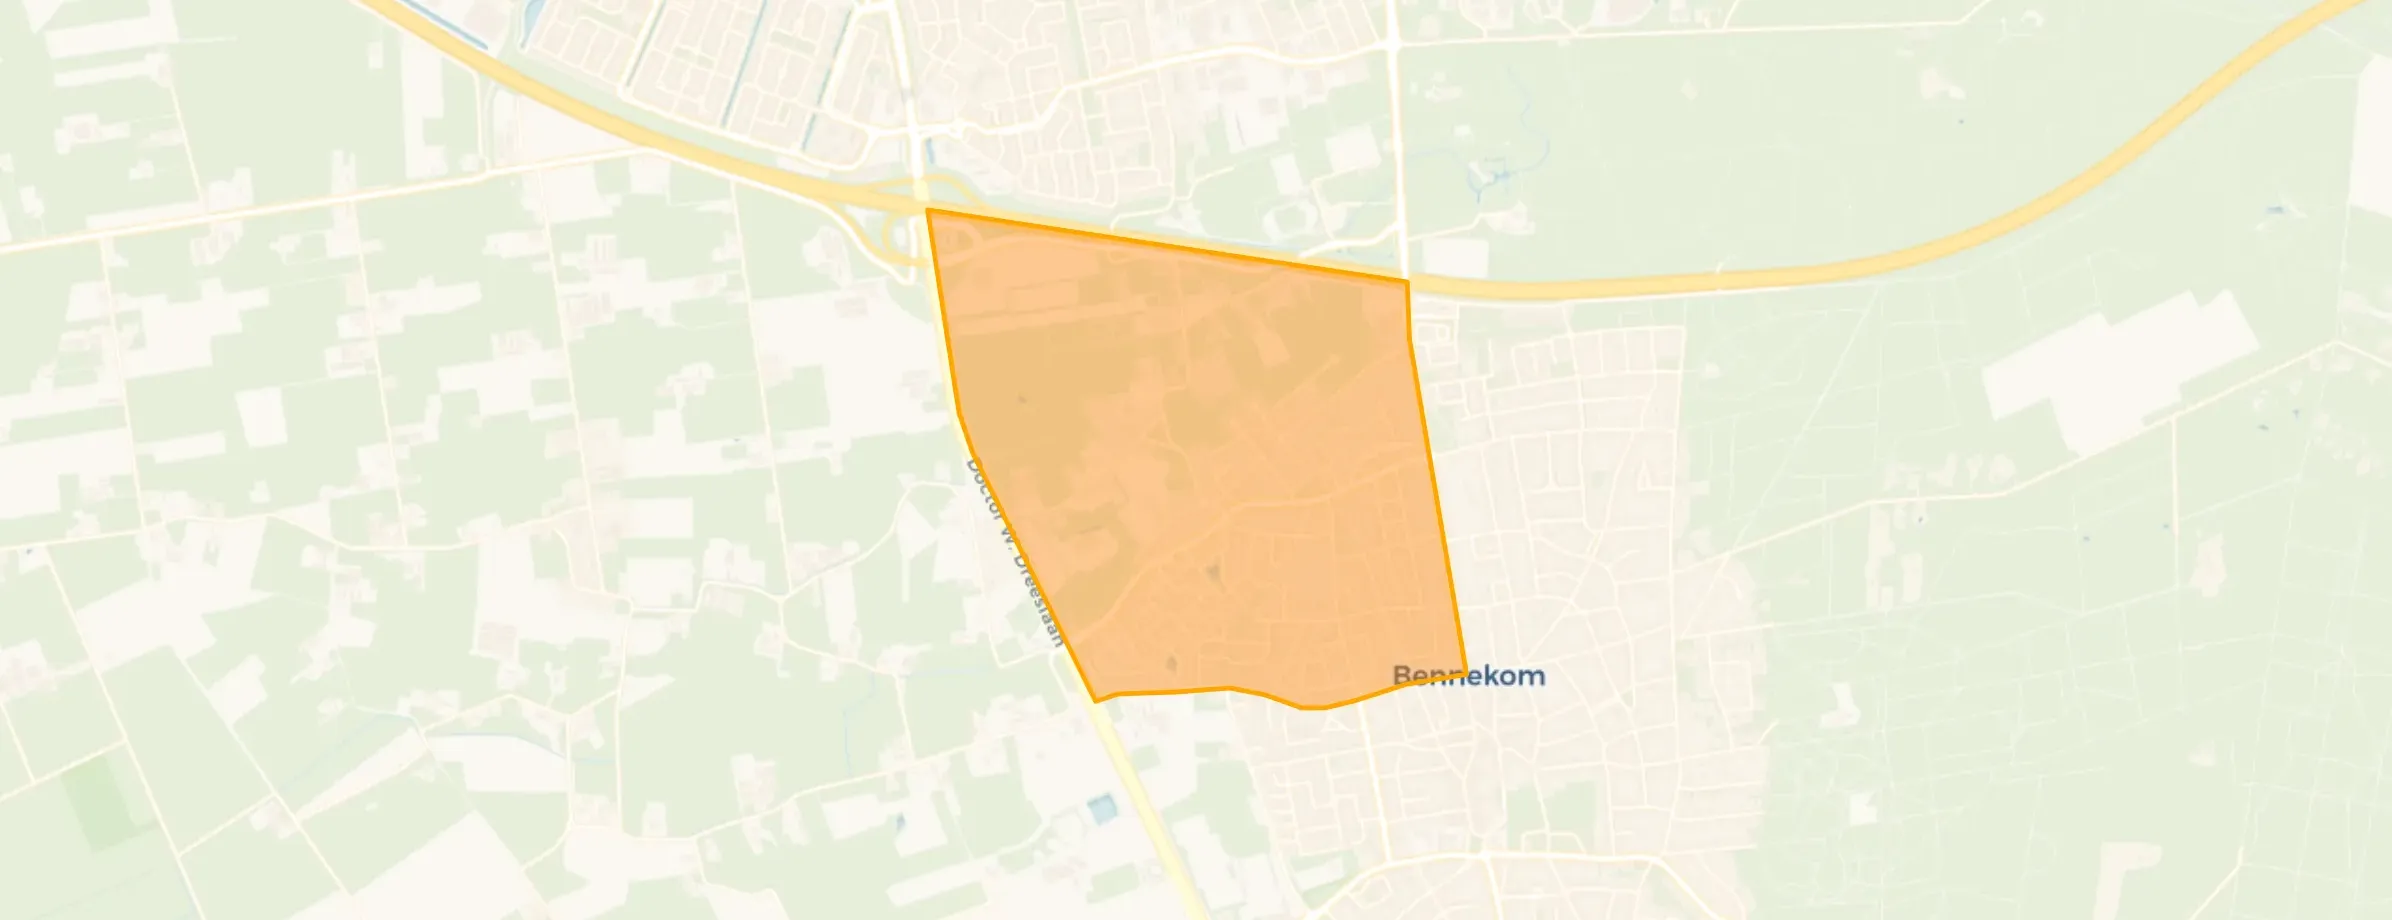
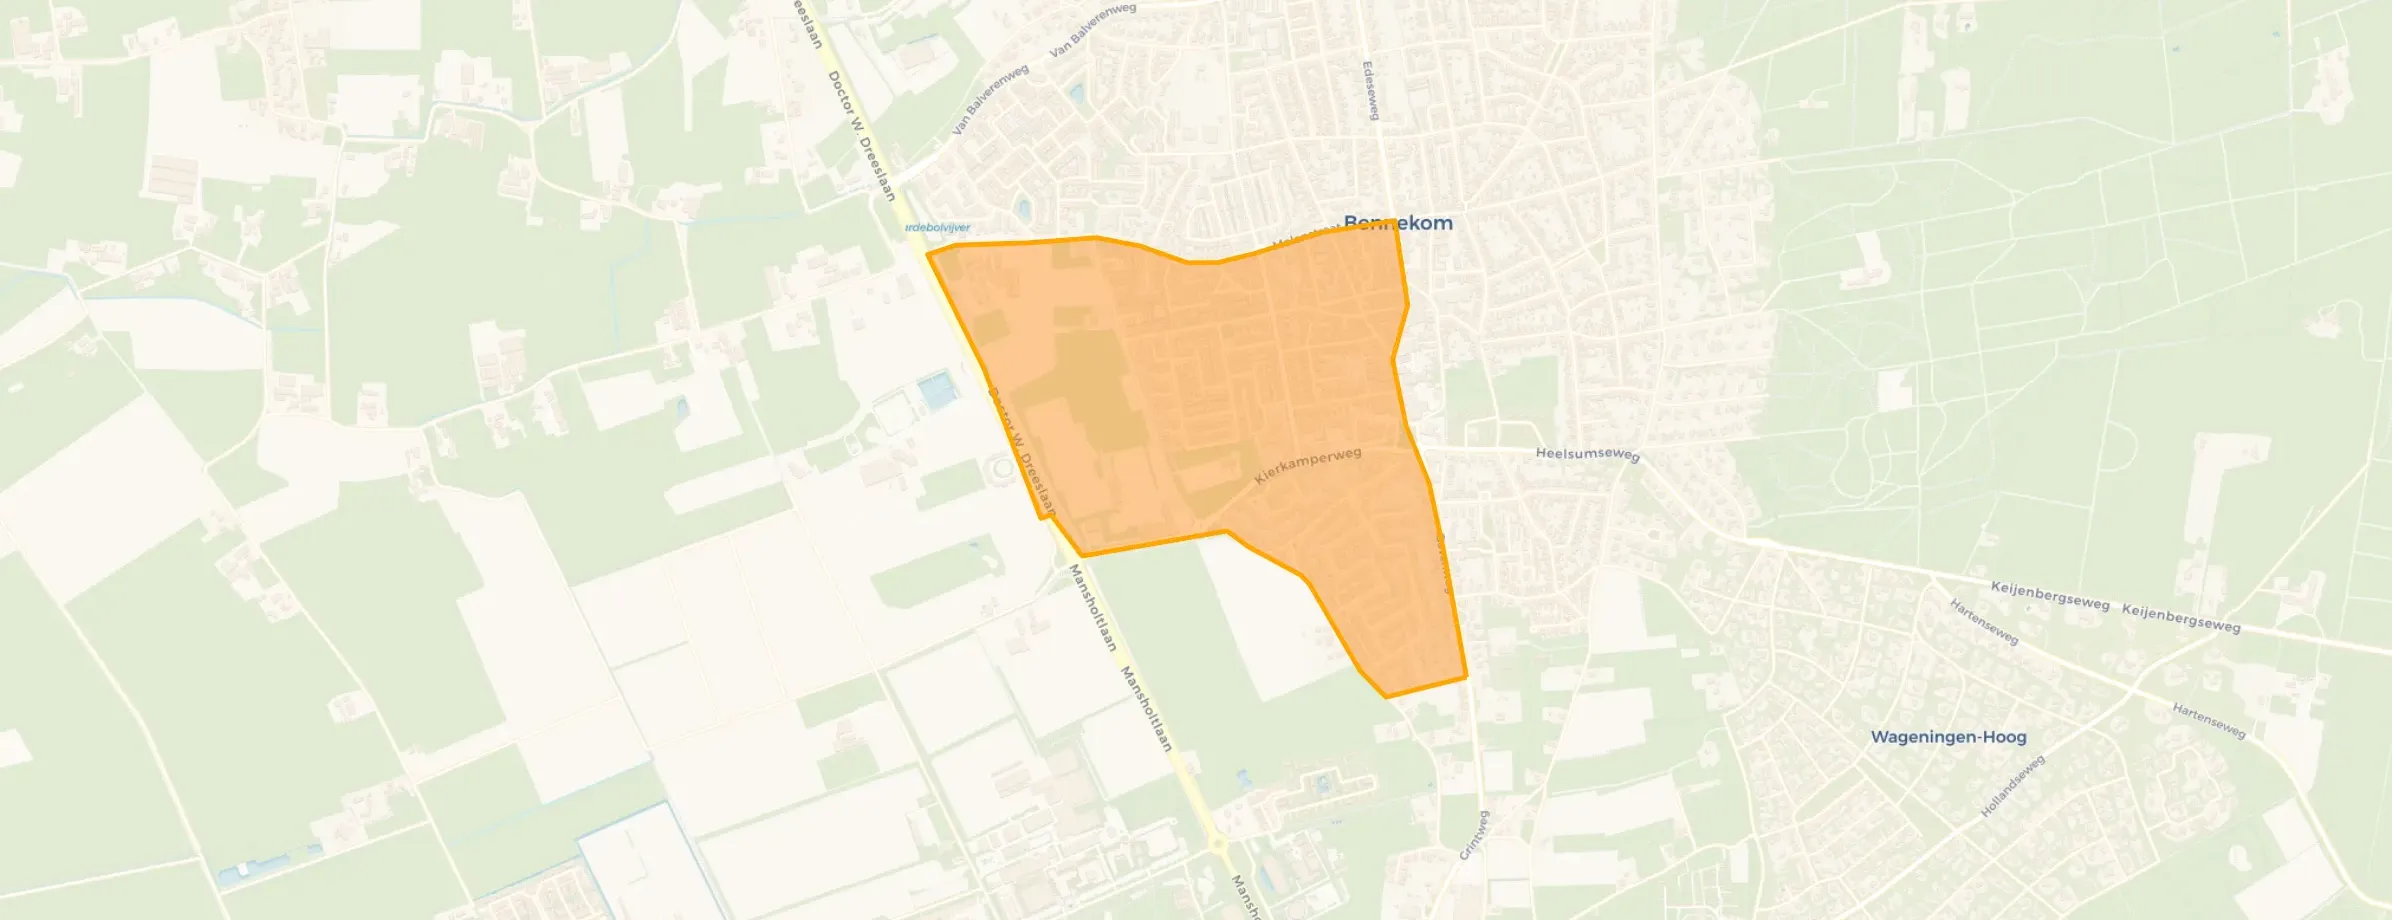
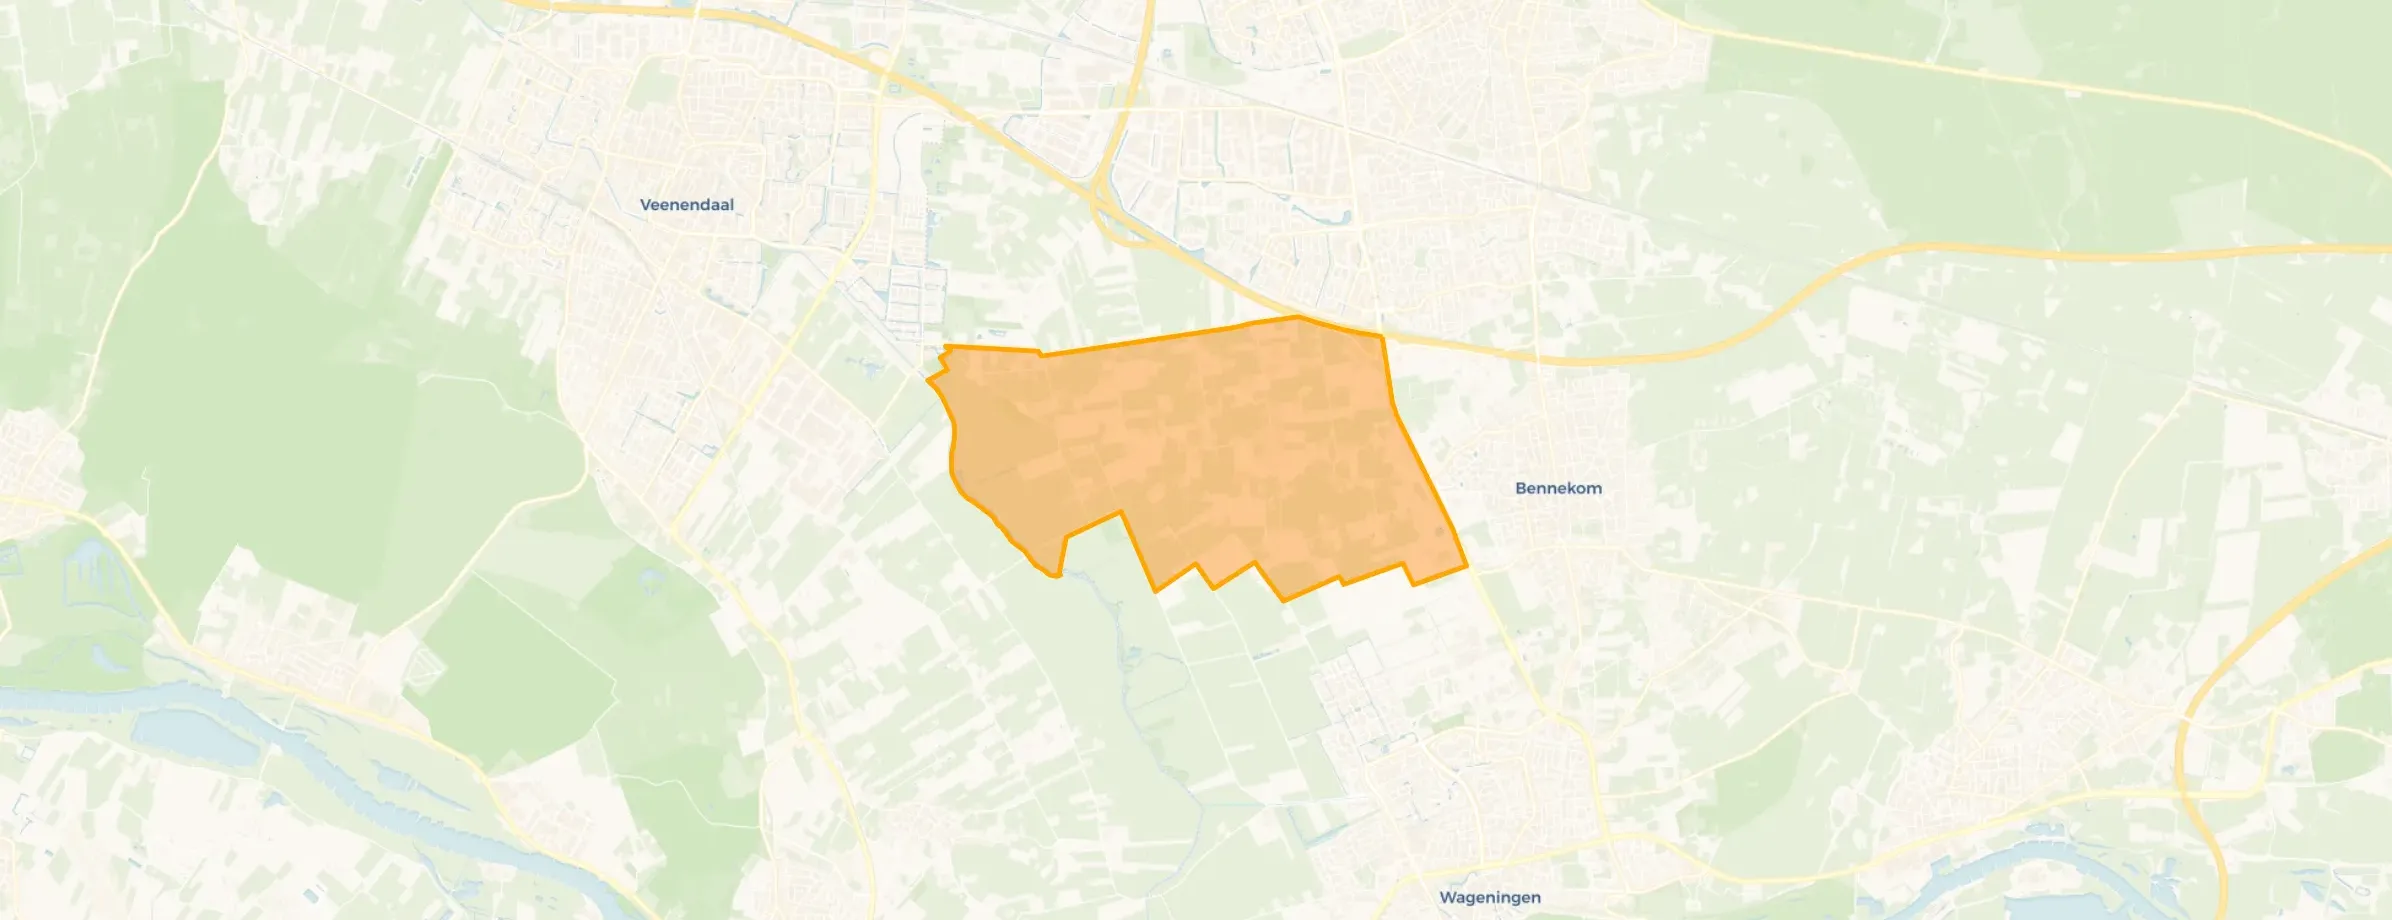
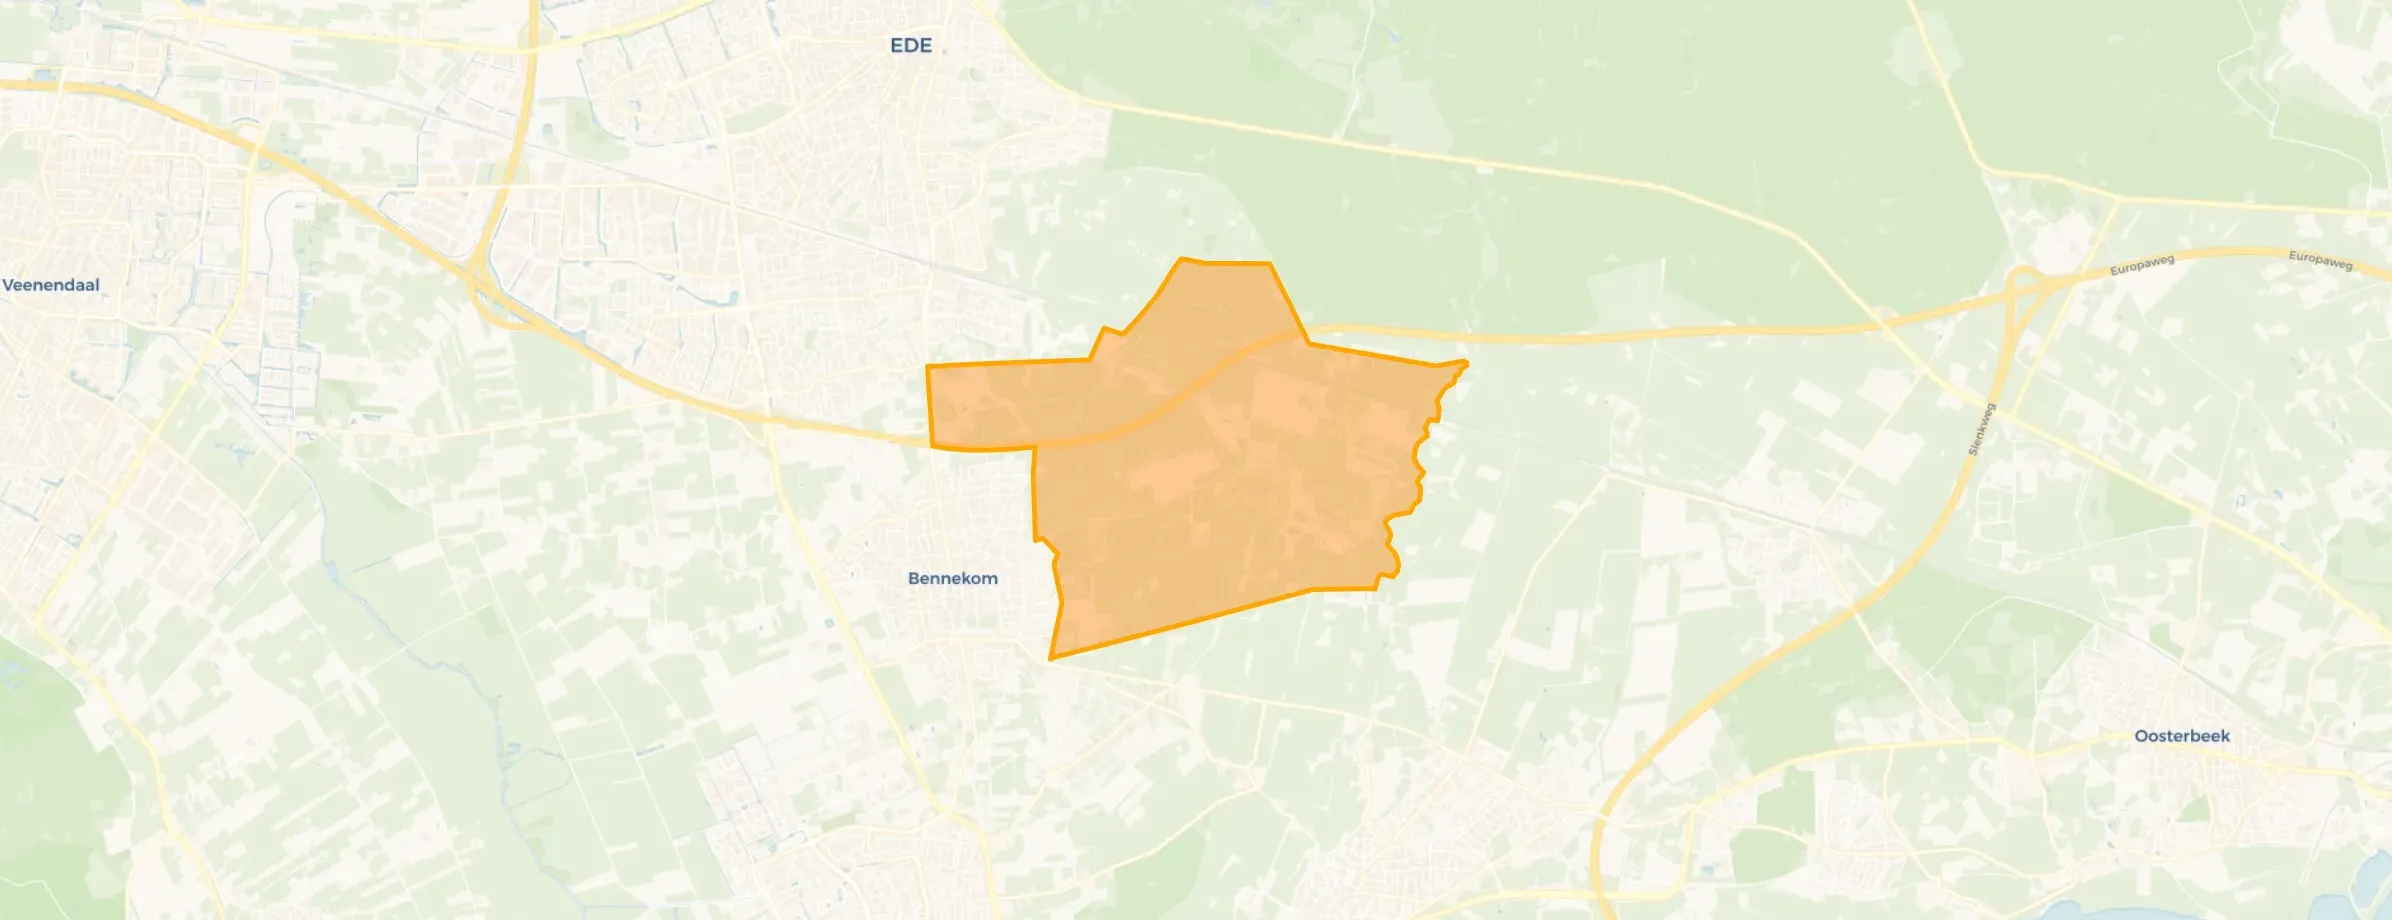
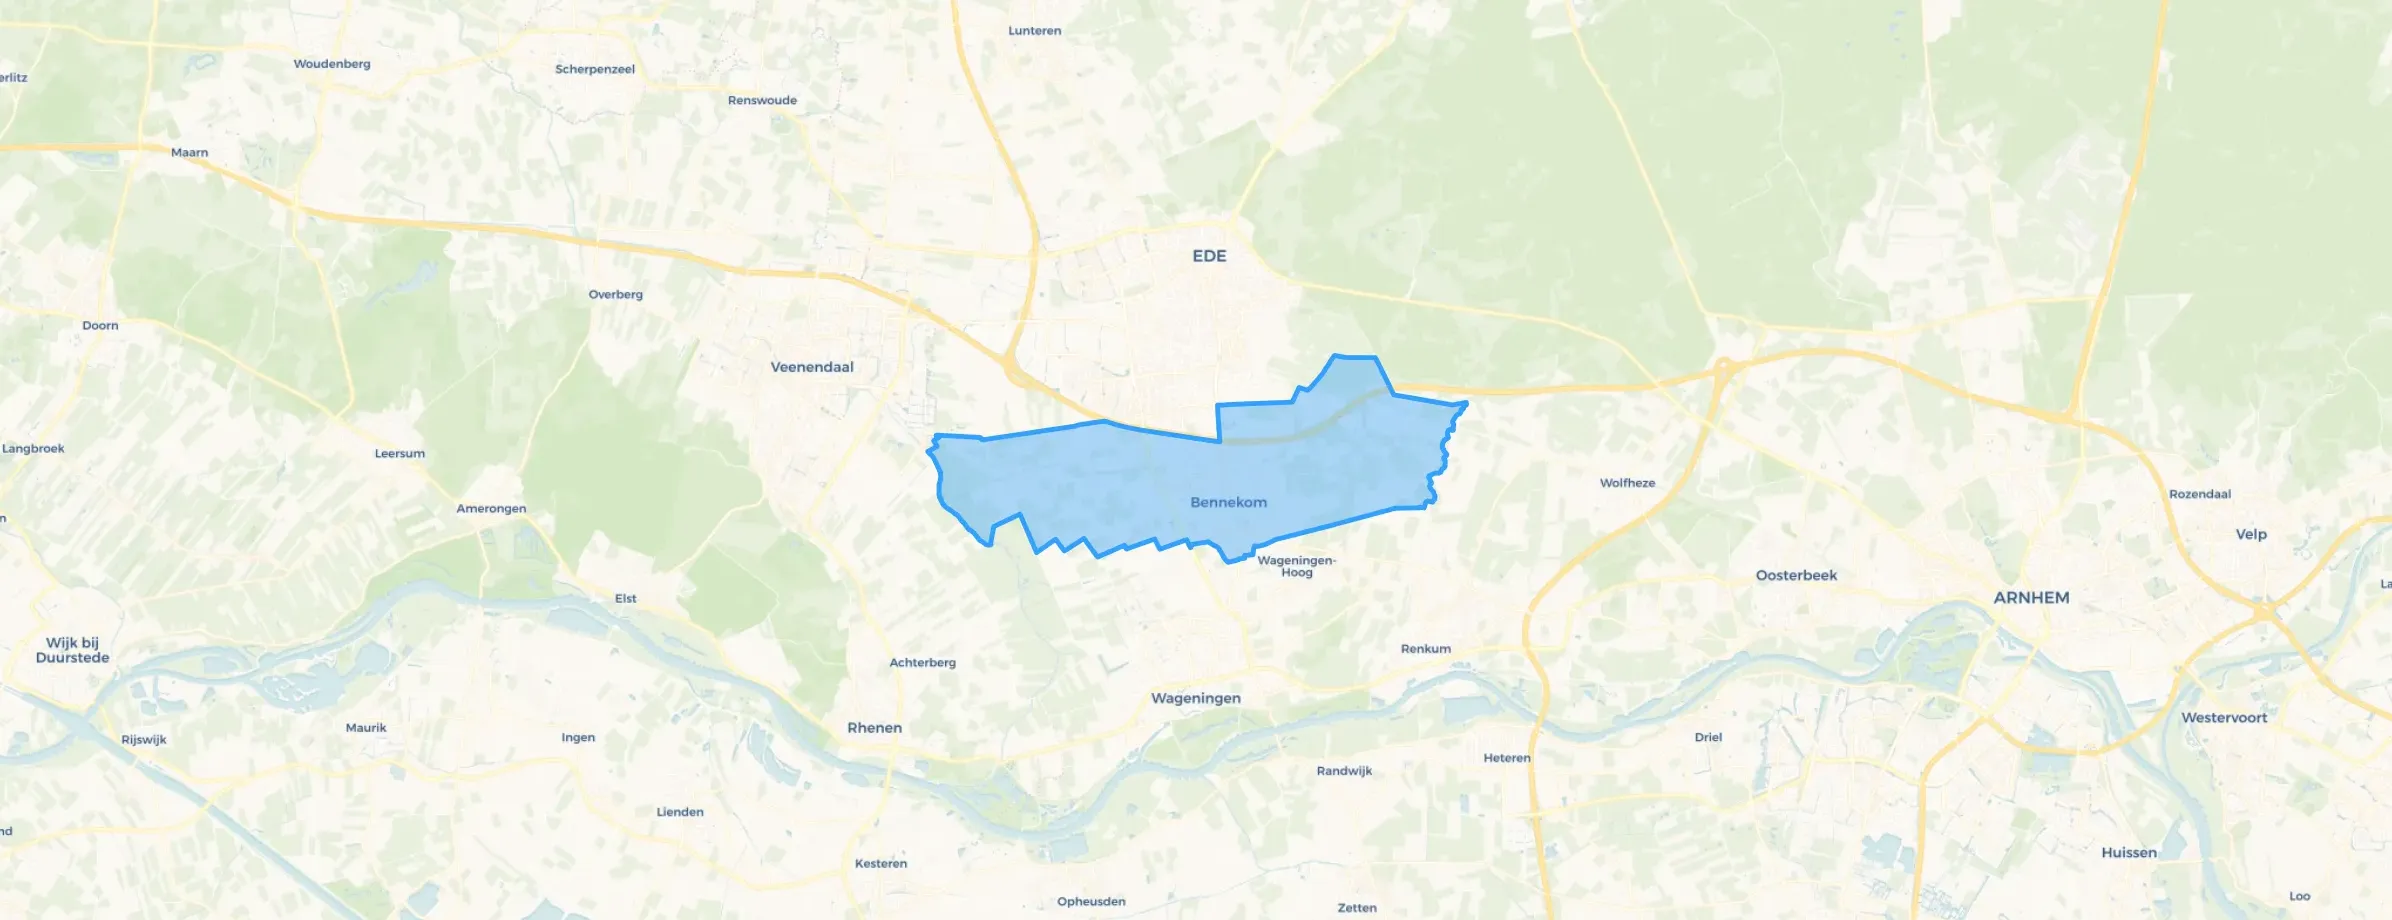
Bennekom is located in the province of Gelderland, in the municipality of Ede The district has a total area of 2.470 hectares, of which 2.470 hectares are land and 0 hectares are water. The district is coded as WK022830. The postcode area is 6721AA-6721ZZ.
Bennekom has 15.160 residents. Of these, 48,8% are men and 51,2% are women. Most residents are 65 years or older (28,4%). The other age groups are 26,8% for '45 to 65 years', 19,1% for '25 to 45 years', 14,0% for '0 to 15 years' and 11,7% for '15 to 25 years'. Of the residents, 41,4% is unmarried, 46,3% is married, 6,4% is divorced and 6,0% is widowed. 13.140 residents originate from the Netherlands, 710 come from Europe and 1.315 come from countries outside Europe.
There are 6.820 households in Bennekom. 35,0% of these are single-person households, 35,8% households without children and 29,3% households with children. The average household size is 2,2 persons. The national average is 2,1 persons.
In Bennekom there are 12.400 income recipients. The average income per income recipient is €45.500, which is €3.300 (8%) higher than the national average of €42.200. Per resident, the average income is €38.000, which is €3.100 (9%) higher than the national average of €34.900. Most residents of Bennekom are highly educated. 45,1% have a university or higher professional education (HBO/WO), 35,0% have an intermediate education (HAVO, VWO or MBO 2-4) and 20,0% have a lower education (VMBO or MBO 1).
Of the 15.160 residents, around 73% are in paid employment, which amounts to 11.067 people. This is 1% higher than the national average of 72%. The majority of workers are in salaried employment (82%), while 18% are self-employed. In Bennekom, 31% of residents receive a benefit. The largest group is those receiving a state pension (AOW). 3.900 people receive this benefit.
In Bennekom there are 6.810 homes with an average assessed value (WOZ) of €512.000. Of these, around 96% are occupied and 4% unoccupied. Most homes are owner-occupied. This amounts to 28% rental homes and 72% owner-occupied homes. Of the homes, 72% privately owned, 17% owned by housing associations and 11% owned by other landlords. The most common construction periods in Bennekom are 1970-1980 (22%) and 1950-1970 (22%).
There are currently no homes for sale in Bennekom. The most recently listed home is Dorpsstraat 49J by Jillis Baggerman makelaardij op Funda. No homes were sold in Bennekom over the past year.
There are currently no homes for rent in Bennekom. The most recent home is Dorpsstraat 24B, offered by Blinq Makelaars op Funda. No homes were let in Bennekom over the past year.
No recent rental data available for Bennekom.
In Bennekom there are 4.667 addresses with a registered energy label. The most common labels are C (30%), A (26%) and B (17%). On average, an address in Bennekom uses 2.720 kWh of electricity per year. This is 7% above the national average of 2.550 kWh. Natural gas consumption, at 1.000 m³ per year, is 25% above the national average of 800 m³.
It is a cosy neighbourhood in itself. There are many amenities such as nice playgrounds, football pitches, primary schools, shops and more. These places are always lively, but there are many elderly people who are good at complaining. There is no community centre or anything to bring people together, so you don't really have much interaction.
Auto-translated to English by AIFriendly neighbours, good contact without constantly knocking on doors. Close to shops, supermarkets, schools. Cycling distance to the station and to larger cities like Wageningen and Ede. Walking distance to beautiful forest!
Auto-translated to English by AIIt's sometimes quite boring, but there are many things like forests, playgrounds, a football field, etc. Nice people, but many elderly. It's safe and most people know each other. It's reasonably clean everywhere, there are many rubbish bins in the neighbourhood. There are 3 primary schools here, but no secondary schools or universities. It's easily accessible as it's close to a motorway.
Auto-translated to English by AIBecause Bennekom was safer before 1995, that was clearly visible at the time. After 1995, Bennekom became busier with residents and traffic, making it more unsafe due to much more car traffic, for which the existing infrastructure is not designed. Furthermore, what needs to be greatly improved is that public bus service line 86 is too infrequent in the streetscape to safely get from point A (Bennekom itself) to point B (Ede and Wageningen). For example, bus line 86 should run 4 times per hour between 07:00 and 11:00 and also between 15:30 and 19:30, on all weekdays. Three extra bus stops in Bennekom could reduce car traffic. Many people remain dependent on public transport. When it comes to green spaces, Bennekom remains very popular, both for recreation and living. Regarding hygiene, attention should be paid to the streetscape, especially more frequent cleaning of the pavement along with the green spaces. In terms of traffic safety, Bennekom has become more unsafe, probably at least 15 percent from 1995 to the present. Especially many double-parked cars make it very dangerous for cyclists and pedestrians. What people are satisfied with are the available facilities. Furthermore, the village centre is cosy. What remains particularly visible in North Bennekom is the severe traffic unsafety, partly due to very poor and unsafe infrastructure. Hopefully this will be improved. The community can be called very cosy; everyone knows everyone, which makes Bennekom very pleasant. All in all, if we compare Bennekom from the period 1995-2005 to the present, more safety measures are desired, including more police. Because Bennekom had a good rating of possibly 8.5 in the period 1995-2005, due to the busy society it has now reached a rating of 7.0. Hopefully this can be restored to 8.5 (or even more). To achieve this, the municipality of Ede is currently working on realising very safe traffic, making Bennekom even safer. Let's hope for great success.
Auto-translated to English by AIThere is quite a lot of litter in the neighbourhood; as far as I'm concerned, they could put more bins. There are many primary schools in the neighbourhood and also a few secondary schools nearby. There are also quite a few playgrounds and such in the area. It's just a shame that there are a lot of renovations going on in the neighbourhood.
Auto-translated to English by AIThe housing stock is mainly post-war — 60% was built between 1945 and 1990.
Over the past year a home for sale in Bennekom was listed for an average of €635,185 (€4,959 per m²). That is 20% above the Dutch national average.
A rental home in Bennekom cost an average of €1,580 per month (€17 per m²). That is 27% below the national average.
Residents give Bennekom a 7.7 out of 10 based on 5 reviews. Education stands out with a 8.2; housing lags behind with a 7.0.
From Bennekom you can on average reach a supermarket at 1.2 km, a GP at 1.0 km, a railway station at 3.5 km, a primary school at 0.7 km (as the crow flies, source: CBS).
Right now you will find 42 homes for sale and 4 homes for rent in Bennekom.