Province in the Netherlands
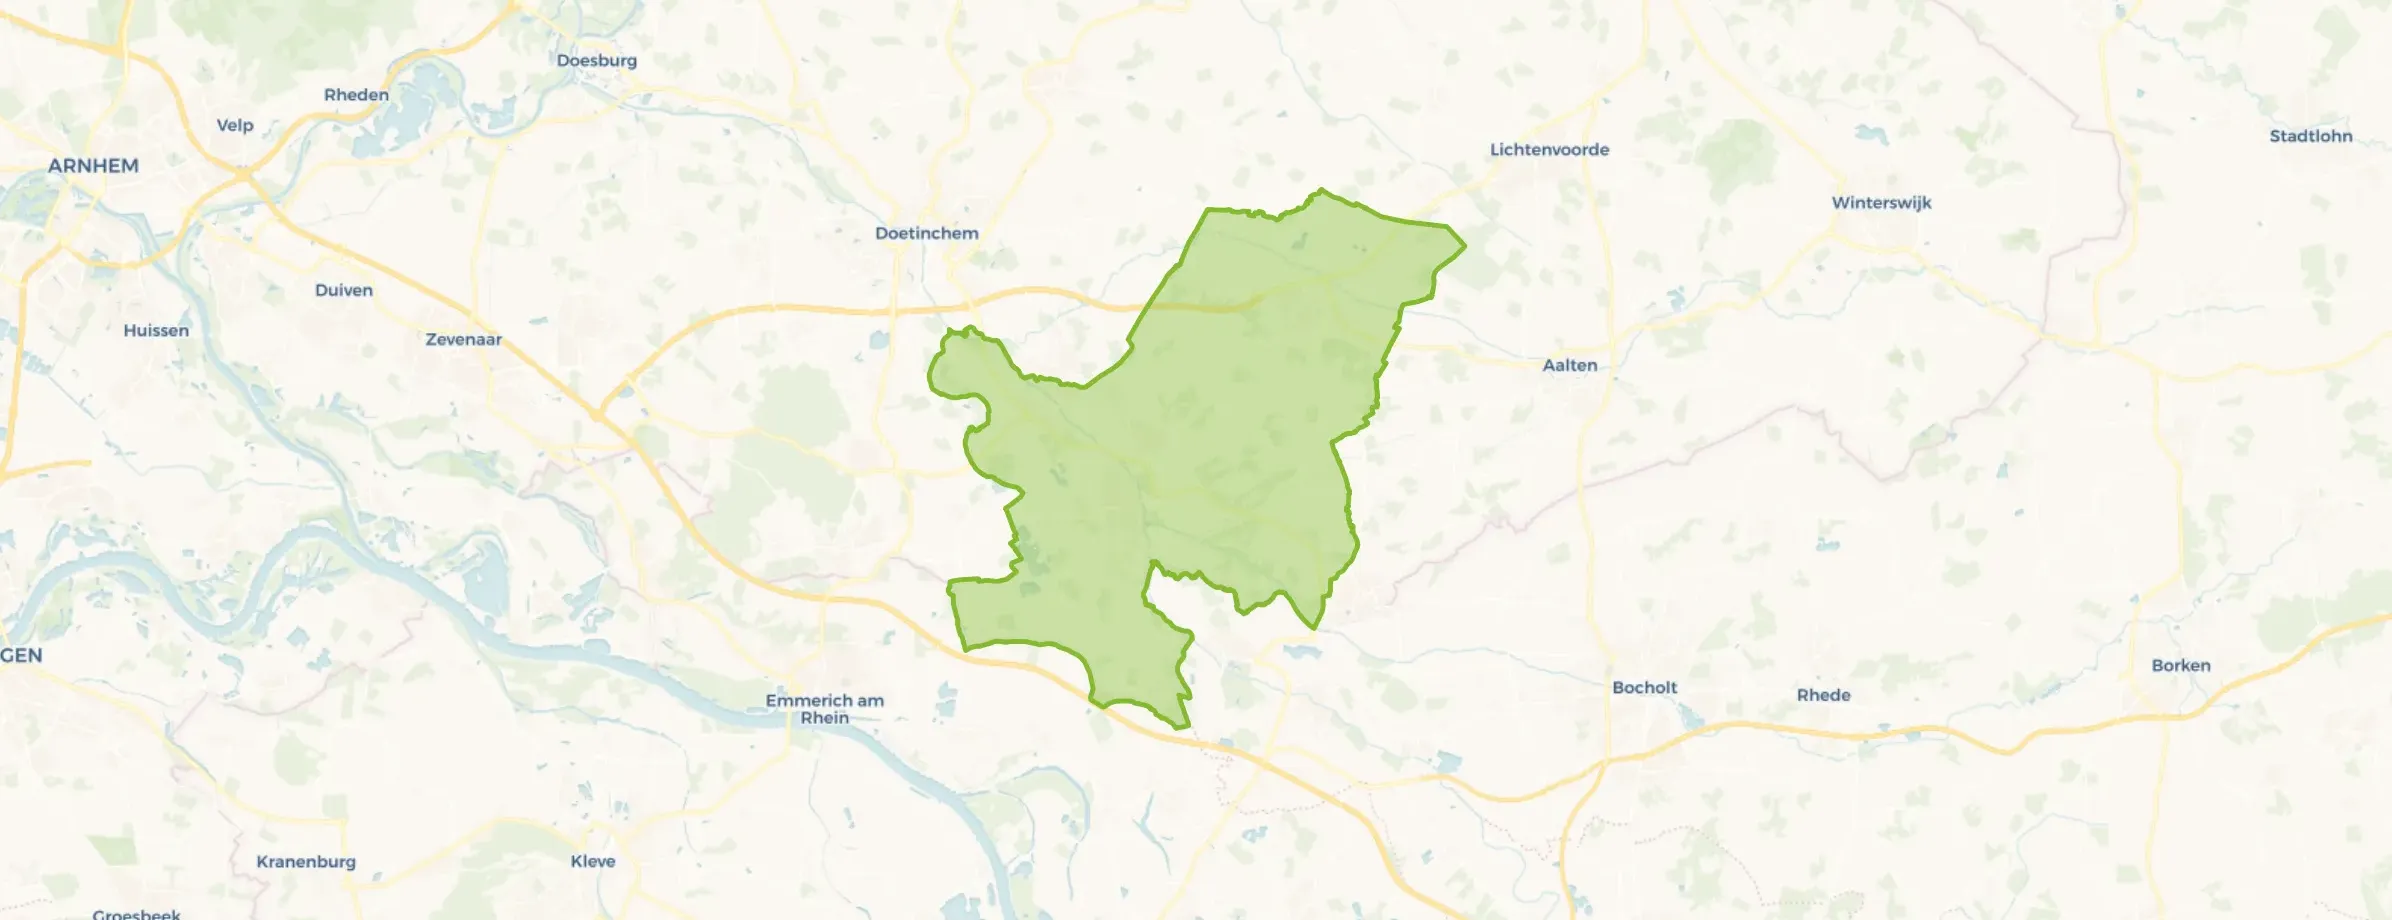
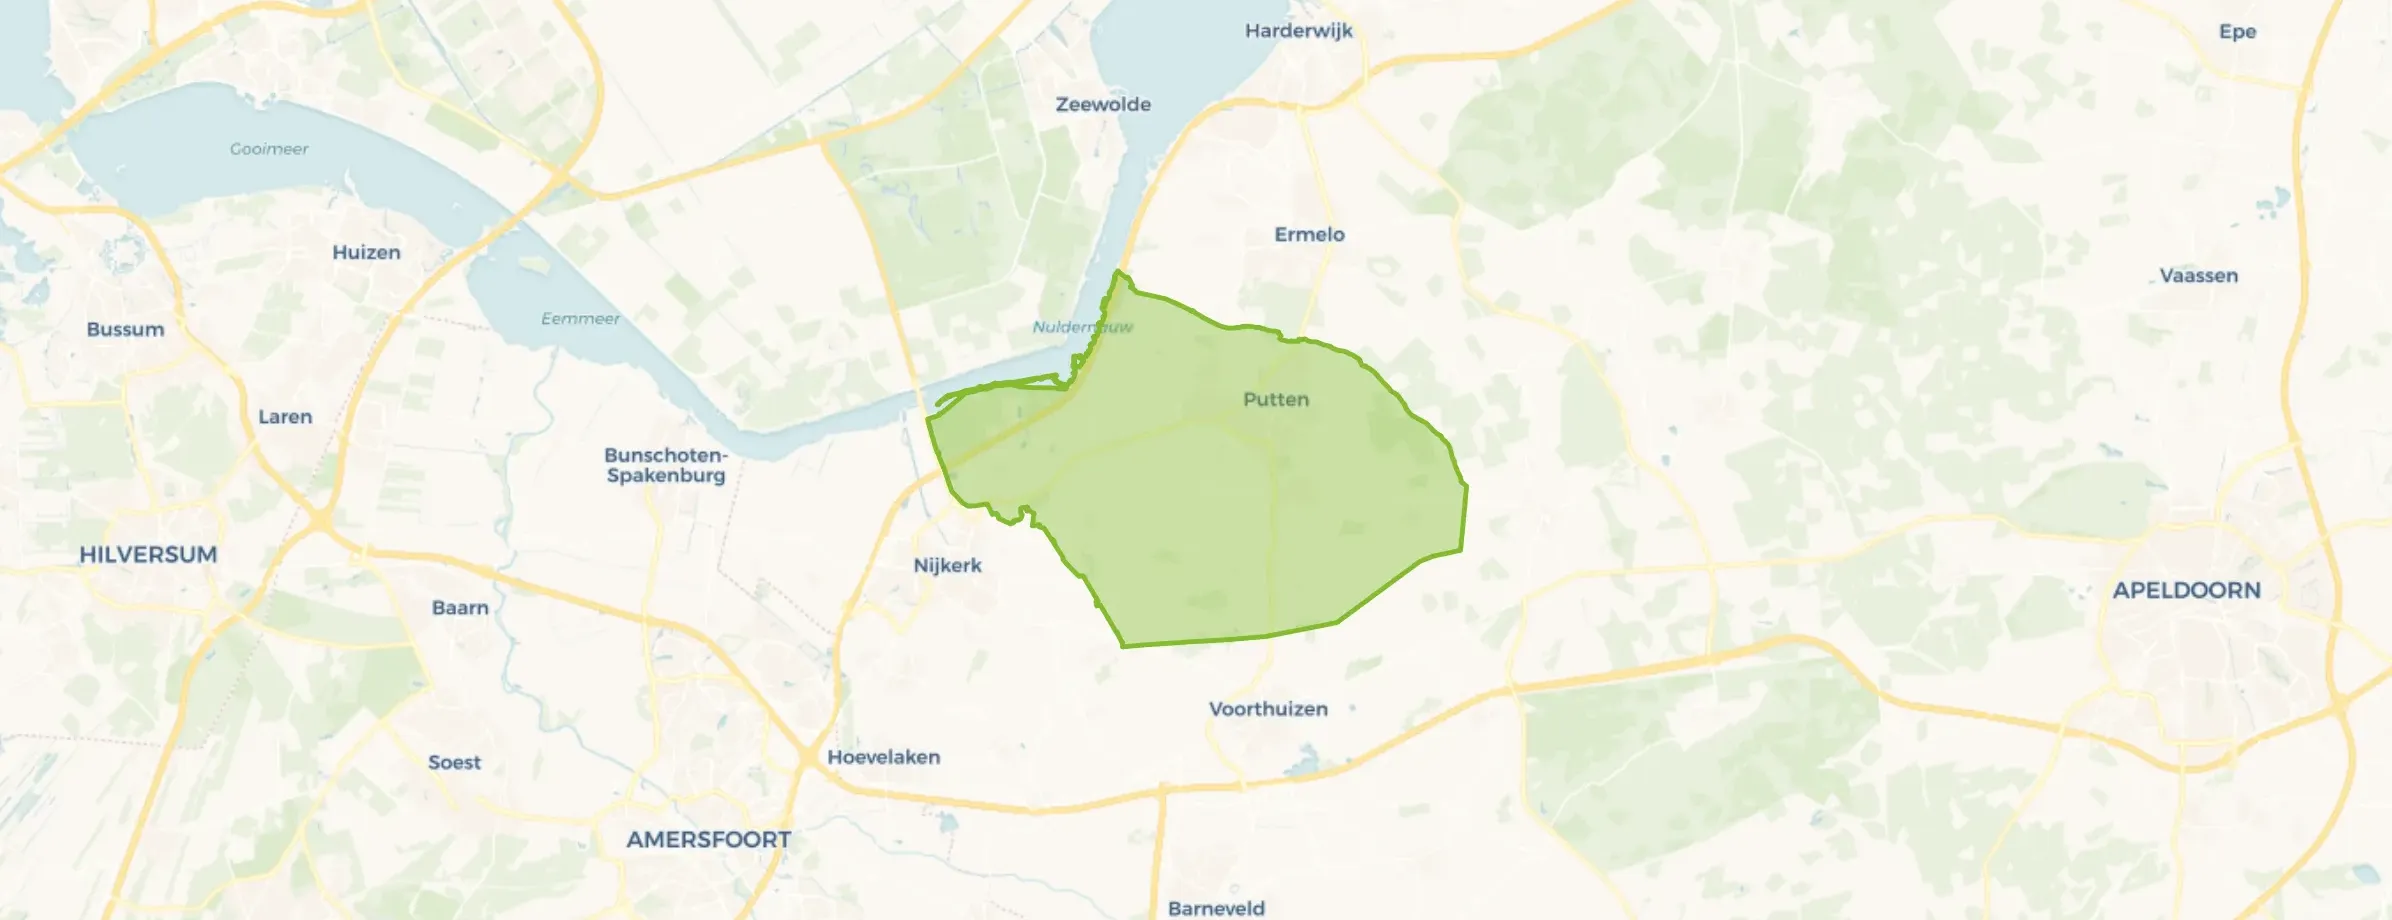
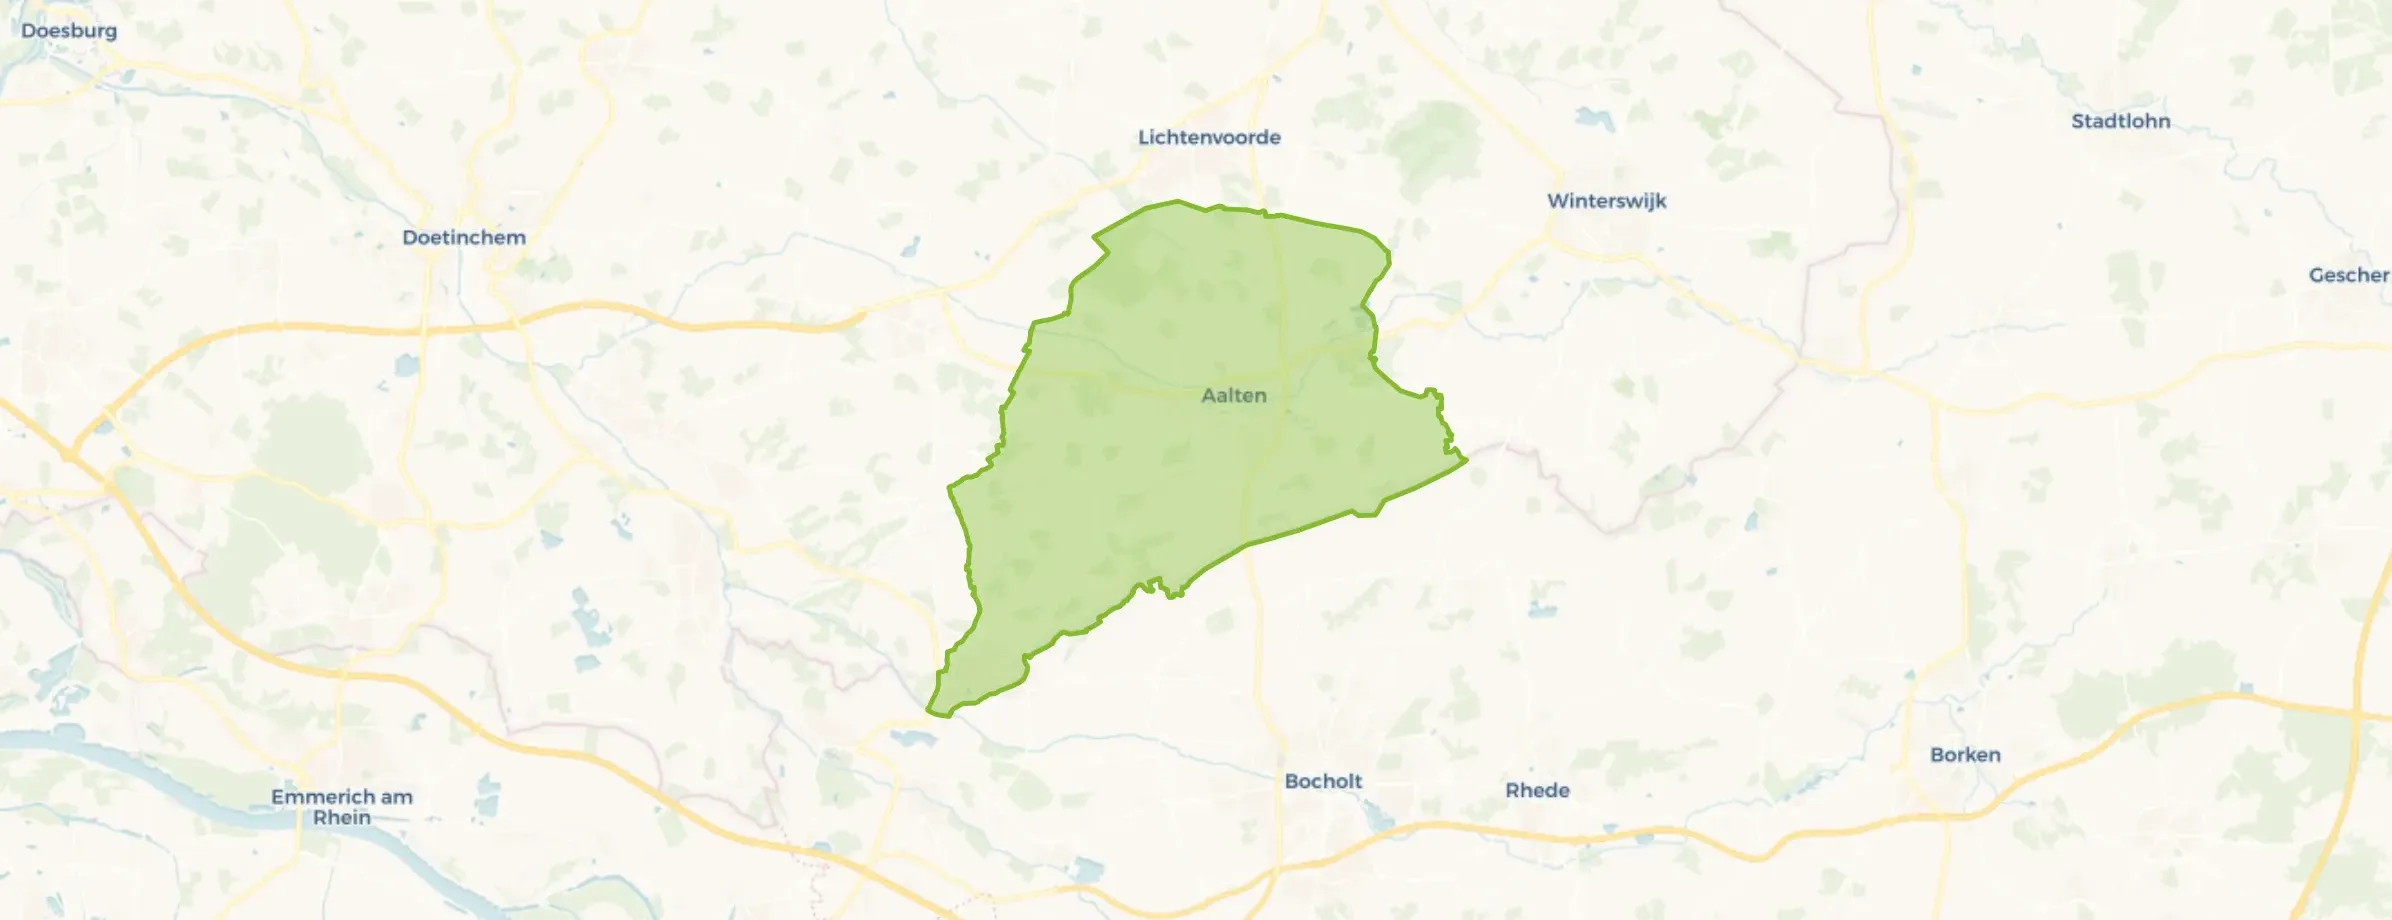
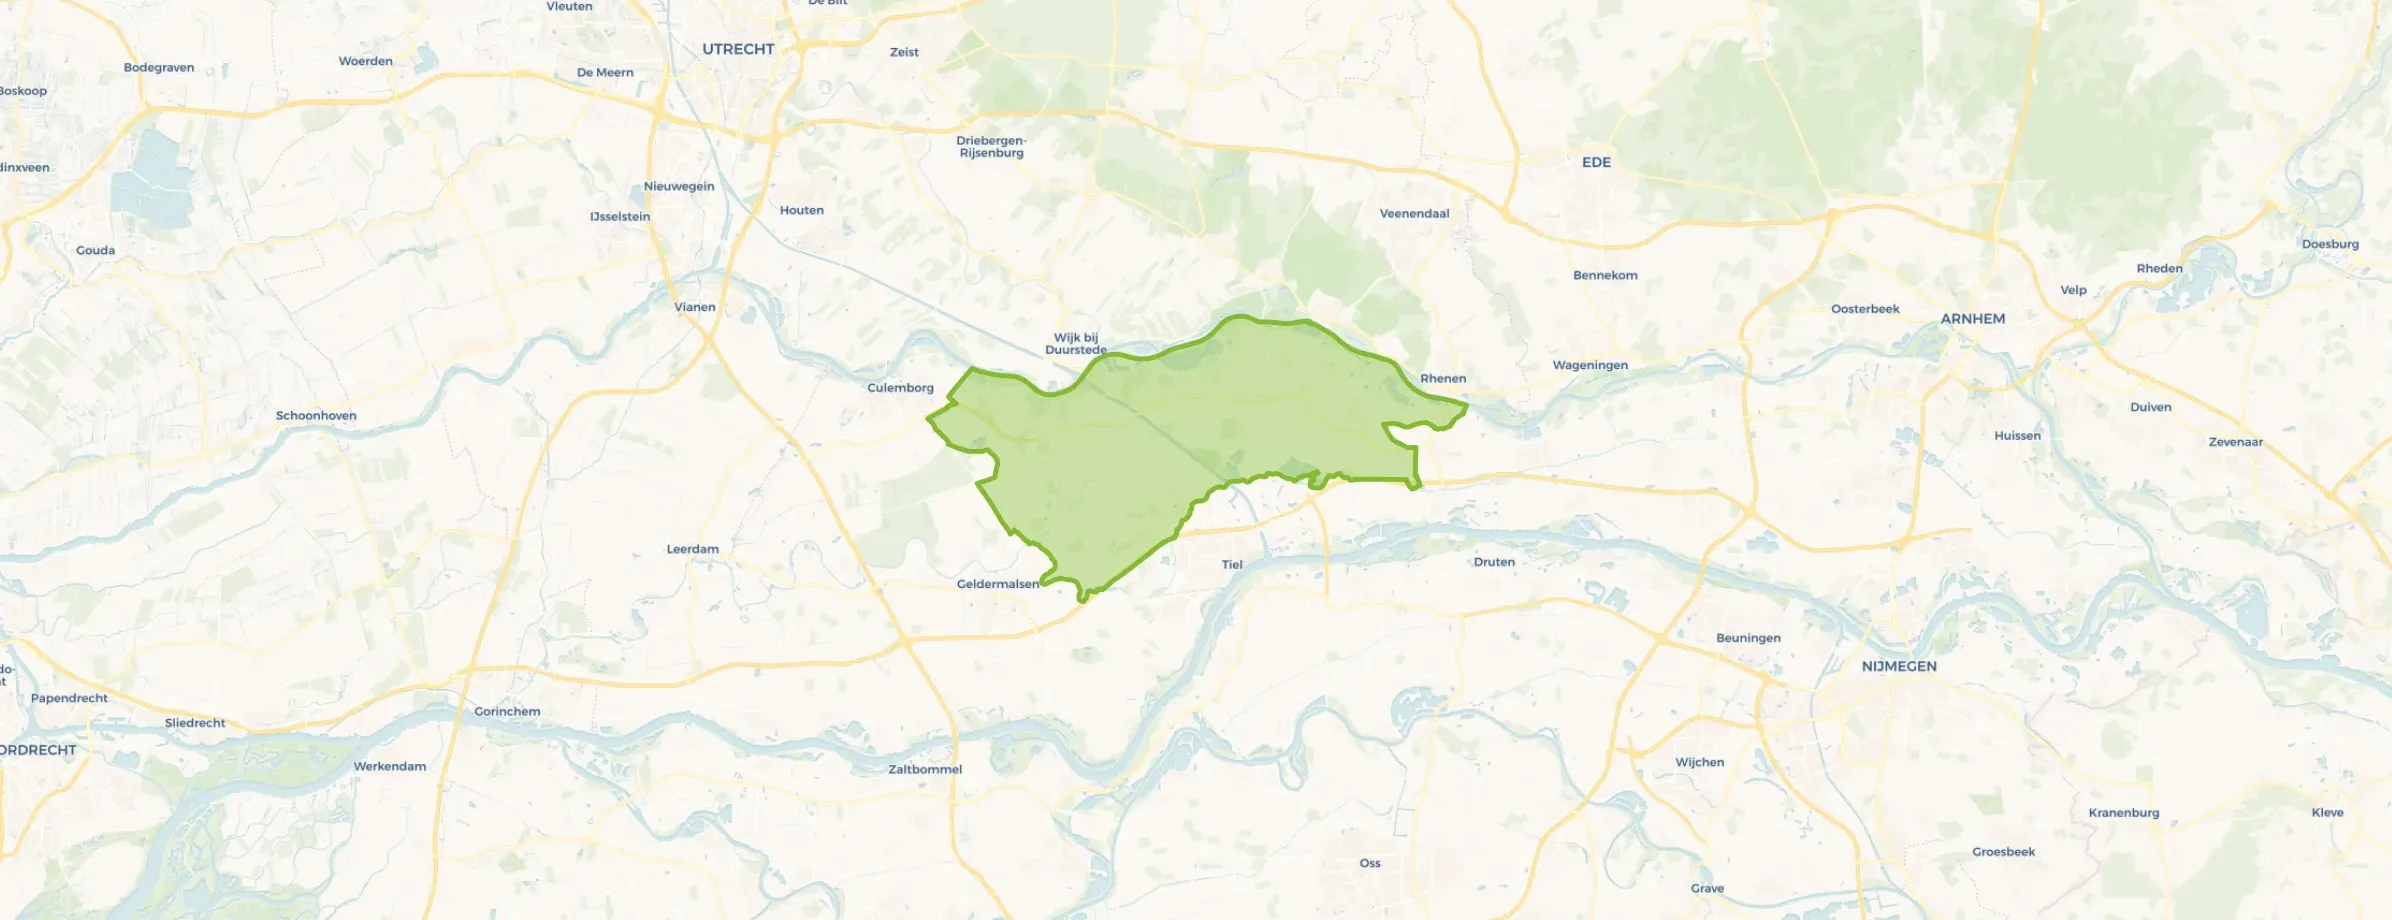
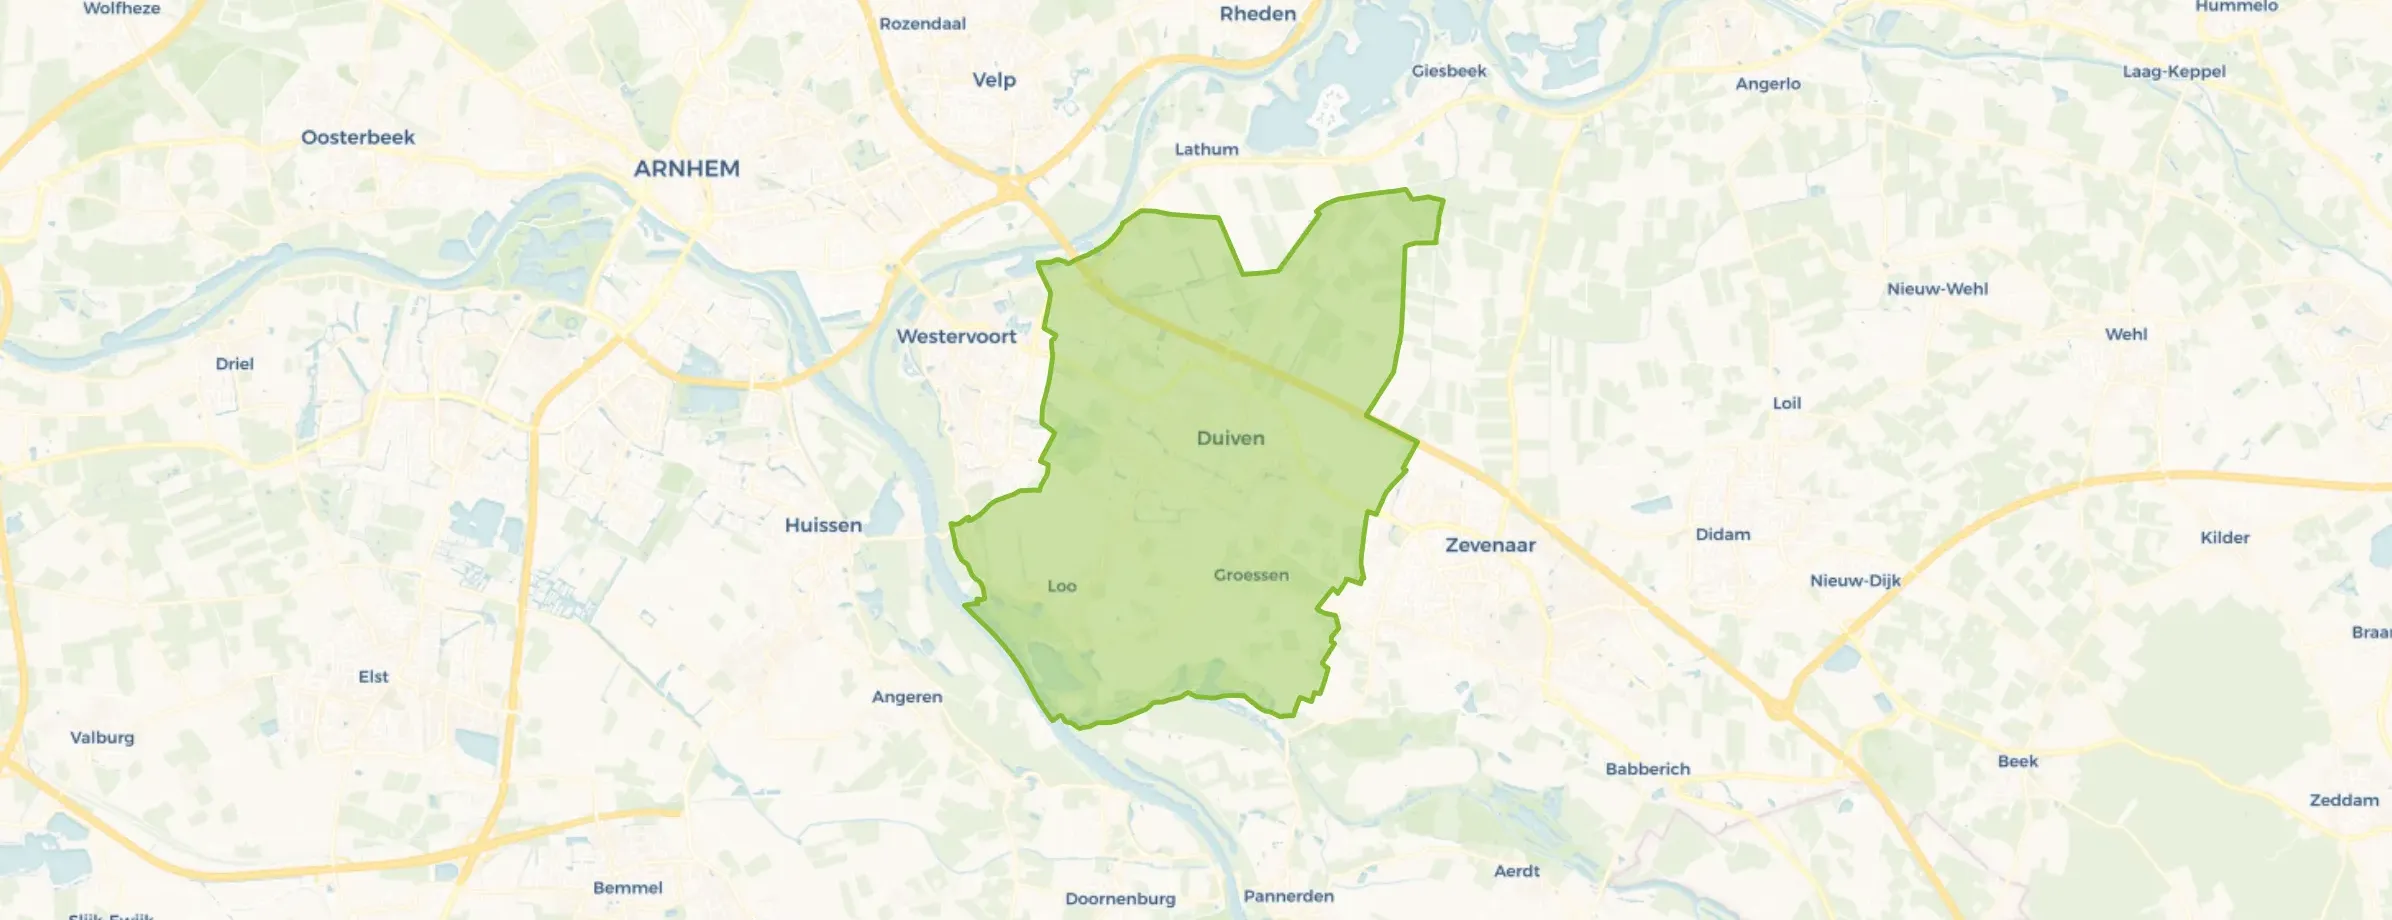
Gelderland is the largest province of the Netherlands, with the Veluwe as its best-known nature area. The province has a total area of 513.628 hectares, of which 496.048 hectares are land and 17.584 hectares are water. The province is coded as PV25. The postcode area is 3771AA-8194LZ.
Gelderland has 2.161.358 residents. Of these, 49,7% are men and 50,3% are women. Most residents are 45 to 65 years (26,8%). The other age groups are 23,8% for '25 to 45 years', 22,0% for '65 years or older', 15,0% for '0 to 15 years' and 12,3% for '15 to 25 years'. Of the residents, 47,6% is unmarried, 40,0% is married, 7,3% is divorced and 5,1% is widowed. 1.742.864 residents originate from the Netherlands, 143.310 come from Europe and 275.184 come from countries outside Europe.
There are 981.246 households in Gelderland. 37,7% of these are single-person households, 30,1% households without children and 32,2% households with children. The average household size is 2,2 persons. The national average is 2,1 persons.
In Gelderland there are 1.742.600 income recipients. The average income per income recipient is €40.396, which is €1.804 (4%) lower than the national average of €42.200. Per resident, the average income is €33.584, which is €1.316 (4%) lower than the national average of €34.900. Most residents of Gelderland are educated to an intermediate level. 41,9% have an intermediate education (HAVO, VWO or MBO 2-4), 32,1% have a university or higher professional education (HBO/WO) and 26,1% have a lower education (VMBO or MBO 1).
Of the 2.161.358 residents, around 73% are in paid employment, which amounts to 1.577.791 people. This is 1% higher than the national average of 72%. The majority of workers are in salaried employment (83%), while 17% are self-employed. In Gelderland, 27% of residents receive a benefit. The largest group is those receiving a state pension (AOW). 427.470 people receive this benefit.
In Gelderland there are 958.405 homes with an average assessed value (WOZ) of €397.940. Of these, around 96% are occupied and 4% unoccupied. Most homes are owner-occupied. This amounts to 39% rental homes and 61% owner-occupied homes. Of the homes, 61% privately owned, 27% owned by housing associations and 12% owned by other landlords. The most common construction periods in Gelderland are 1950-1970 (20%) and 1970-1980 (17%).
There are currently no homes for sale in Gelderland. The most recently listed home is Gerdesstraat 101 by VLE Vastgoed. No homes were sold in Gelderland over the past year.
There are currently no homes for rent in Gelderland. The most recent home is Den Koem 34, offered by www.woninghuren.nl. No homes were let in Gelderland over the past year.
No recent rental data available for Gelderland.
In Gelderland there are 647.305 addresses with a registered energy label. The most common labels are A (32%), C (22%) and B (16%). On average, an address in Gelderland uses 2.709 kWh of electricity per year. This is 6% above the national average of 2.550 kWh. Natural gas consumption, at 859 m³ per year, is 7% above the national average of 800 m³.





















Tuinstad en Vestingstad zijn m.i. een van de meest sfeervolle wijken van Schuytgraaf. Rustig, veilig en alle voorzieningen zijn aanwezig. En met 4 minuten loop je Park Lingezegen in. Gezinsvriendelijk en daardoor een erg gewilde wijk. Nadeel zijn wel alle bakfietsen…
Auto-translated to English by AIHet is prettig wonen. Veel jonge mensen en een gemoedelijke sfeer tussen de buurtbewoners.
Auto-translated to English by AIIk woon over het algemeen prettig in deze buurt. De omgeving is fijn en de buurt voelt vertrouwd. Wel is het soms wat minder netjes, bijvoorbeeld door afval op straat. Ook kan het regelmatig luidruchtig zijn, vooral op bepaalde momenten van de dag. Ondanks dat ben ik over het algemeen tevreden over de buurt Na bijna 7 jaar in deze buurt gewoond te hebben, ga ik binnenkort verhuizen. Ik heb hier veel meegemaakt en ben gewend geraakt aan de omgeving. Over het algemeen vond ik het een fijne buurt om te wonen. Soms was het helaas wat minder netjes en kon het ook behoorlijk luidruchtig zijn. Toch zal het na zo’n lange tijd best even wennen zijn om hier weg te gaan. Ik kijk met gemengde gevoelens terug op de afgelopen jaren en ben benieuwd naar mijn nieuwe woonplek.
Auto-translated to English by AIEen bende!! Veel rokers met honden en veel luidruchtige, asociale jeugd op fatbikes die met name op het winkelcentrum rondhangen. Nu is het een bende, met dezelfde jeugd die hun afval overal op straat en in het groen gooien, er is echt ZOVEEL zwerfafval, ongelofelijk. Ontzettend vies rondom vuilnisbakken ook. Zelden tot nooit is er toezicht of surveillance, misschien als het wat rustiger is, kennelijk durft niemand niemand aan te spreken op hun gedrag. Je voelt je er niet veilig ieg. Verder veel kleine oude woningen en grote flats en weinig scholen.
Auto-translated to English by AICentraal maar toch rustig gelegen mooie groene straat in Arnhem. Nooit druk maar er is wel wat reuring.
Auto-translated to English by AIIk woon er al jaren, nooit problemen gehad met de buren/ buurt. Stad is lekker dichtbij, iedereen is er voor elkaar! Ik zal nooit naar een andere buurt willen verhuizen!…
Auto-translated to English by AIIk heb 12 jaar in orde gewoond en je ziet echt dat de buurt keihard achter uit gaat mijn mening kijk lekker verder als je onder de normale mensen wilt wonen. Iedereen gooit zijn afval naast de containers. Scholen falen om vatsoenlijk Nederlandse te geven. De woning bouw doet niks aan de veiligheid van de huurders, willen camera toezicht maar wordt afgewezen. Bij de voorzieningen hangt alleen maar jongere waardoor de kleine kinderen hier niet veilig kunnen spelen.
Auto-translated to English by AIIt is a beautiful, quiet neighbourhood, surrounded by nature. There are some spots where you wouldn't want to walk in the evening, but these are relatively few. The people are very involved with each other and have many mutual connections. However, people drive quite fast on the streets.
Auto-translated to English by AIOver the past year a home for sale in Gelderland was listed for an average of €529,310 (€4,082 per m²). Last quarter prices rose by 16%.
A rental home in Gelderland cost an average of €1,493 per month (€17 per m²). That is 31% below the national average.
Residents give Gelderland a 7.7 out of 10 based on 751 reviews.
The housing supply in Gelderland is remarkably efficient: 55% has an A, A+ or B label. The average natural gas consumption per household is 859 m³ per year.
From Gelderland you can on average reach a supermarket at 1.1 km, a GP at 1.2 km, a railway station at 4.0 km, a primary school at 0.8 km (as the crow flies, source: CBS).
Right now you will find 13,011 homes for sale and 1,195 homes for rent in Gelderland.