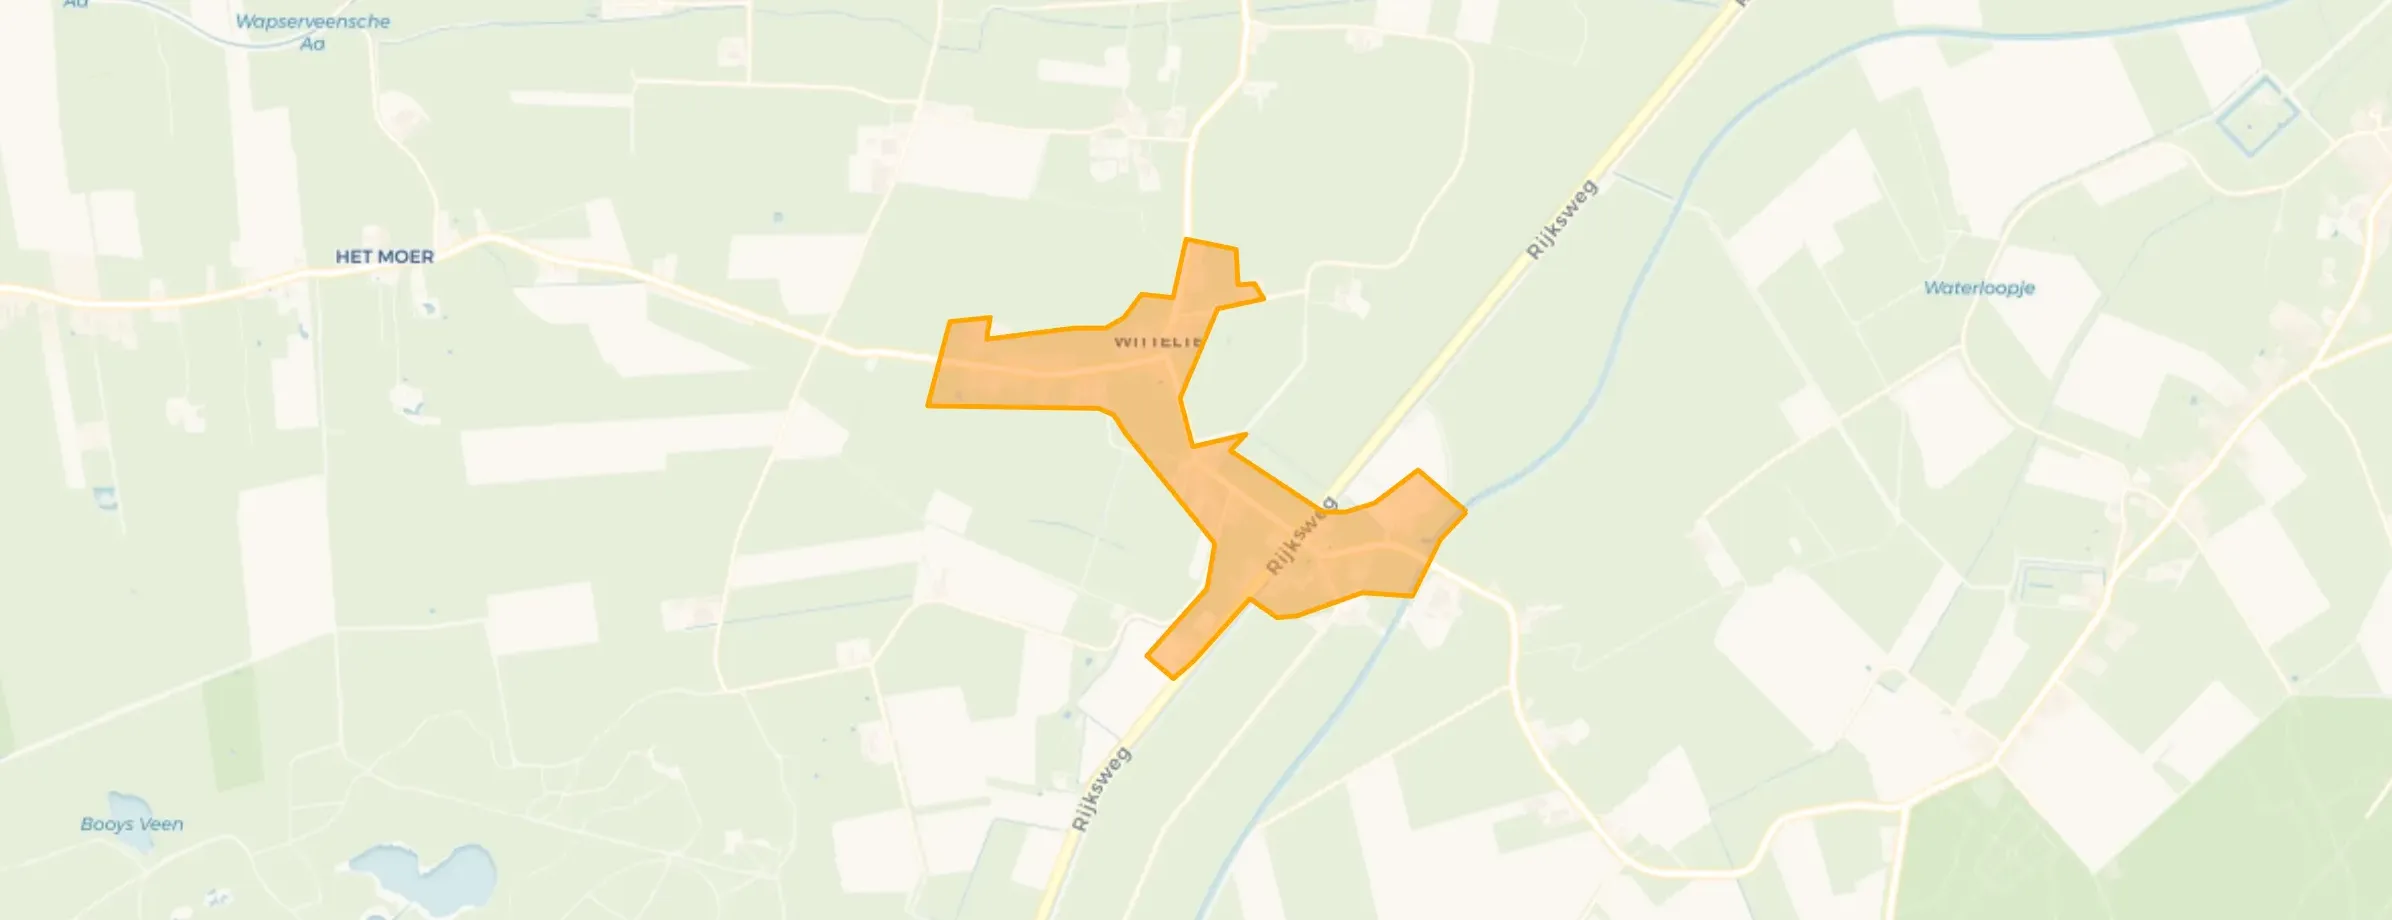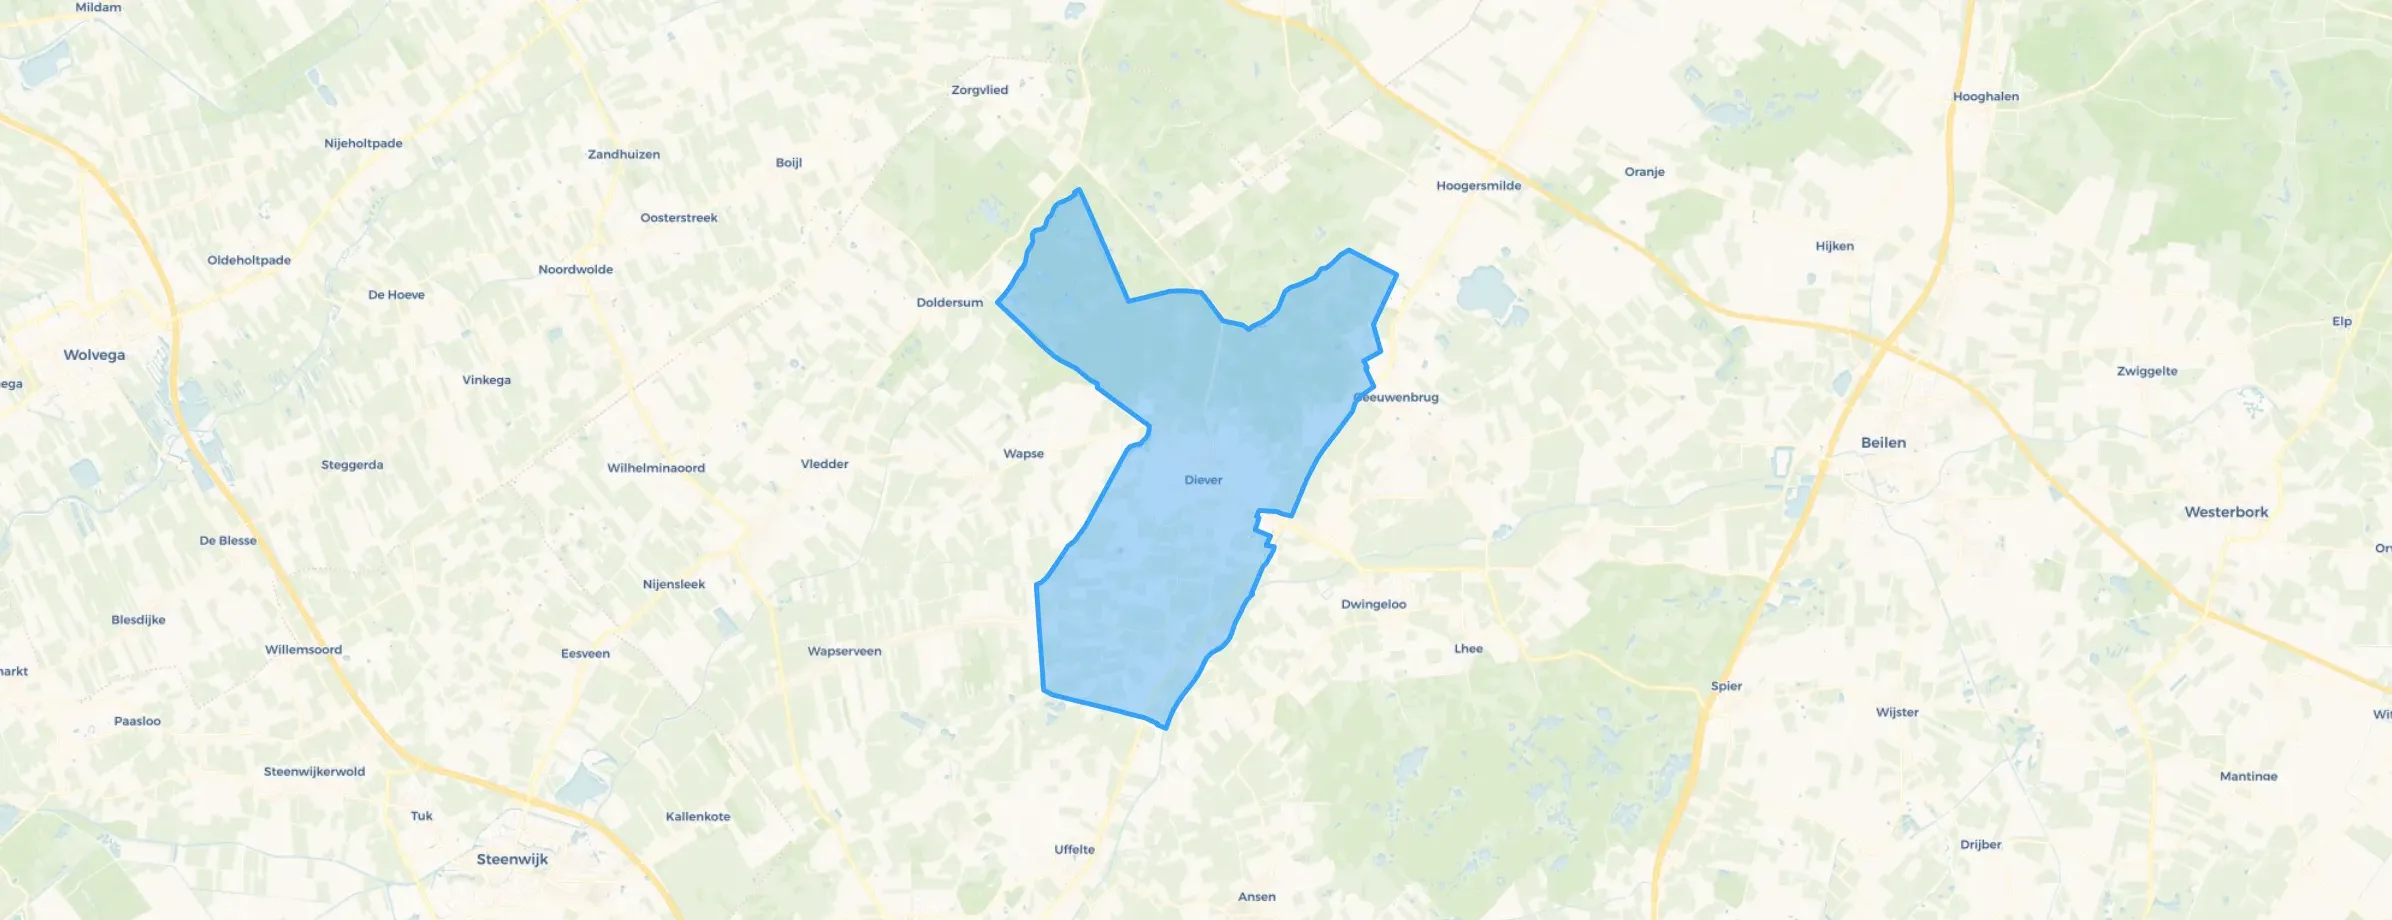
District in Westerveld
Diever is located in the province of Drenthe, in the municipality of Westerveld The district has a total area of 3.724 hectares, of which 3.694 hectares are land and 31 hectares are water. The district is coded as WK170100. The postcode area is 7981AA-8439SN.
Diever has 2.980 residents. Of these, 47,5% are men and 52,3% are women. Most residents are 65 years or older (34,7%). The other age groups are 28,4% for '45 to 65 years', 15,8% for '25 to 45 years', 12,8% for '0 to 15 years' and 8,2% for '15 to 25 years'. Of the residents, 36,1% is unmarried, 48,5% is married, 7,6% is divorced and 7,9% is widowed. 2.725 residents originate from the Netherlands, 115 come from Europe and 145 come from countries outside Europe.
There are 1.350 households in Diever. 32,2% of these are single-person households, 40,0% households without children and 27,8% households with children. The average household size is 2,1 persons.
In Diever there are 2.500 income recipients. The average income per income recipient is €34.300, which is €1.500 (4%) lower than the national average of €35.800. Per resident, the average income is €30.600, which is €1.400 (5%) higher than the national average of €29.200. Most residents of Diever are educated to an intermediate level. 44,0% have an intermediate education (HAVO, VWO or MBO 2-4), 33,3% have a university or higher professional education (HBO/WO) and 22,7% have a lower education (VMBO or MBO 1).
Of the 2.980 residents, around 60% are in paid employment, which amounts to 1.788 people. This is 5% lower than the national average of 65%. The majority of workers are in salaried employment (76%), while 24% are self-employed. In Diever, 37% of residents receive a benefit. The largest group is those receiving a state pension (AOW). 930 people receive this benefit.
In Diever there are 1.361 homes with an average assessed value (WOZ) of €374.000. Of these, around 97% are occupied and 3% unoccupied. Most homes are owner-occupied. This amounts to 27% rental homes and 73% owner-occupied homes. Of the homes, 73% privately owned, 21% owned by housing associations and 6% owned by other landlords. The most common construction periods in Diever are 1990-2000 (25%) and 1950-1970 (14%).
There are currently no homes for sale in Diever. The most recently listed home is Broekemastraat 56 by Alderik Vos Makelaardij NVM | Buitenstate op Funda. No homes were sold in Diever over the past year.
There are currently no homes for rent in Diever. The most recent home is De Wijert 119, offered by www.thuiskompas.nl. No homes were let in Diever over the past year.
No recent rental data available for Diever.
In Diever there are 1.547 addresses with a registered energy label. The most common labels are A (27%), C (23%) and B (21%). On average, an address in Diever uses 2.880 kWh of electricity per year. This is 2% above the national average of 2.810 kWh. Natural gas consumption, at 1.370 m³ per year, is 7% above the national average of 1.280 m³.
Since I live alone, I constantly suffer from burglary and also the pulling up of my garden; there is no herb against it. I have been electrocuted, walked with a large bump for 2 years, and experienced worse things; the police act as if I'm making it up. All my valuables and memories of my family were stolen; I made a donation but have to provide proof. The foundation of my building has been pulled away so it's leaning, etc.; my curtains stolen, everything torn apart, even my clothes are ruined. Eventually the police did something about it and were friendly. After changing my lock 100 times, I discovered that someone climbs through the roof and there is a hatch from a roof point where I live below, where I had made my clothes storage; holes in a dress so I could be spied on. Yes, so sad, and someone who tells things to anyone who wants to hear, which I can't even think about what I do then. Disgusting people; his wife walked with the mail which was read first, and also through burglary my data was all within reach and everything was used; I was hacked and scammed. Eventually you realize that; really sickening, people without any empathy for others, materialistic. So first blacken someone and then no one sees anything, everything is fine. I keep to myself and focus on other things because I can't relate to this; also don't want to become angry, but this naturally costs nerves; still busy finding a solution with my nothing against pulling out windows, etc., opening windows, which was done later since the hatch is closed. Neighbors see nothing; the latest is that a step was made crooked so that when I climbed it, it fell, but I fortunately saved myself by grabbing a rebate. So my chair has a crooked leg, etc.; you can think of things they haven't touched. I had leaks for months and things soaked, and never got anything back from insurance, etc. This through roof climbing. Because of all this, I am in a scheme, and it hasn't become easier; on the contrary.
Auto-translated to English by AI
The most common type is detached houses (49%).
Over the past year a home for sale in Diever was listed for an average of €621,321 (€3,954 per m²). Last quarter prices rose by 27%.
Wijk Diever has 2,980 residents. The largest age group is 65+ years (35%).
The housing supply in Diever is remarkably efficient: 71% has an A, A+ or B label. The average natural gas consumption per household is 1,370 m³ per year.
From Diever you can on average reach a supermarket at 1.2 km, a GP at 1.4 km, a railway station at 16.3 km, a primary school at 1.1 km (as the crow flies, source: CBS).
Right now you will find 40 homes for sale in Diever.

Buurtje.nl uses cookies to make the site work and to improve it. In doing so, we process data such as your IP address and the pages you visit.
We use this data for three purposes: running the website (functional), measuring visits so we can improve Buurtje.nl (analytics), and — if you allow it — tailoring ads to your interests (marketing).
How we handle your data is described in our privacy policy. You can change your preferences at any time via 'Cookie preferences' at the bottom of every page.
Choose per category which cookies we may place. Read more in our privacy policy.