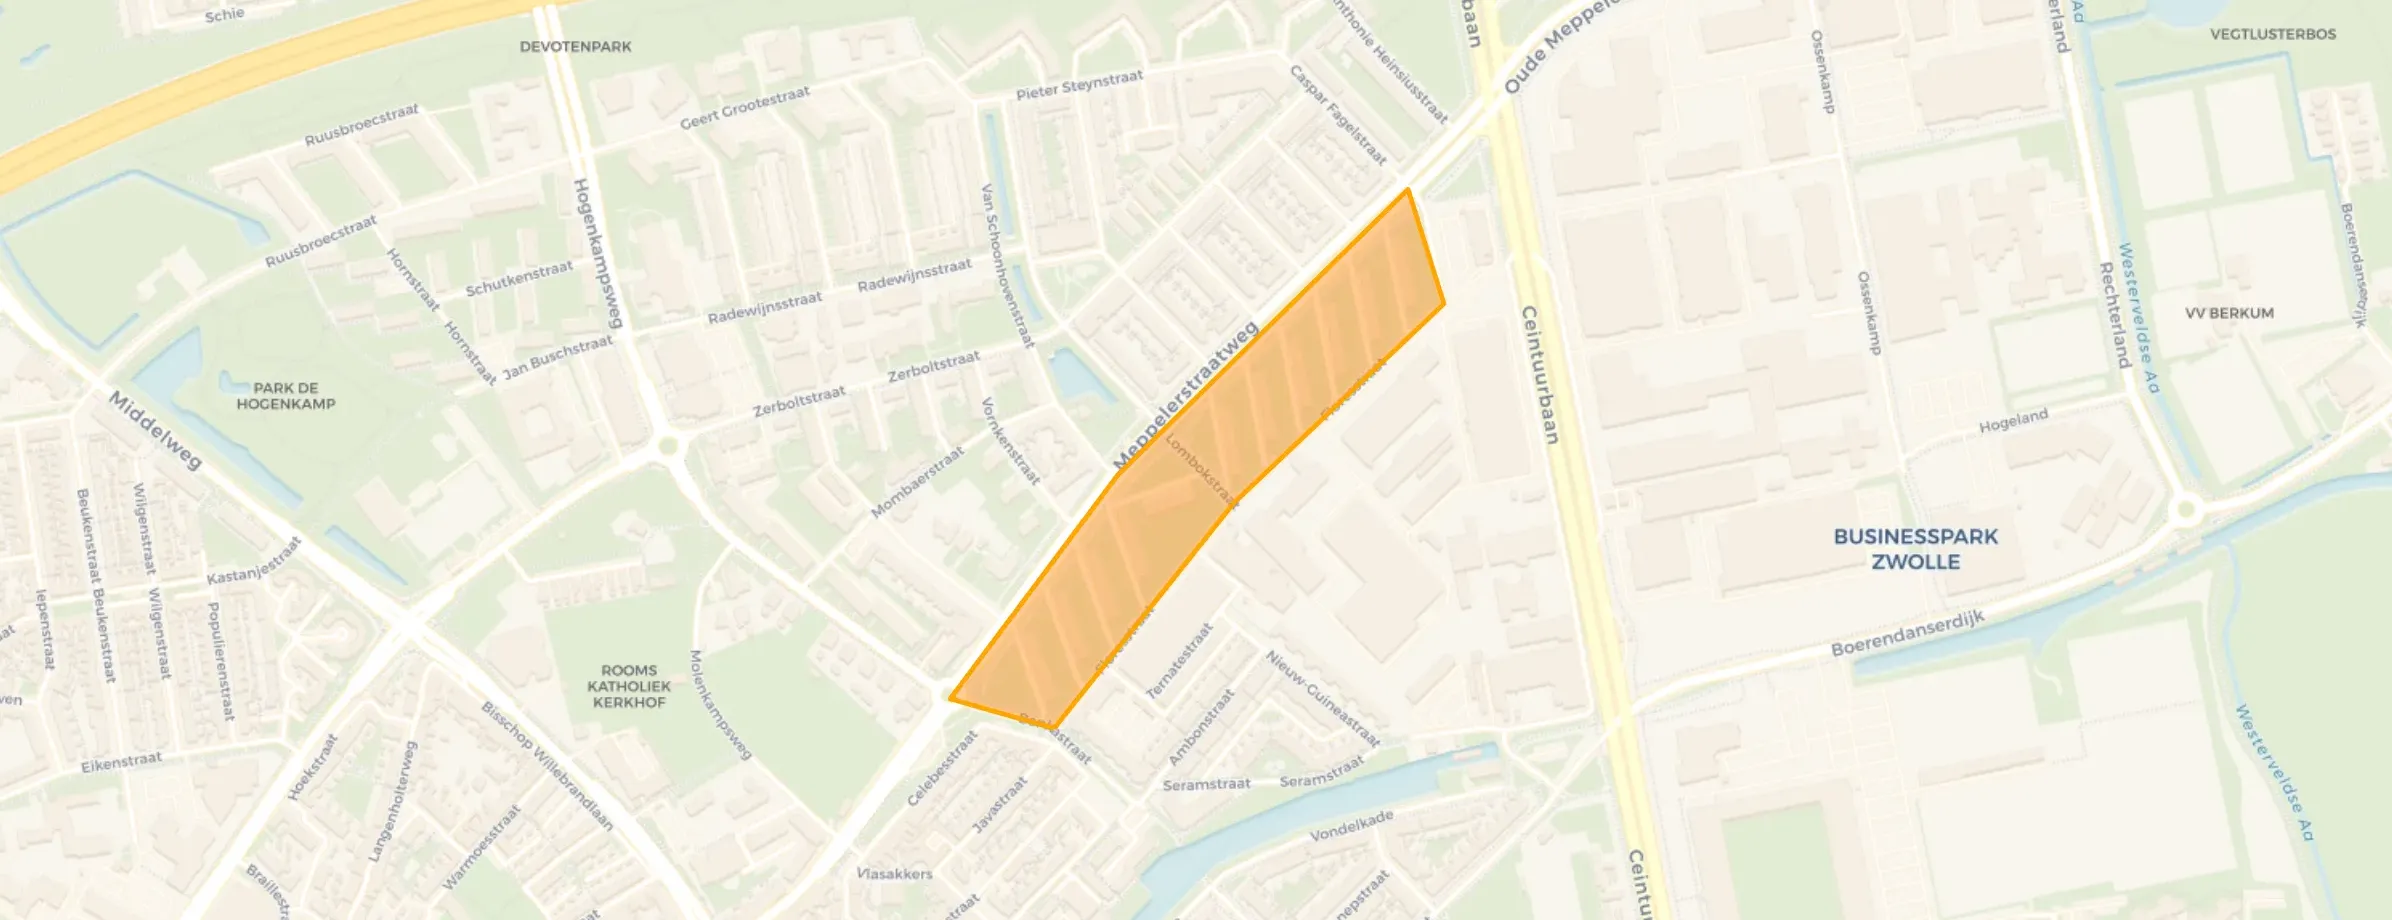
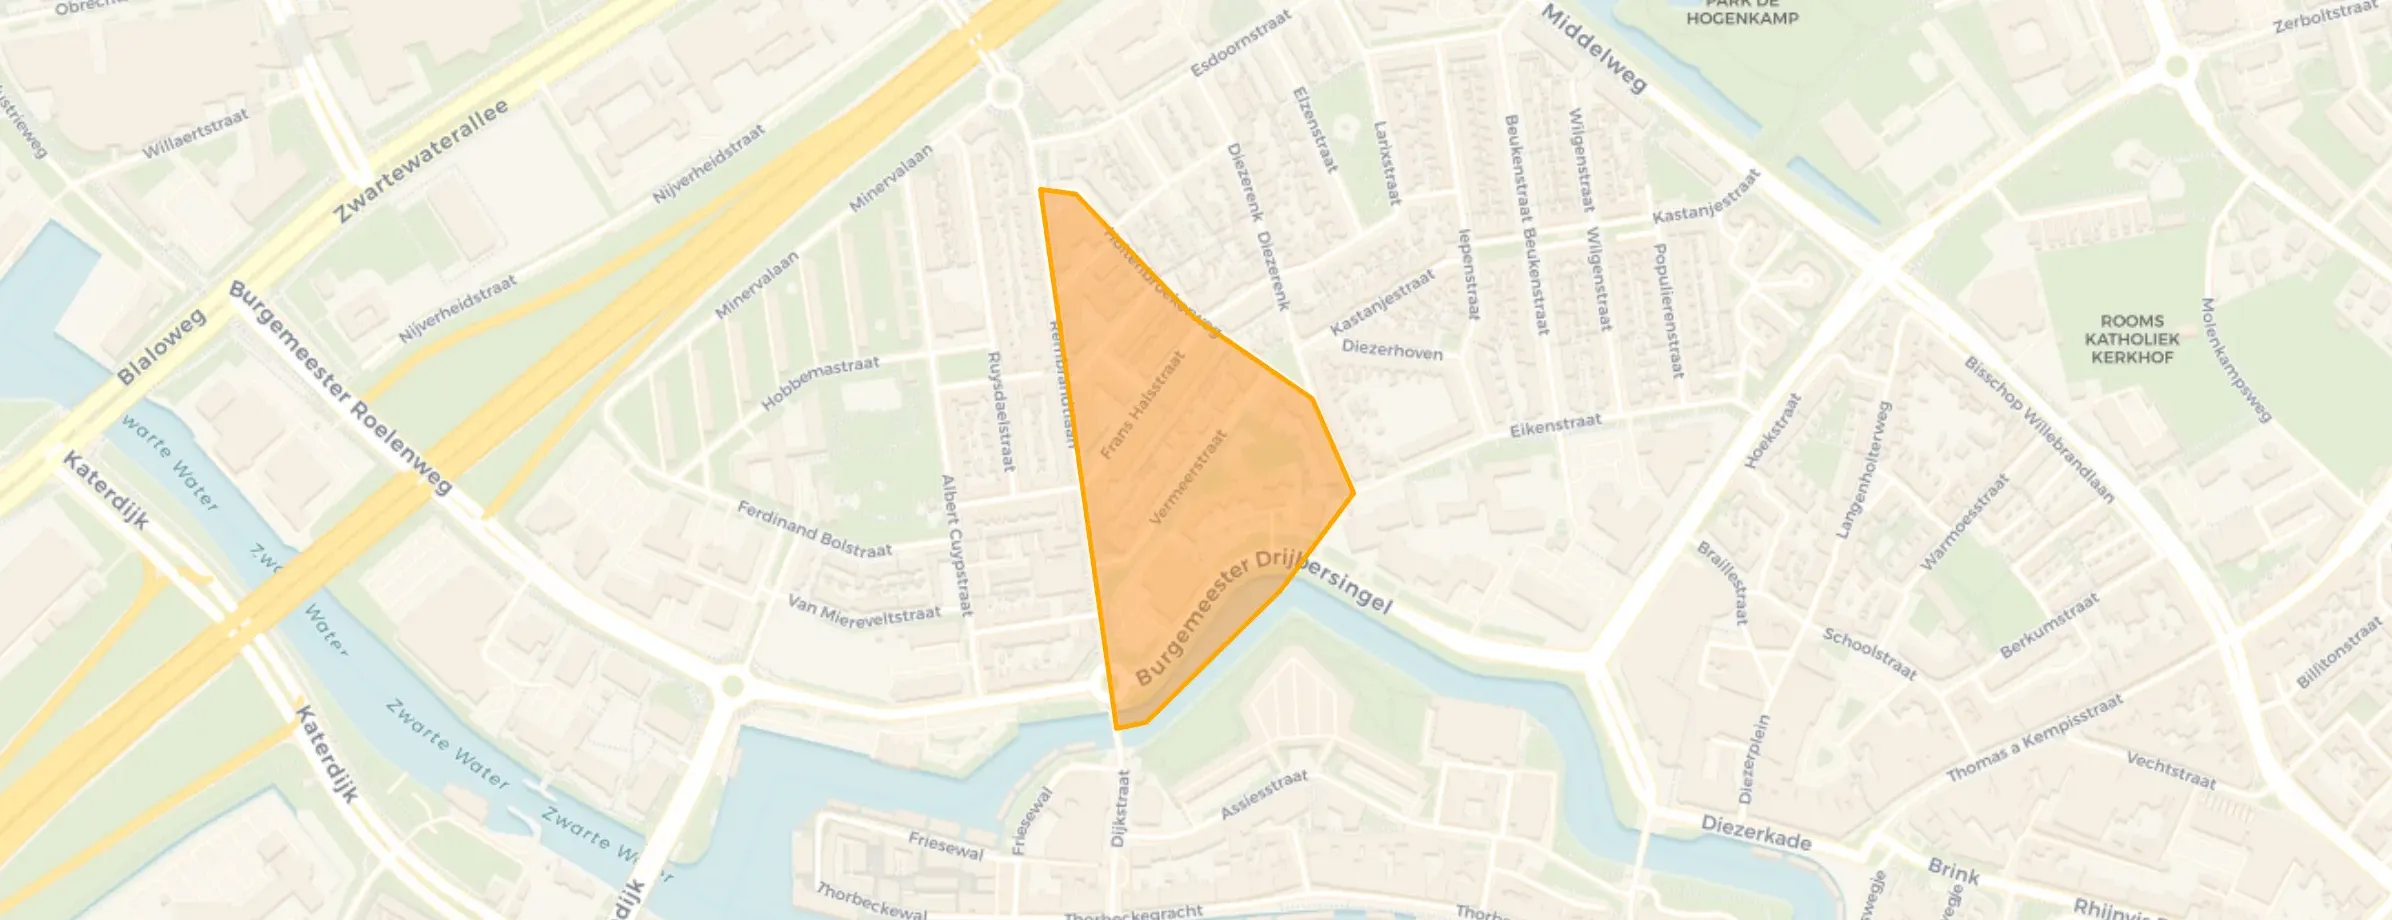
District in Zwolle
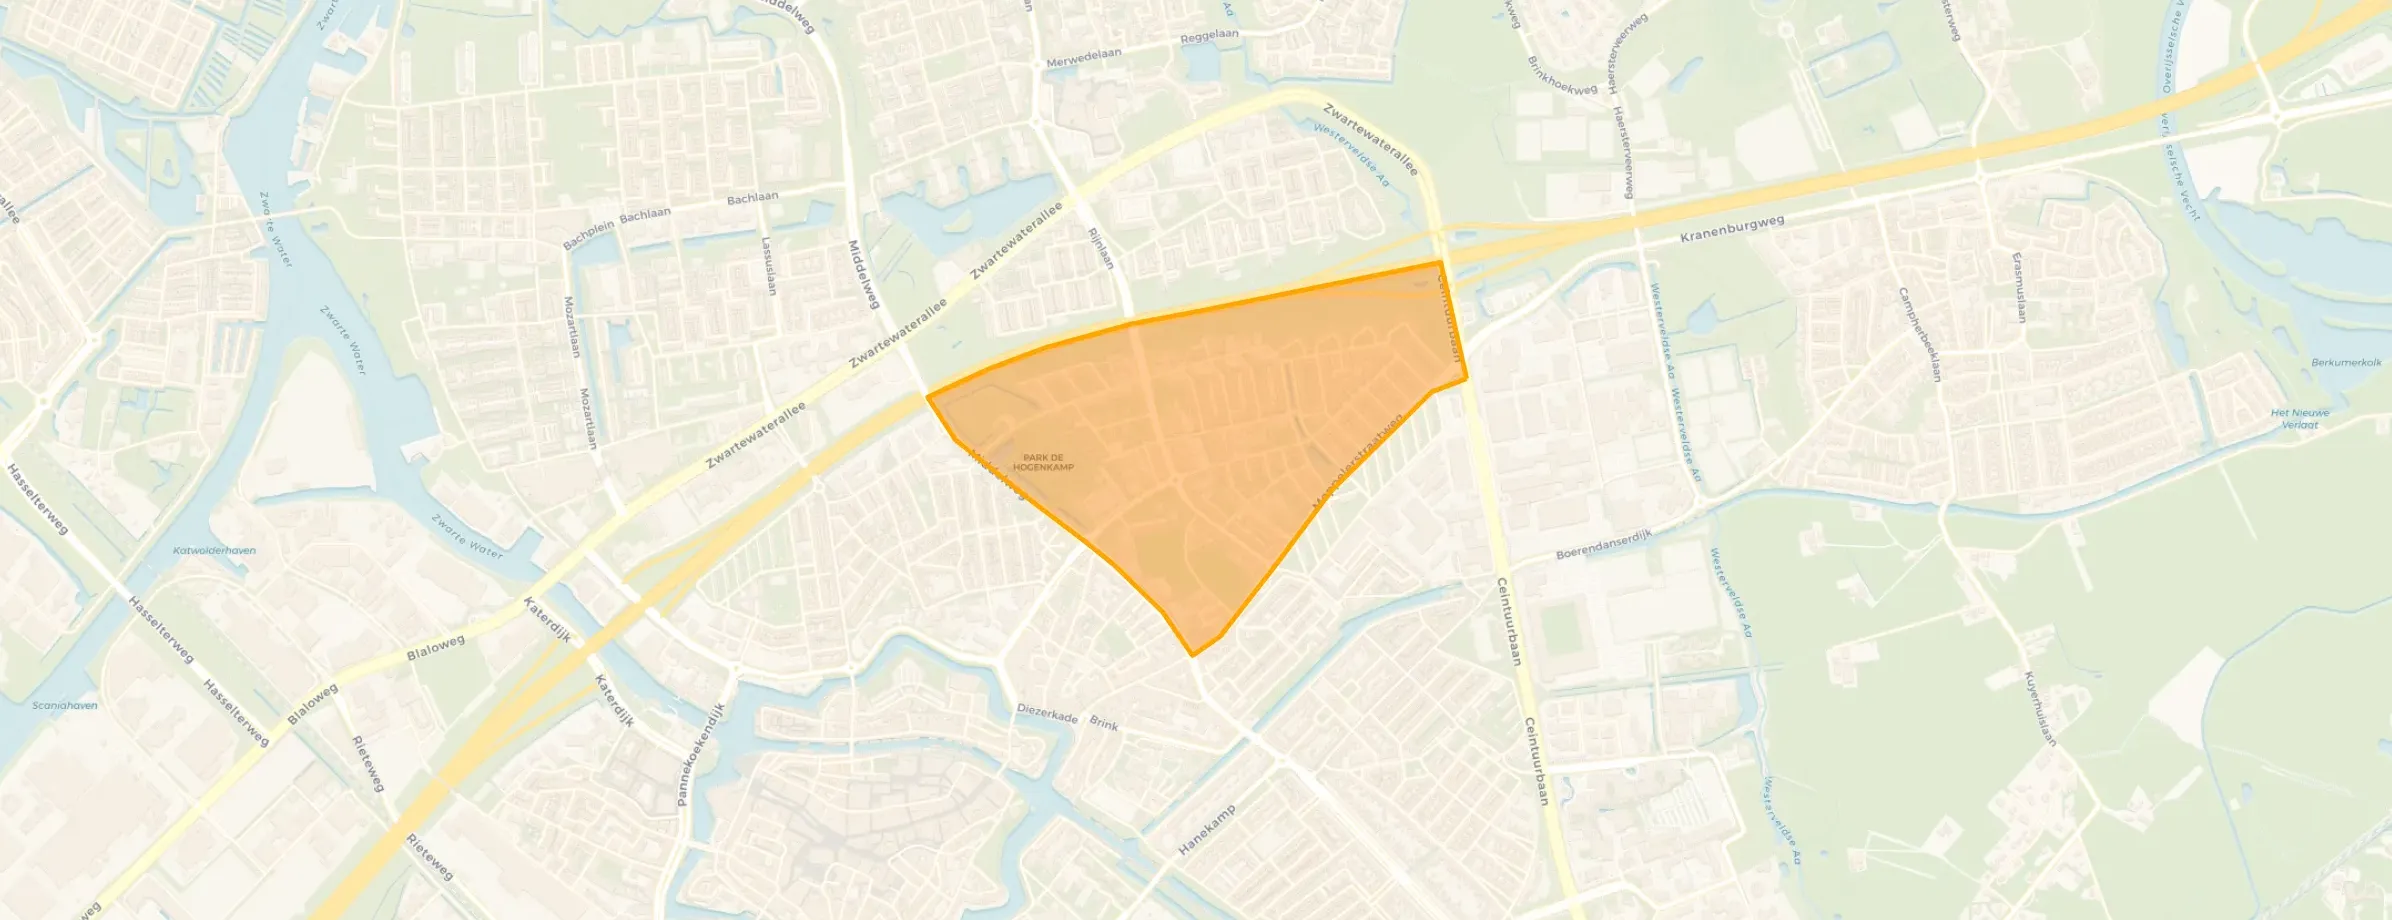
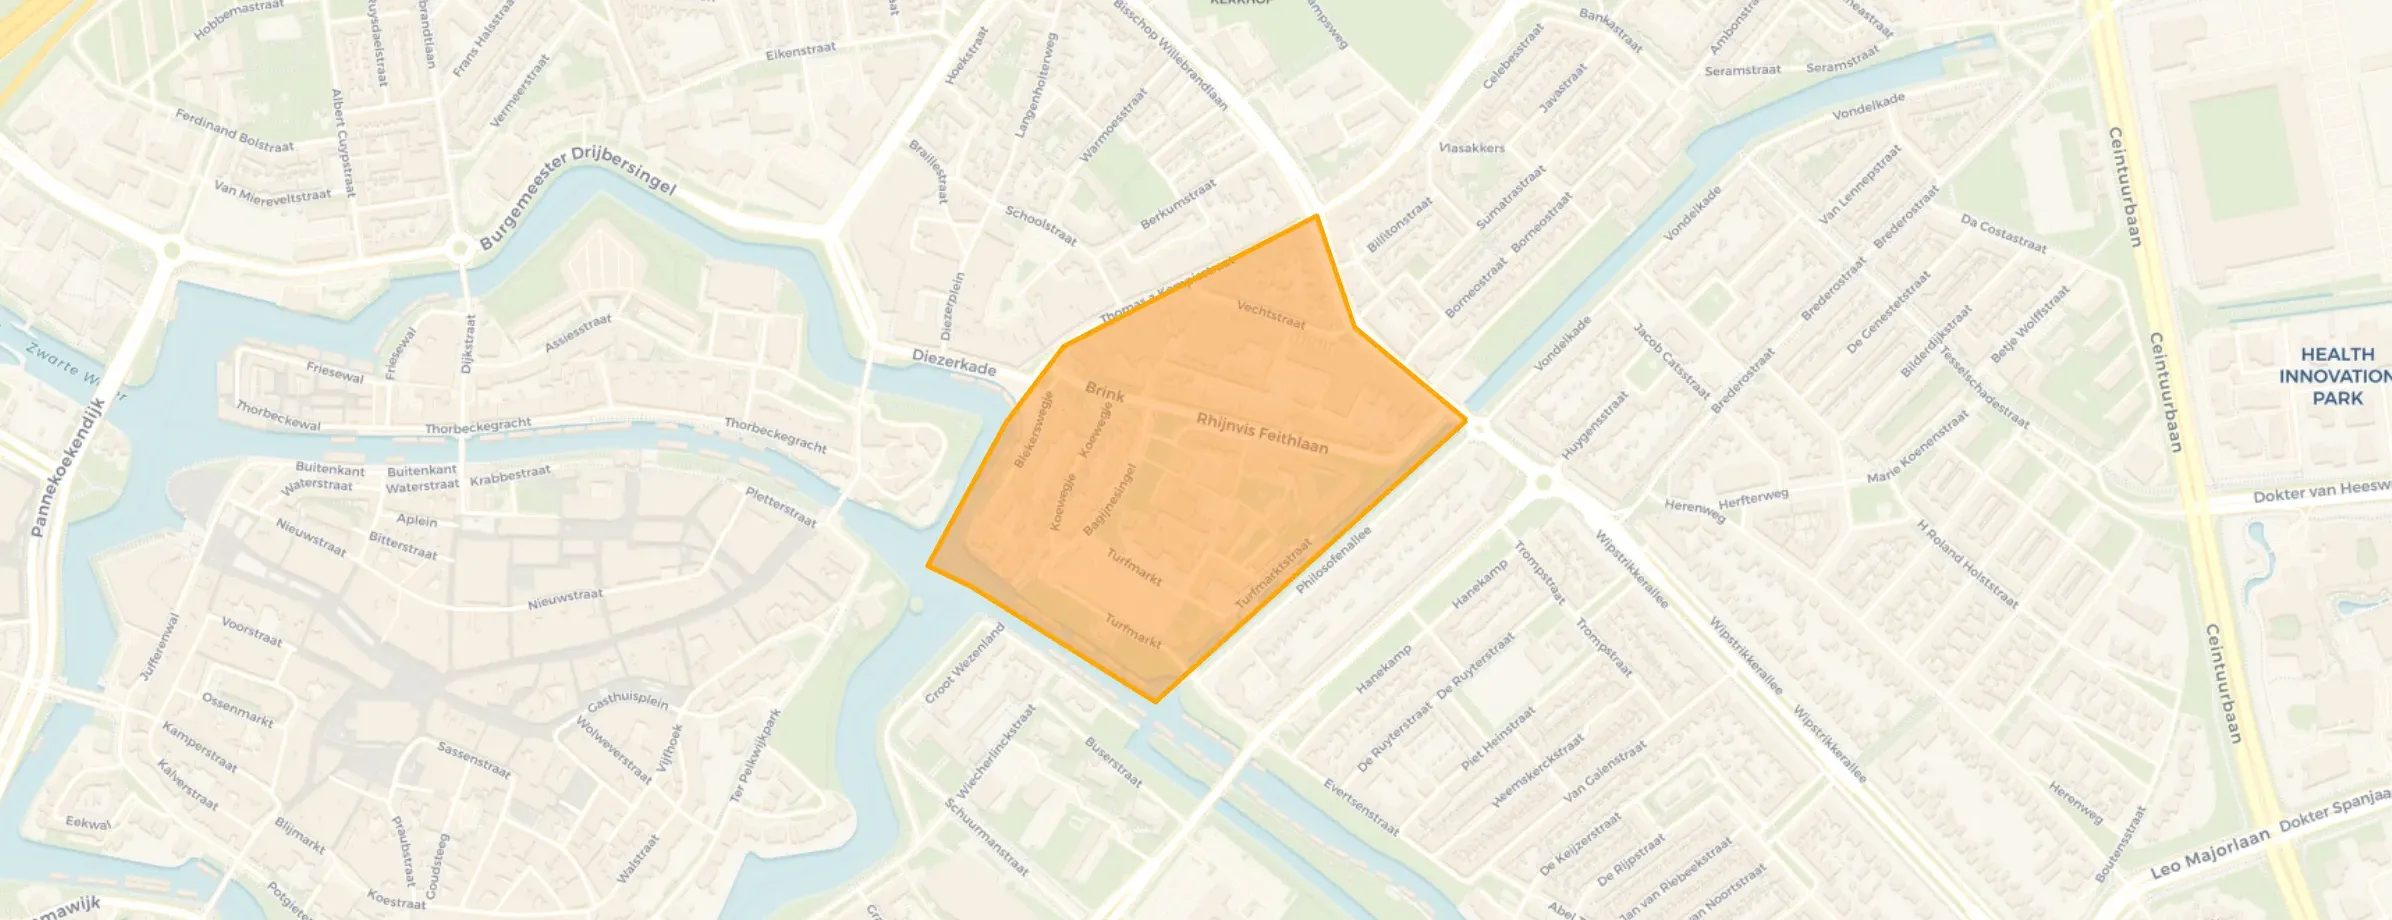
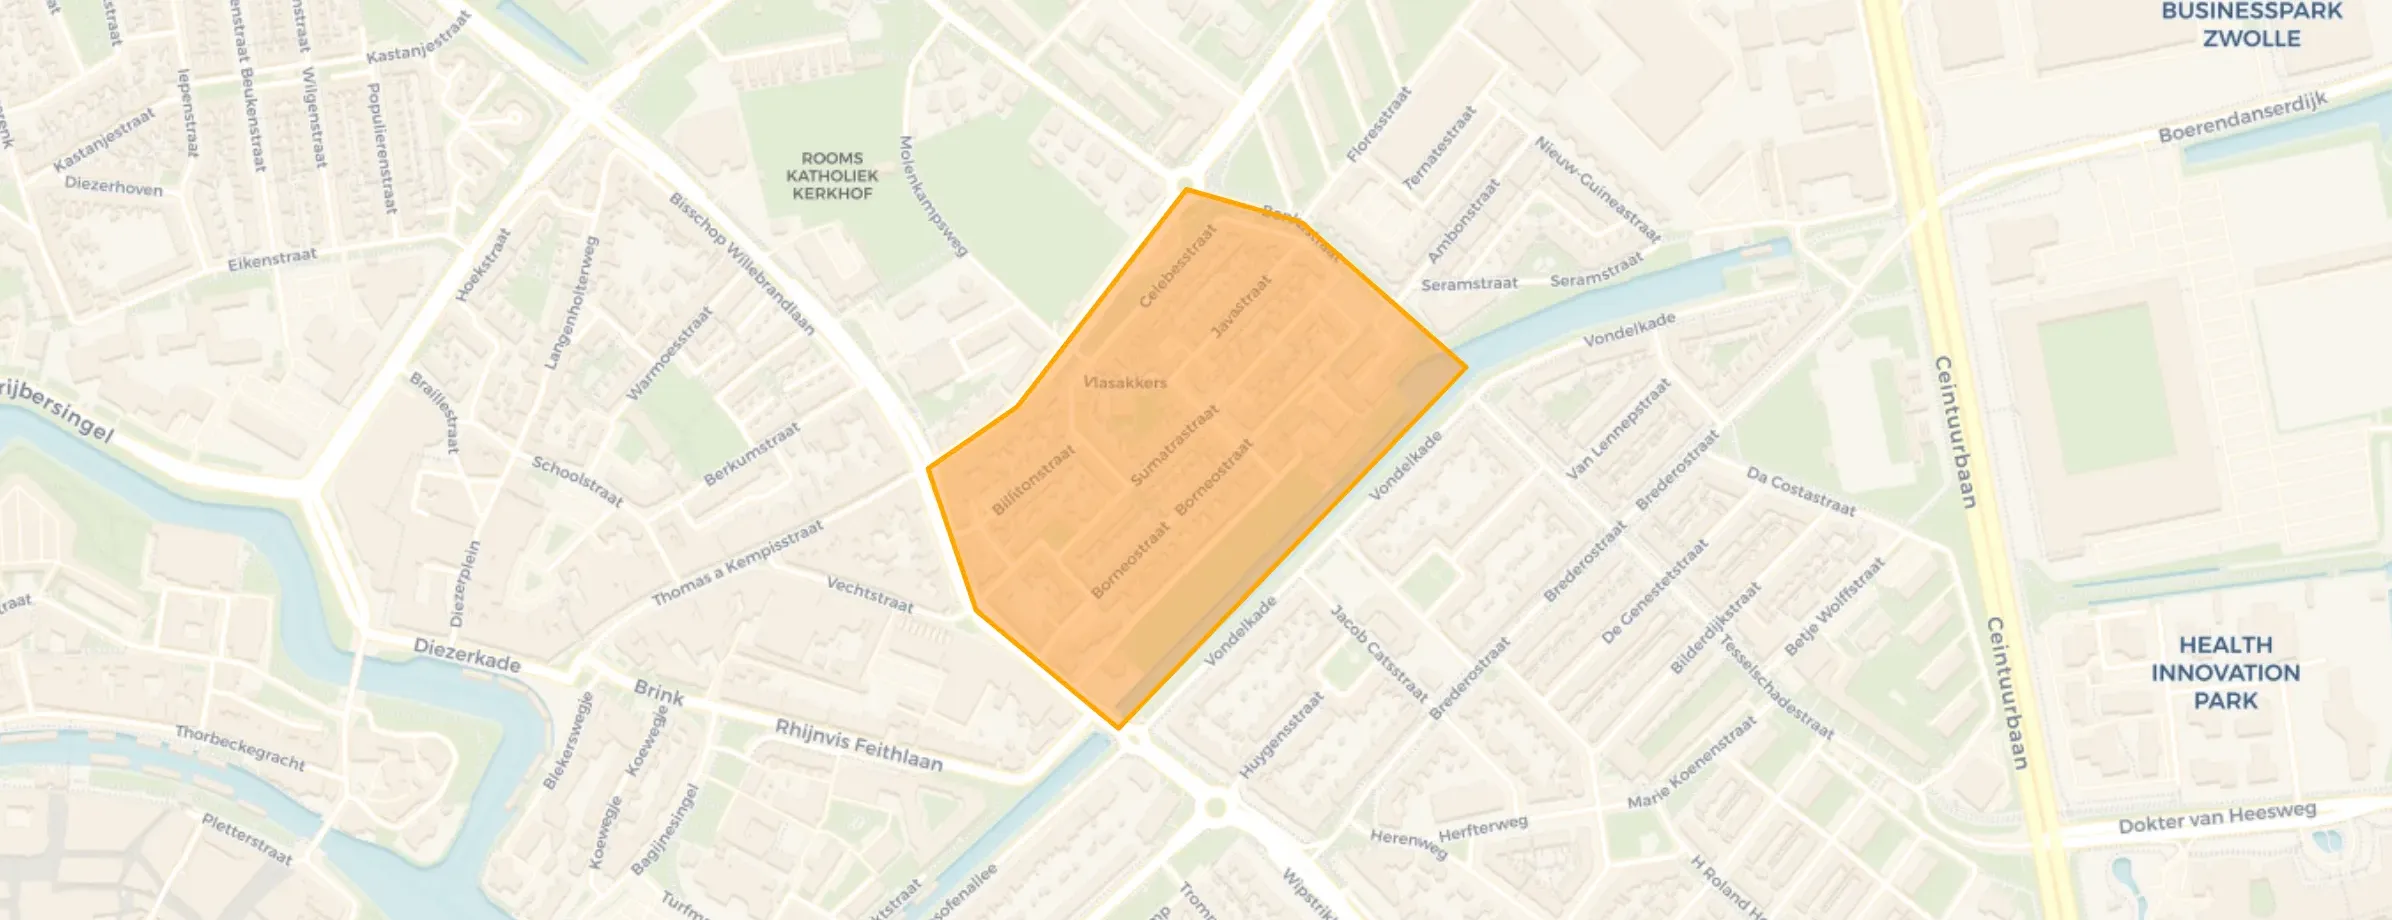
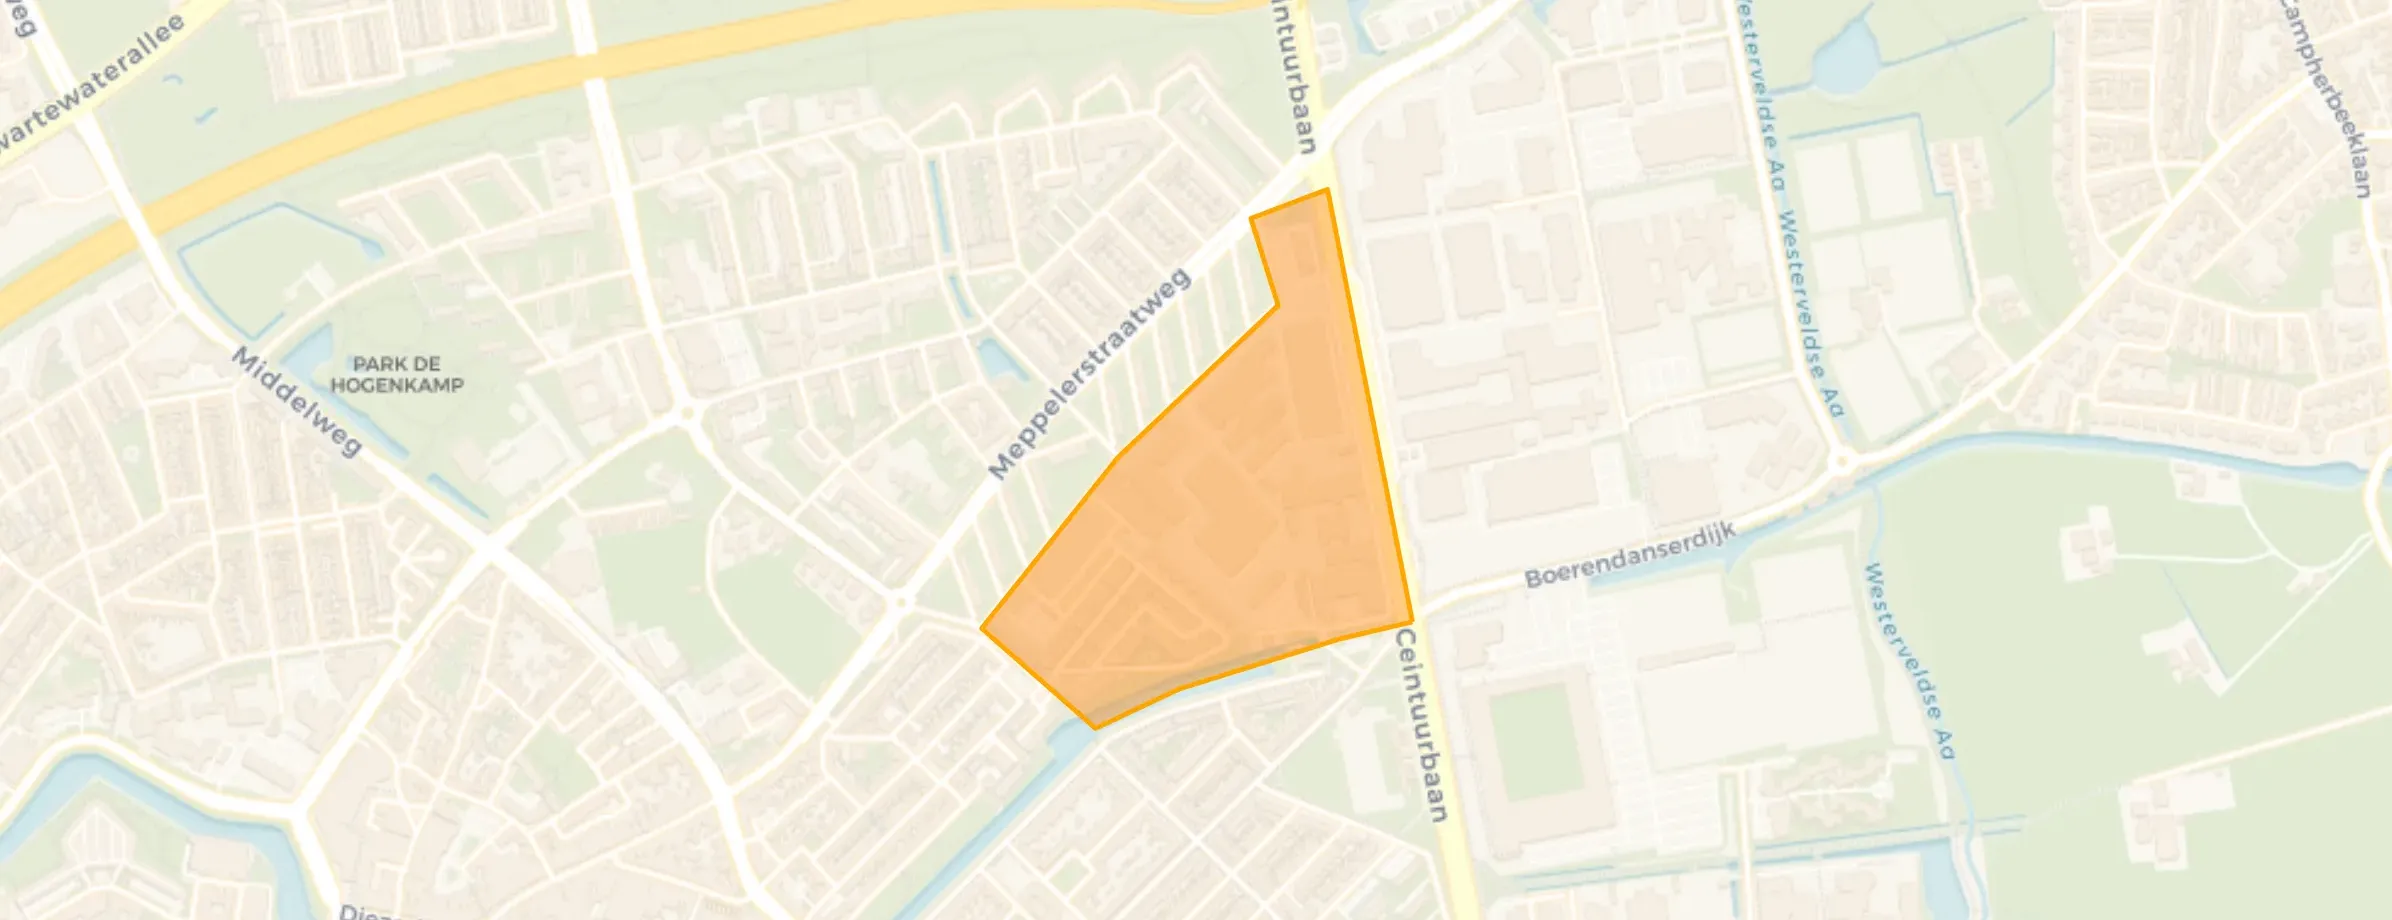
Diezerpoort is located in the province of Overijssel, in the municipality of Zwolle The district has a total area of 189 hectares, of which 184 hectares are land and 5 hectares are water. The district is coded as WK019311. The postcode area is 8011BJ-8024AE.
Diezerpoort has 10.930 residents. Of these, 49,7% are men and 50,2% are women. Most residents are 25 to 45 years (39,6%). The other age groups are 19,8% for '45 to 65 years', 15,2% for '15 to 25 years', 13,7% for '65 years or older' and 11,7% for '0 to 15 years'. Of the residents, 66,2% is unmarried, 20,5% is married, 9,1% is divorced and 4,0% is widowed. 7.740 residents originate from the Netherlands, 710 come from Europe and 2.480 come from countries outside Europe.
There are 6.765 households in Diezerpoort. 64,2% of these are single-person households, 18,6% households without children and 17,3% households with children. The average household size is 1,6 persons. The national average is 2,1 persons.
In Diezerpoort there are 9.400 income recipients. The average income per income recipient is €35.500, which is €6.700 (16%) lower than the national average of €42.200. Per resident, the average income is €30.900, which is €4.000 (11%) lower than the national average of €34.900. Most residents of Diezerpoort are educated to an intermediate level. 38,1% have an intermediate education (HAVO, VWO or MBO 2-4), 37,8% have a university or higher professional education (HBO/WO) and 24,2% have a lower education (VMBO or MBO 1).
Of the 10.930 residents, around 72% are in paid employment, which amounts to 7.870 people. This is 0% lower than the national average of 72%. The majority of workers are in salaried employment (88%), while 12% are self-employed. In Diezerpoort, 26% of residents receive a benefit. The largest group is those receiving a state pension (AOW). 1.330 people receive this benefit.
In Diezerpoort there are 6.648 homes with an average assessed value (WOZ) of €265.000. Of these, around 96% are occupied and 4% unoccupied. Most homes are rental properties. This amounts to 75% rental homes and 25% owner-occupied homes. Of the homes, 25% privately owned, 56% owned by housing associations and 19% owned by other landlords. The most common construction periods in Diezerpoort are 1950-1970 (31%) and 2010-2020 (14%).
There are currently no homes for sale in Diezerpoort. The most recently listed home is Ruysdaelstraat 32 by Zomer Makelaars op Funda. No homes were sold in Diezerpoort over the past year.
There are currently no homes for rent in Diezerpoort. The most recent home is Pieter Steynstraat 101, offered by www.dewoningzoeker.nl. No homes were let in Diezerpoort over the past year.
No recent rental data available for Diezerpoort.
In Diezerpoort there are 5.482 addresses with a registered energy label. The most common labels are A (47%), B (16%) and C (14%). On average, an address in Diezerpoort uses 1.760 kWh of electricity per year. This is 31% below the national average of 2.550 kWh. With an annual consumption of 620 m³ per address, natural gas consumption is 23% below the national average of 800 m³.
Ik woon hier al bijna mijn hele leven, nergens woon je zo veilig en fijn als hier. Iedereen staat voor elkaar klaar. Er worden altijd al negatieve verhalen verteld voordat mensen ervoor kiezen om hier te komen wonen, ze gaan er altijd mee eens, en dan kijken ze al met een verkeerde blik naar de buurt. Nu zijn er ook zoveel andere mensen van buiten zwolle etc. hier komen wonen, met iedereen is er normaal contact. Maargoed, ieder zijn eigen mening.
Auto-translated to English by AIIt's a nice but busy neighbourhood, there are many young children and elderly people living here, which does make the neighbourhood flourish a bit. It's next to a nice and fairly large park where people walk their dogs every day. The violence in the street could be less, though.
Auto-translated to English by AINot much contact with the neighbours
Auto-translated to English by AIN/A
Auto-translated to English by AIA quiet neighbourhood
Auto-translated to English by AIIt's a lovely neighbourhood close to the city, but also close to the nature of Berkum.
Auto-translated to English by AIWhen I first moved in, unfortunately a bike was stolen from our shed. Apart from that, I've had little trouble and it's a very pleasant location!
Auto-translated to English by AII don't really know yet, haven't lived here long
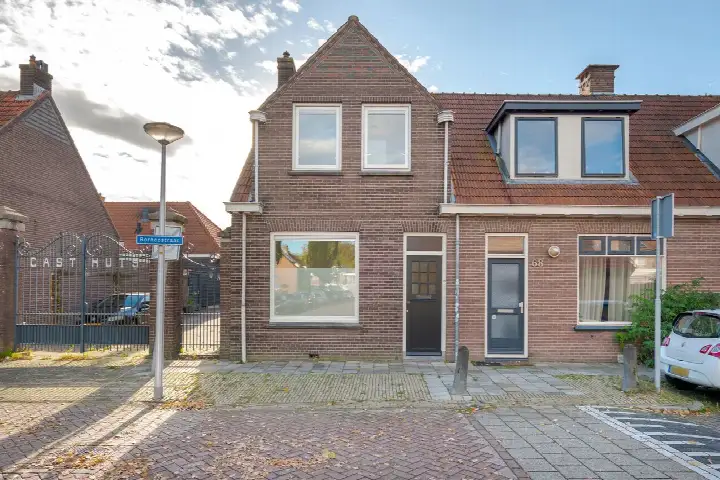
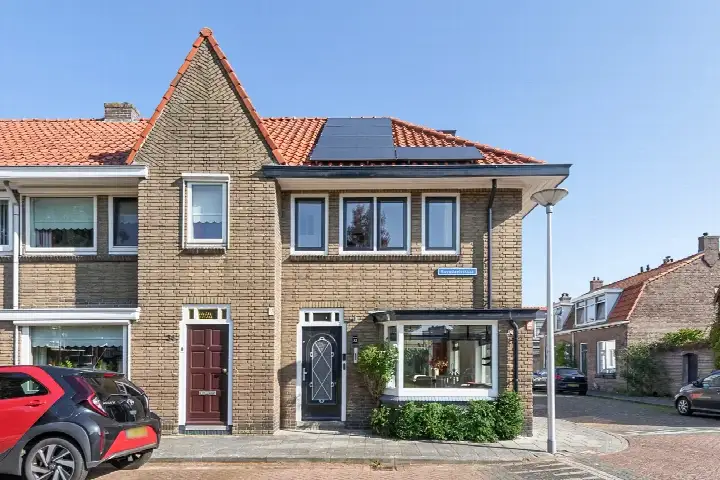
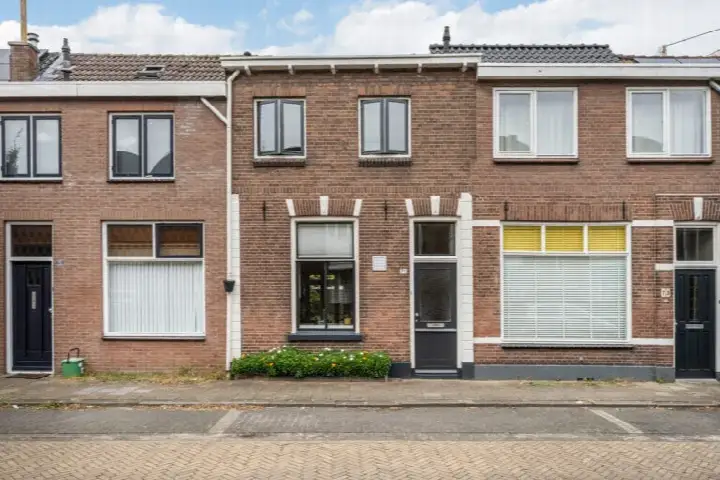
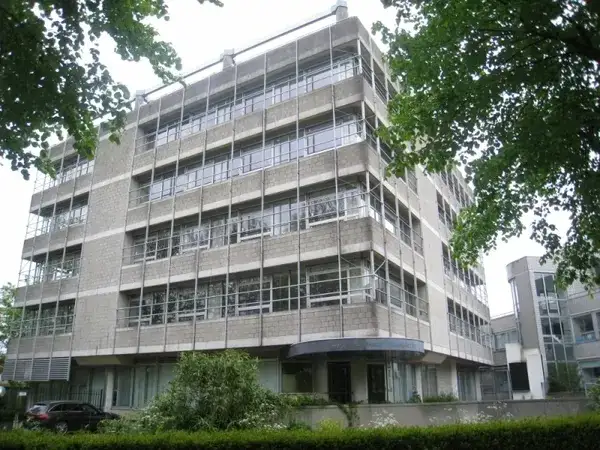
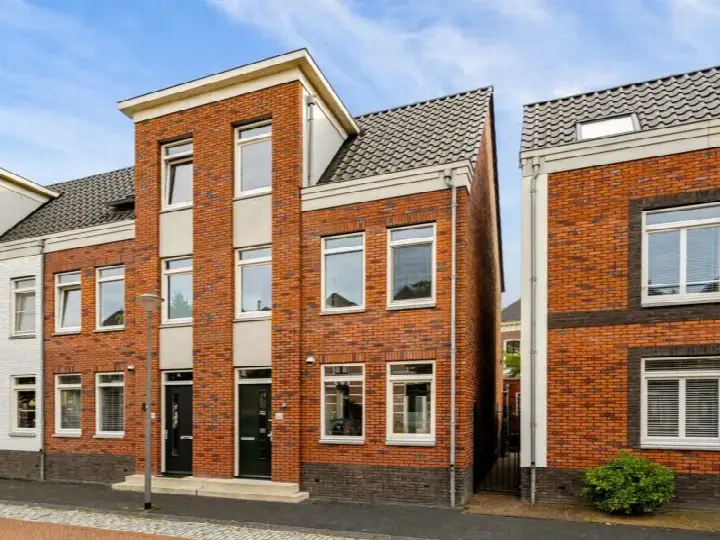
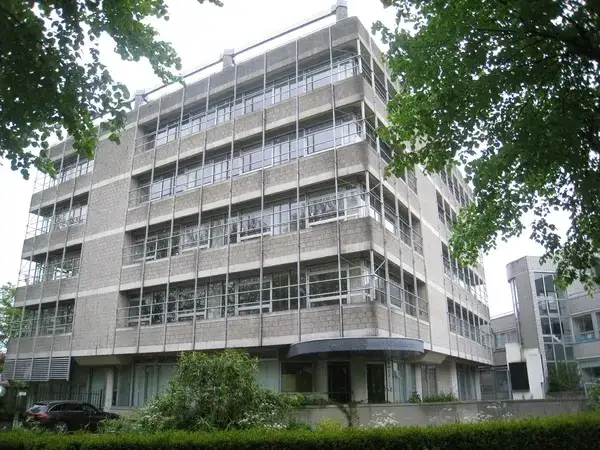
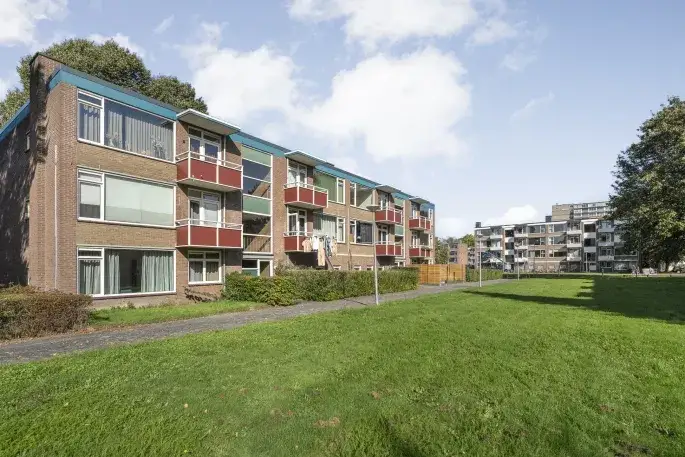
Auto-translated to English by AIThe housing stock is mainly post-war — 54% was built between 1945 and 1990. In addition, the most common type is flats (67%).
Over the past year a home for sale in Diezerpoort was listed for an average of €358,295 (€4,495 per m²). That is 32% below the Dutch national average. Last quarter prices rose by 5%.
A rental home in Diezerpoort cost an average of €1,026 per month (€21 per m²). That is 52% below the national average.
Residents give Diezerpoort a 7.0 out of 10 based on 11 reviews. The strongest score is for amenities (7.8), the weakest for cleanliness (6.2).
Wijk Diezerpoort has 10,930 residents. The largest age group is 25 to 45 years (40%). Notably, 64% of the households are single-person households.
The housing supply in Diezerpoort is remarkably efficient: 53% has an A, A+ or B label. The average natural gas consumption per household is 620 m³ per year.
From Diezerpoort you can on average reach a supermarket at 0.4 km, a GP at 0.5 km, a railway station at 2.2 km, a primary school at 0.7 km (as the crow flies, source: CBS).
Right now you will find 51 homes for sale and 20 homes for rent in Diezerpoort.