District in Oldambt
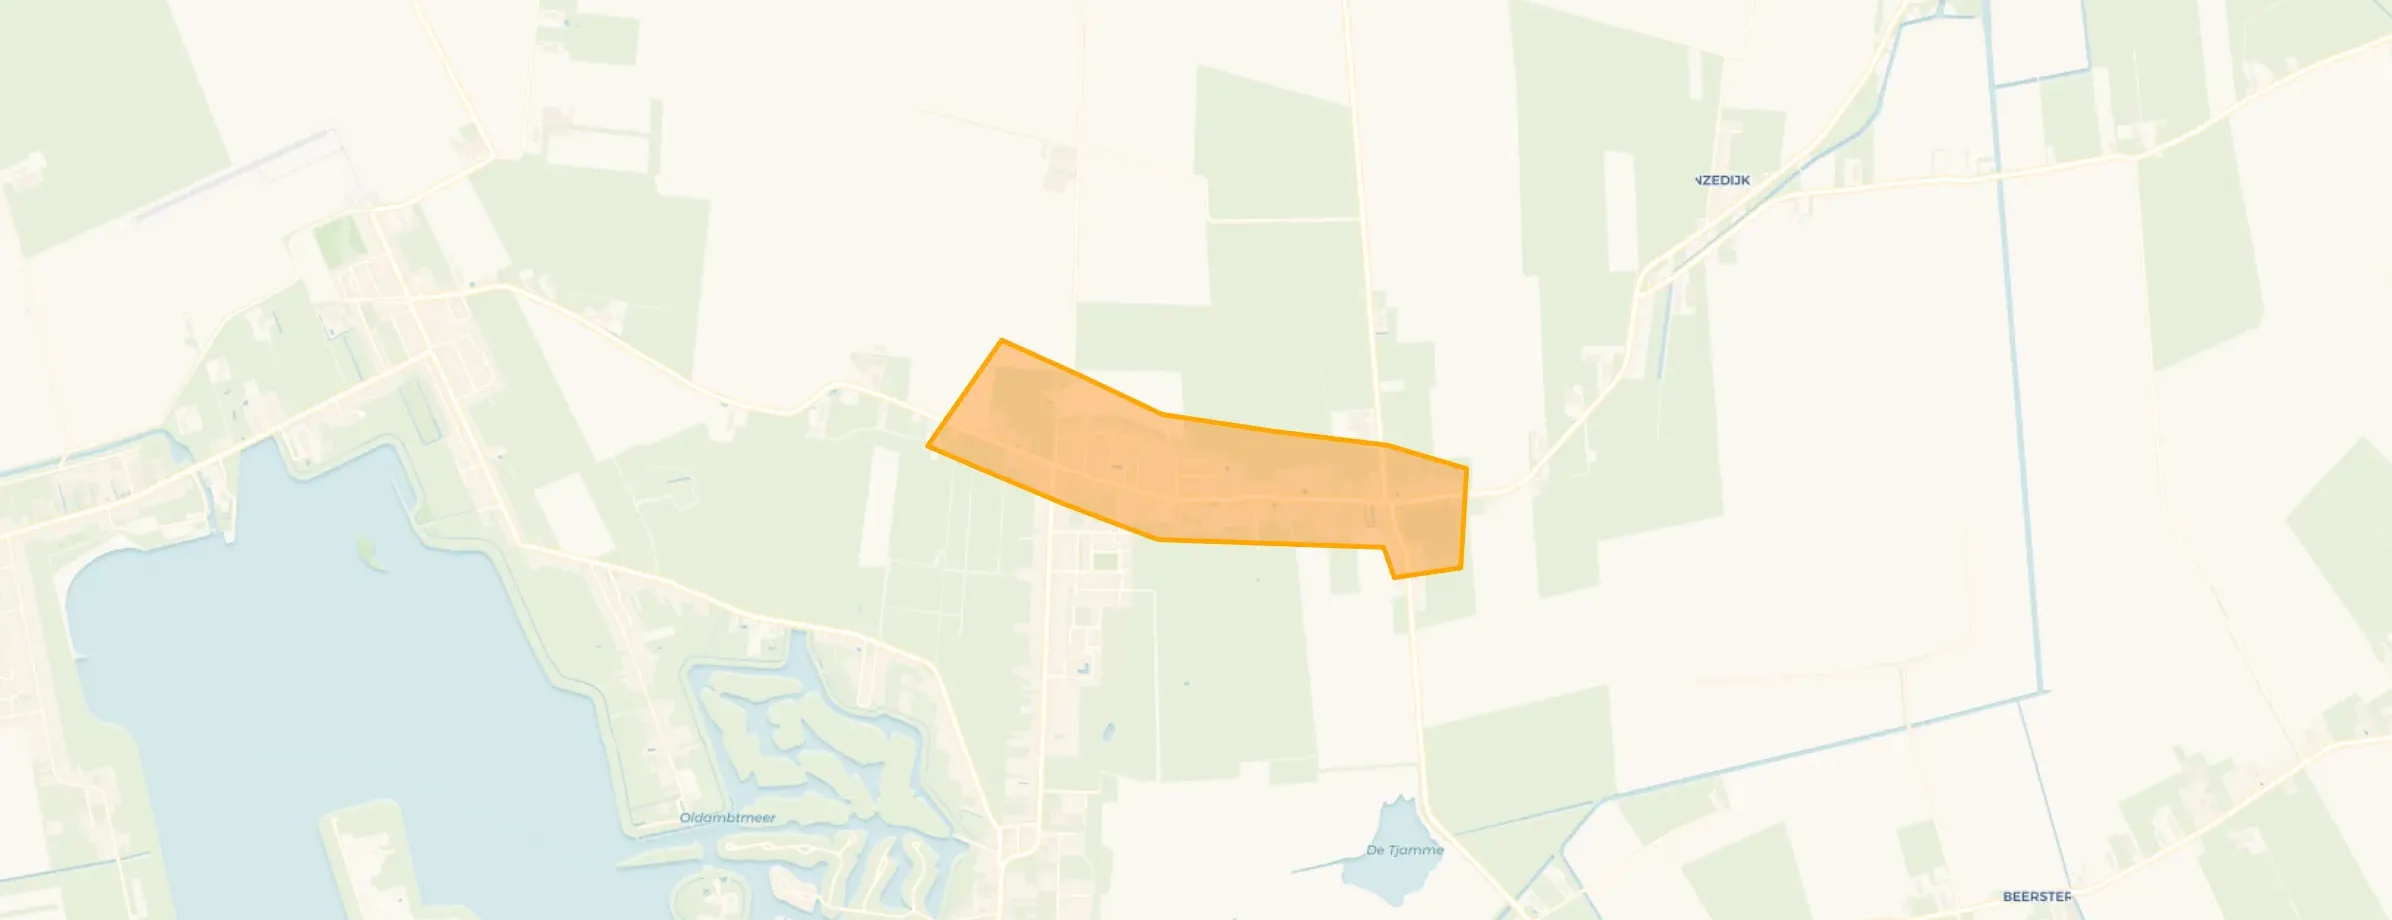
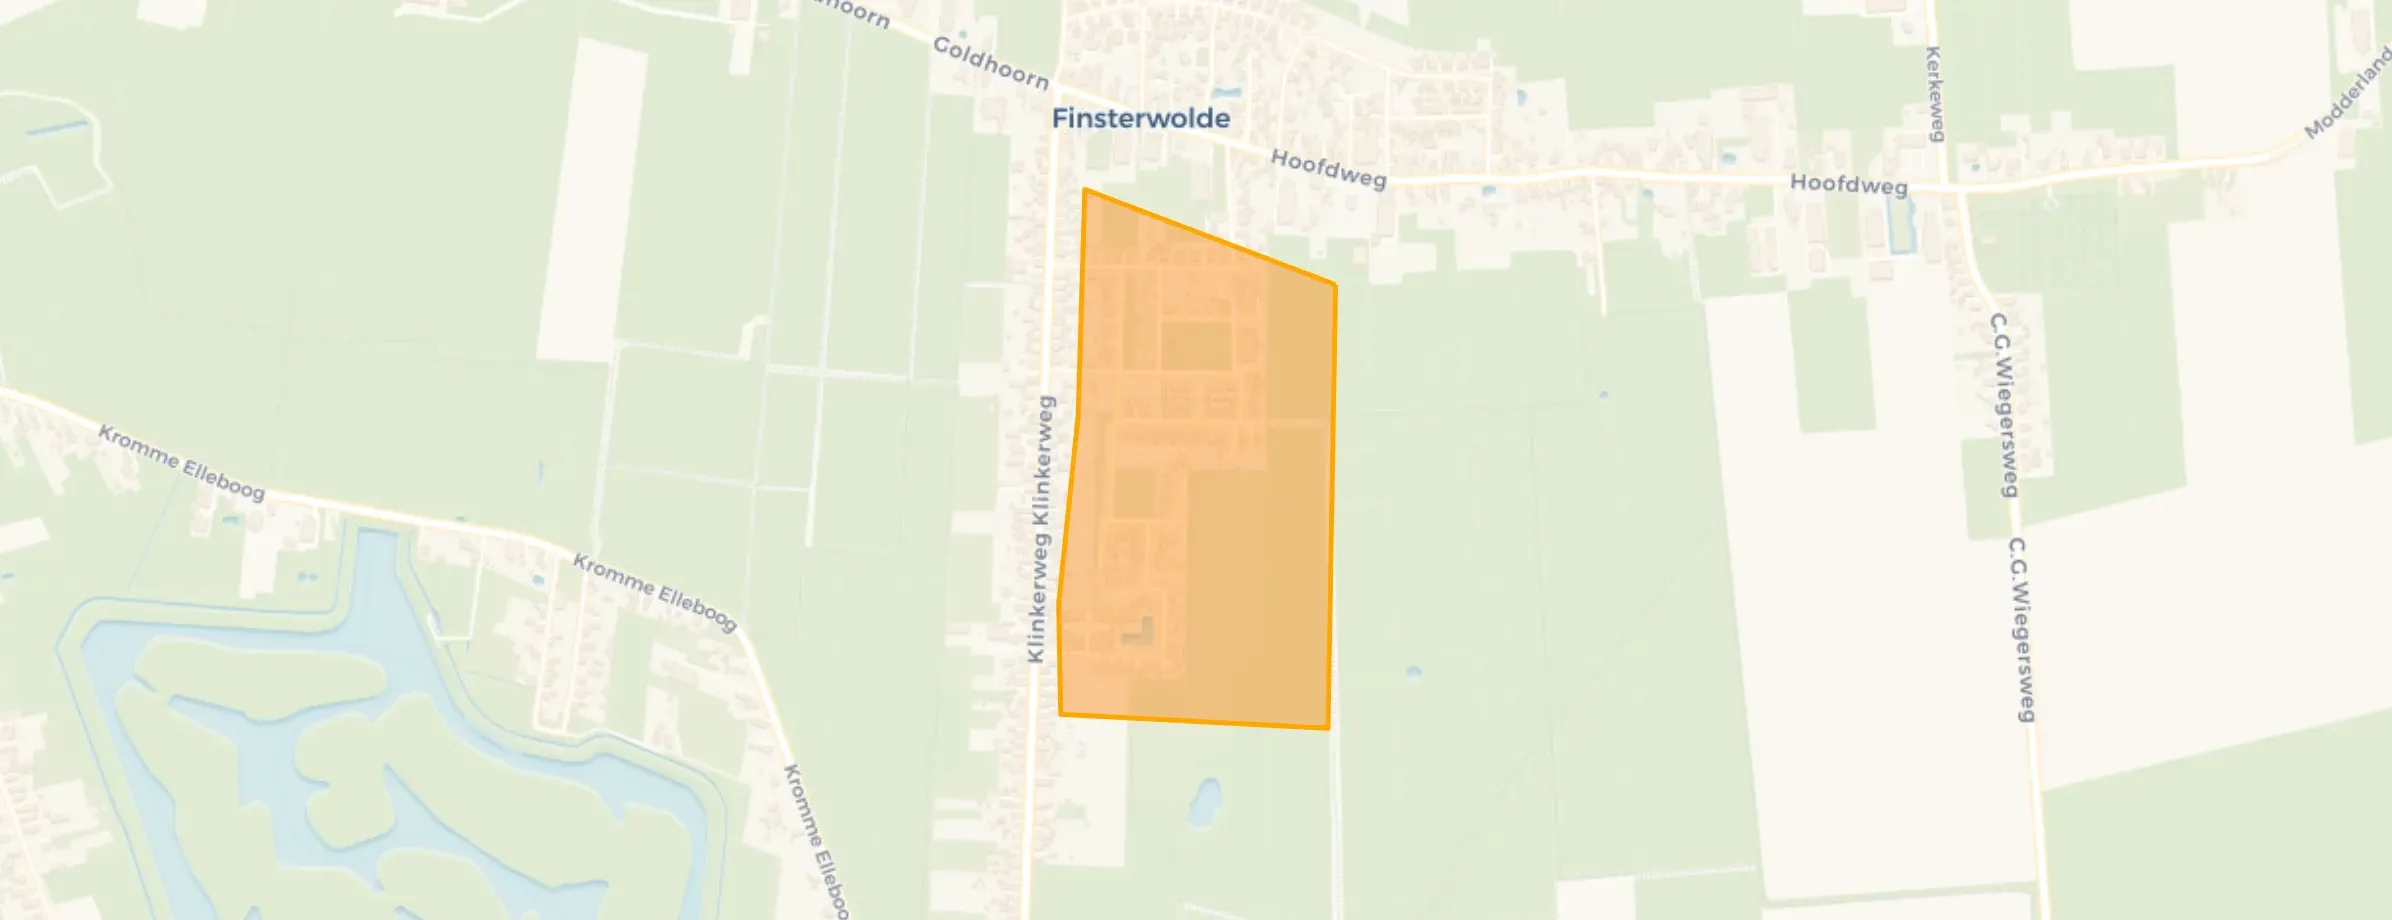
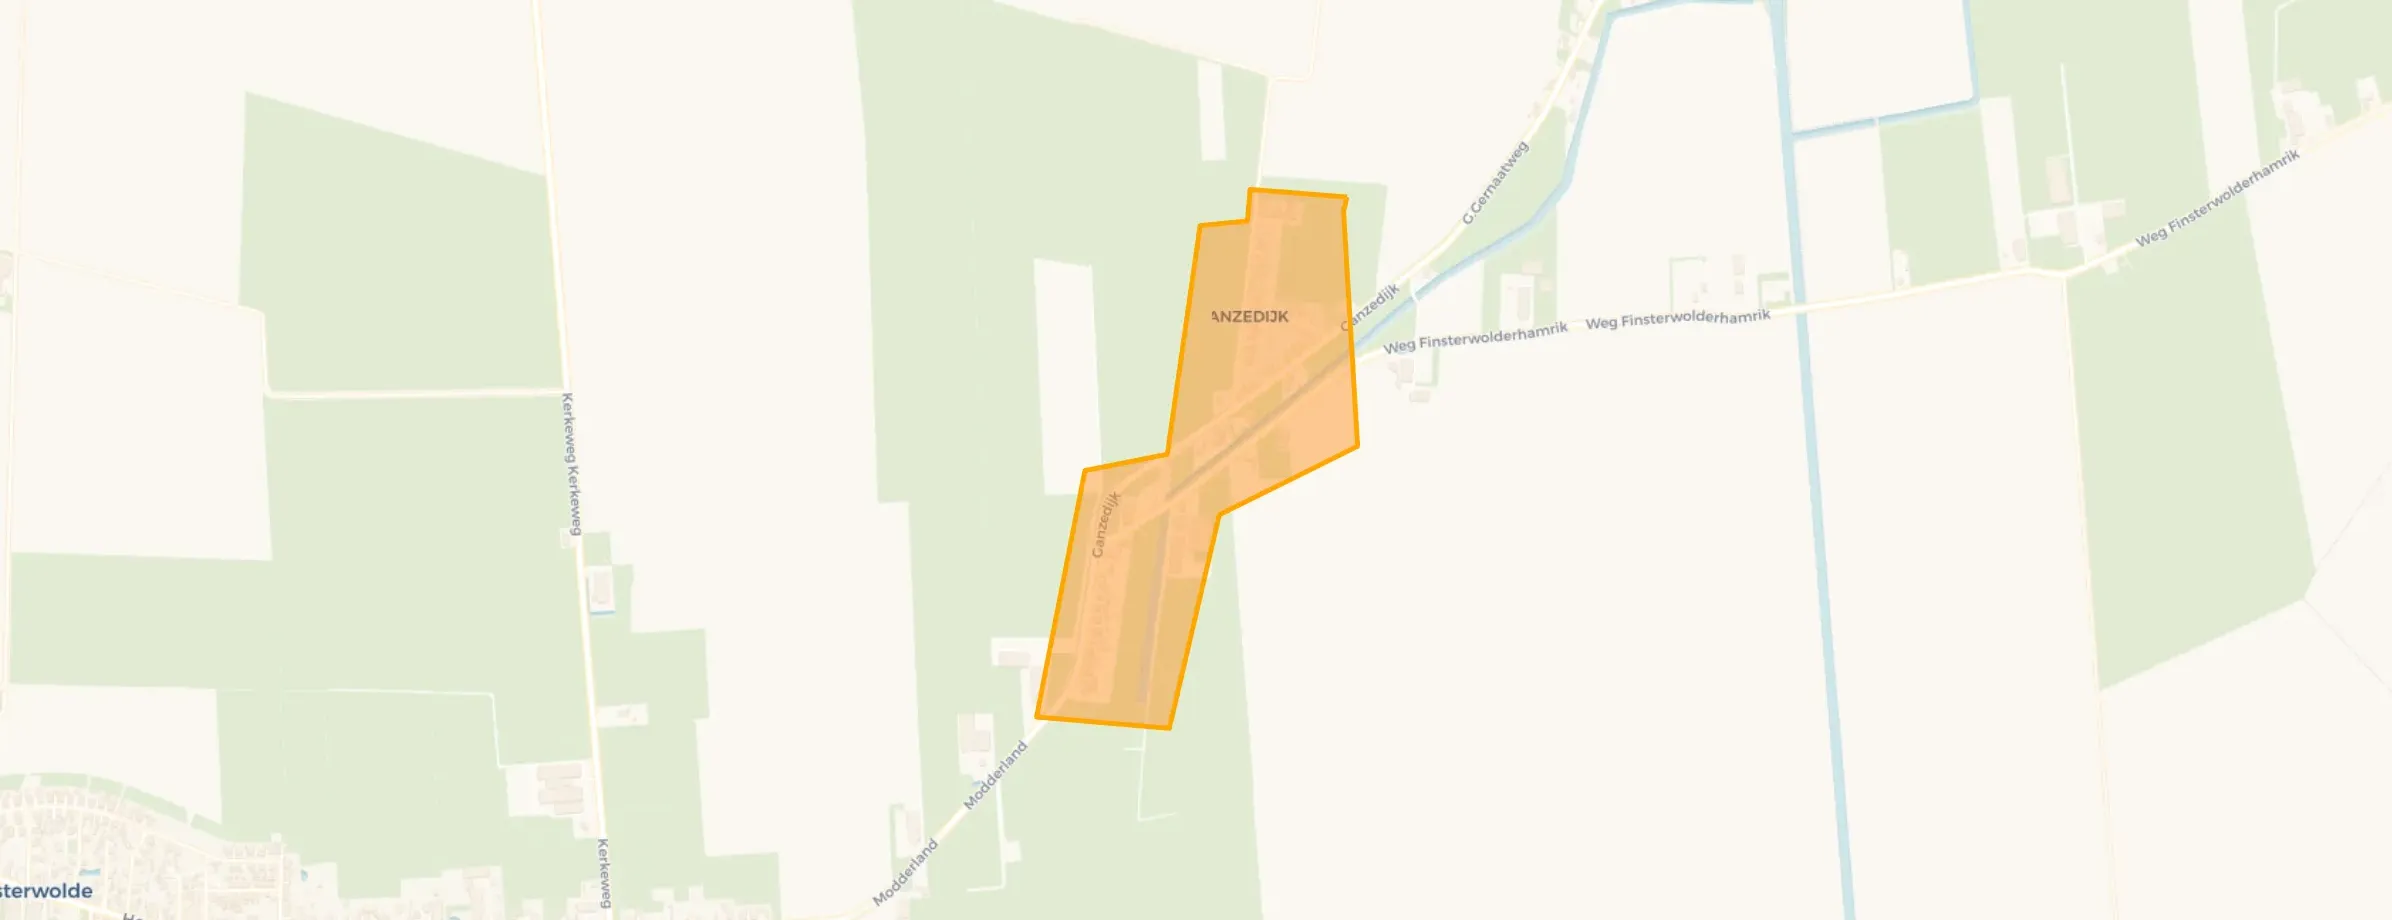
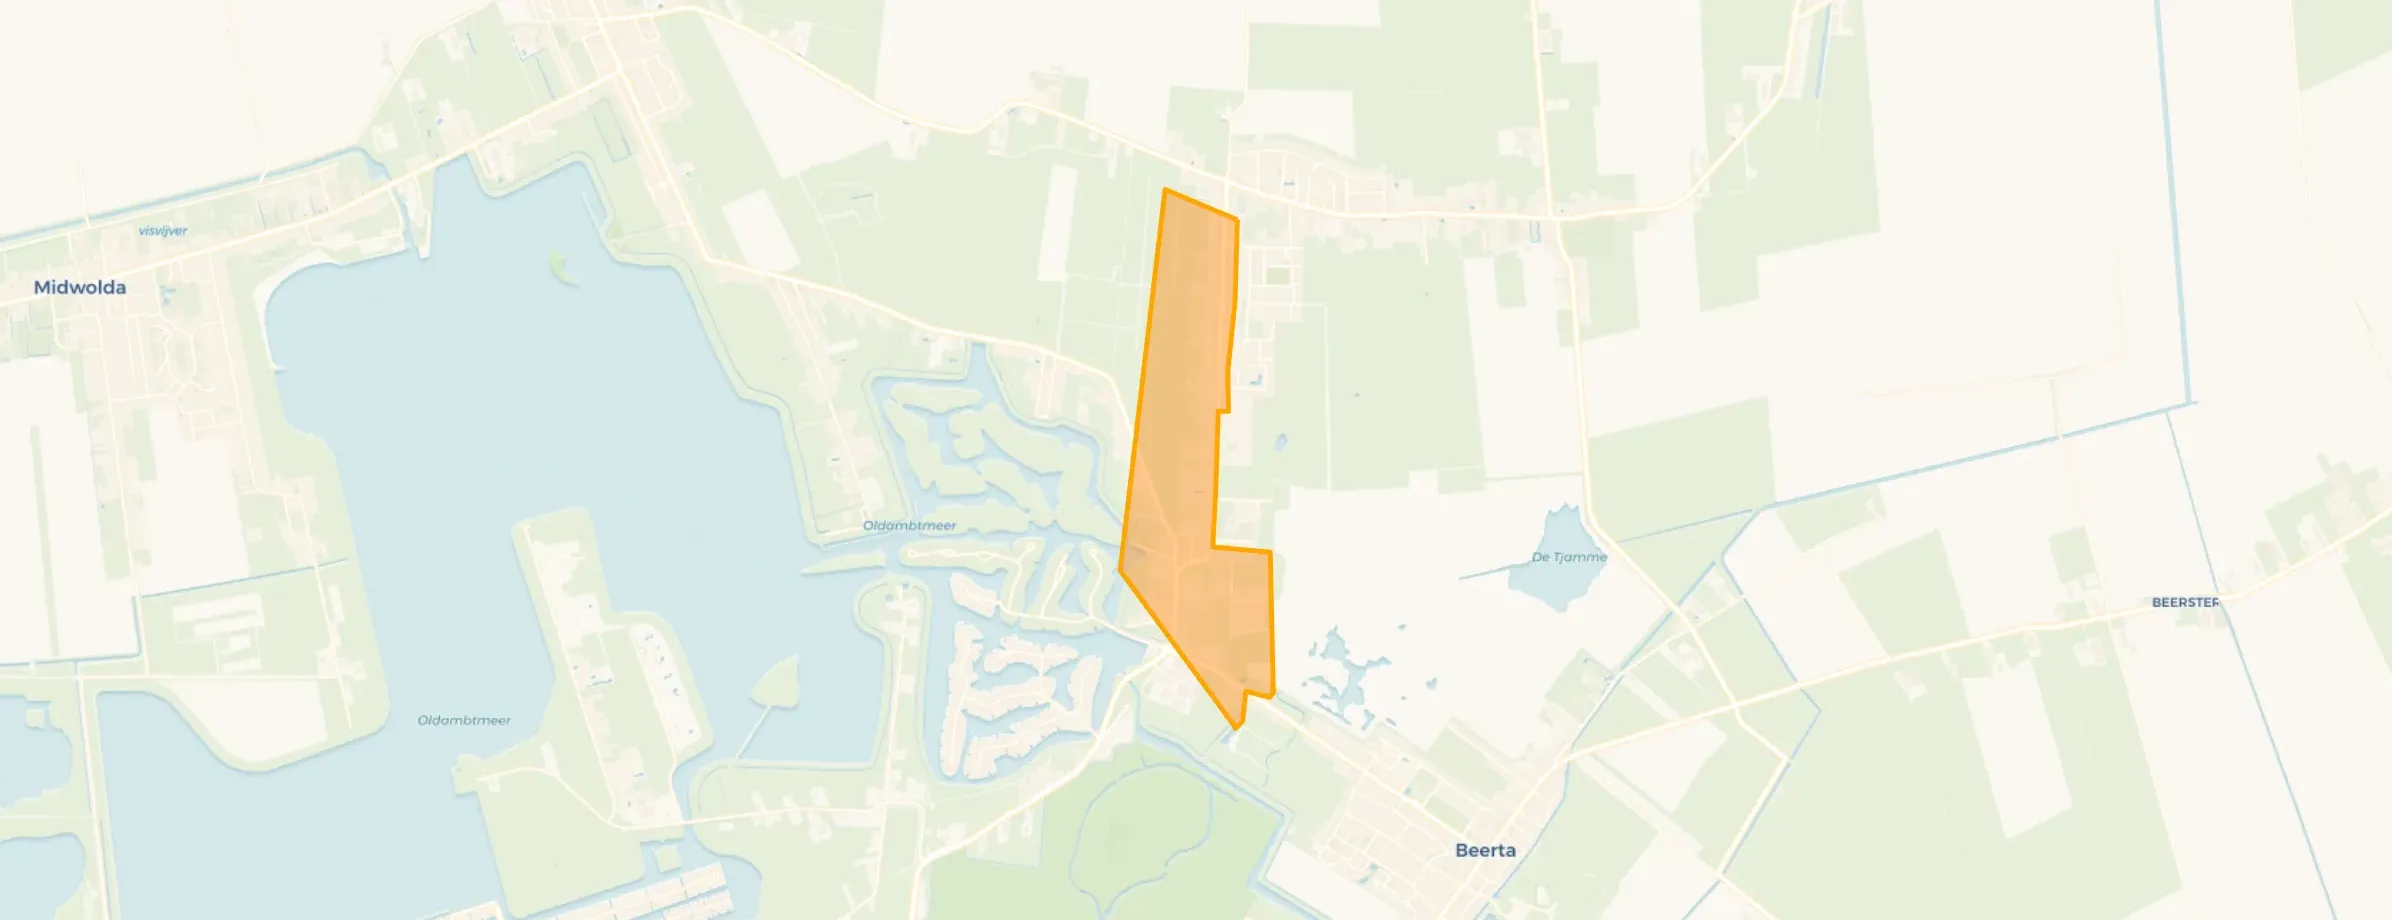
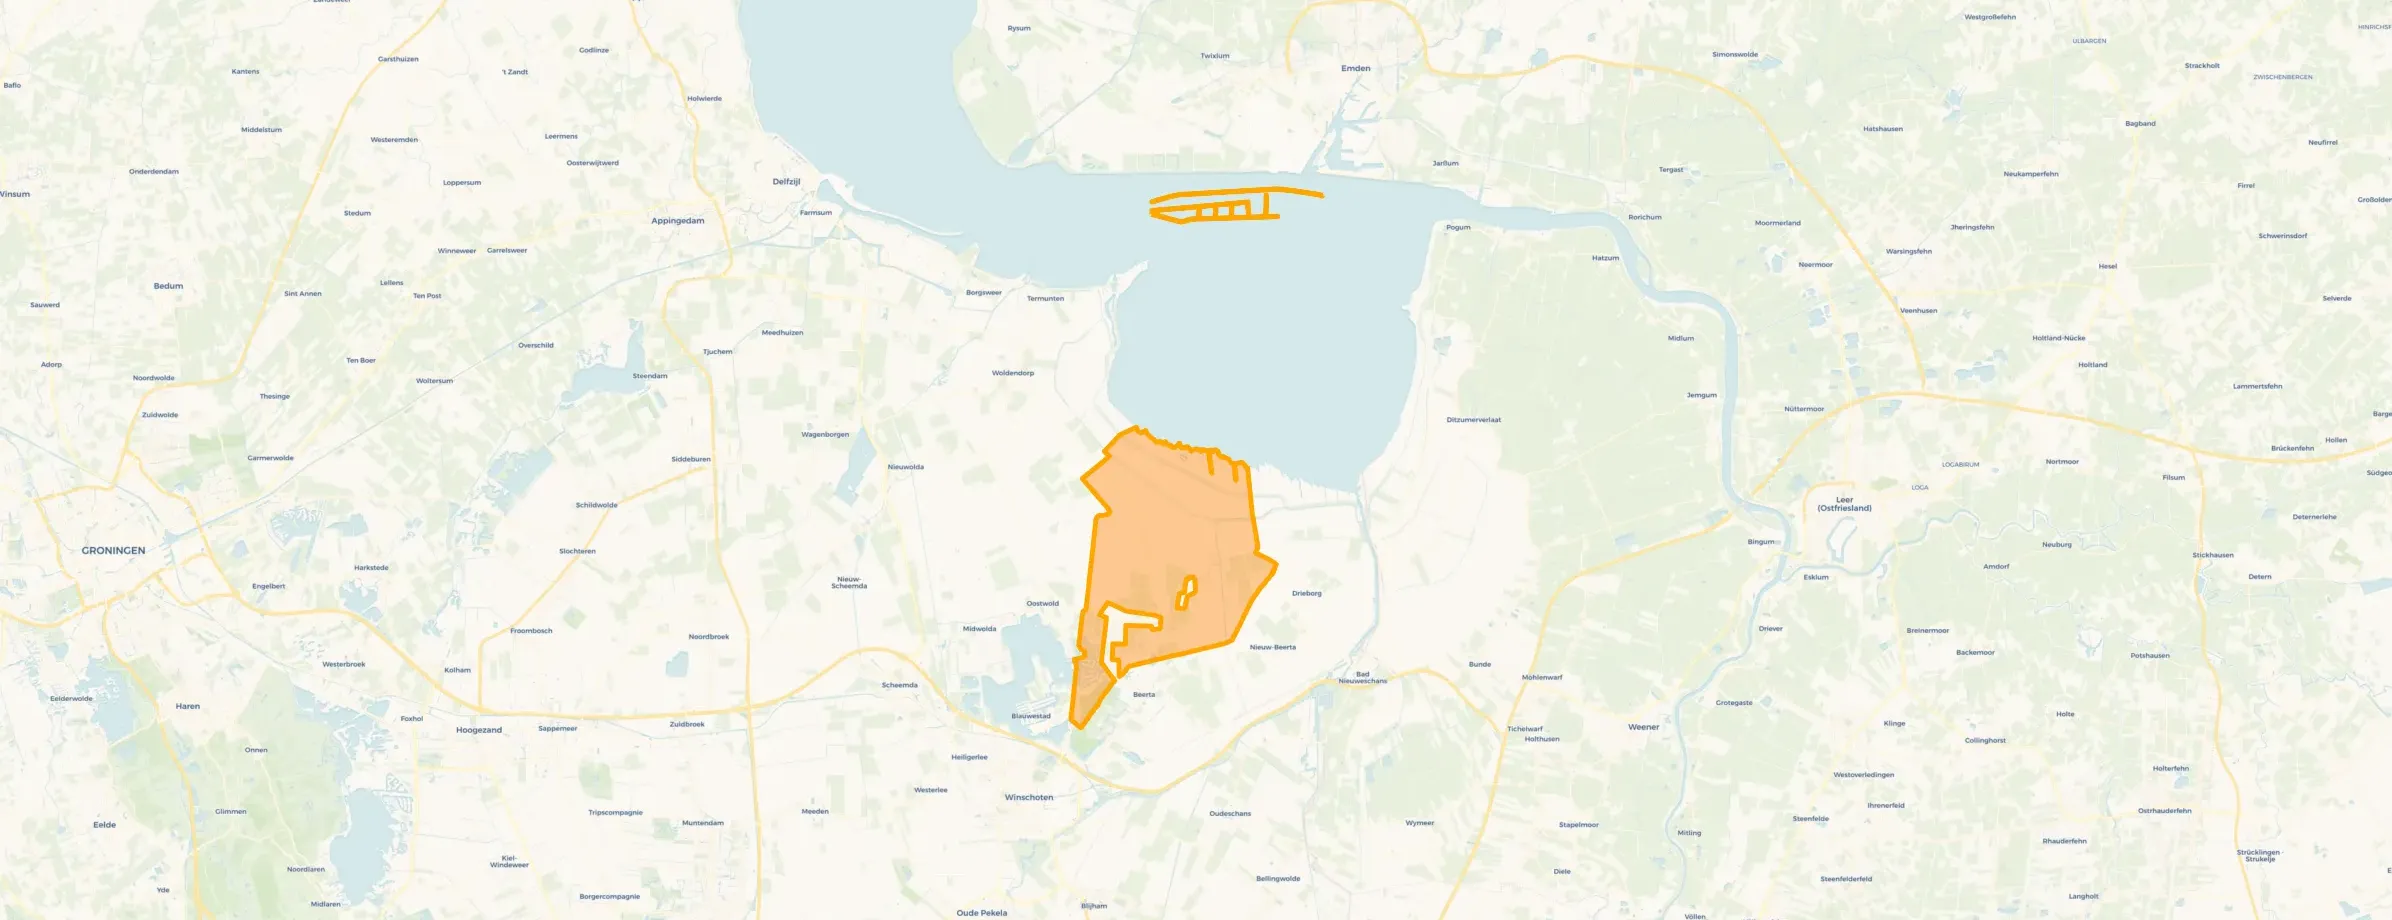
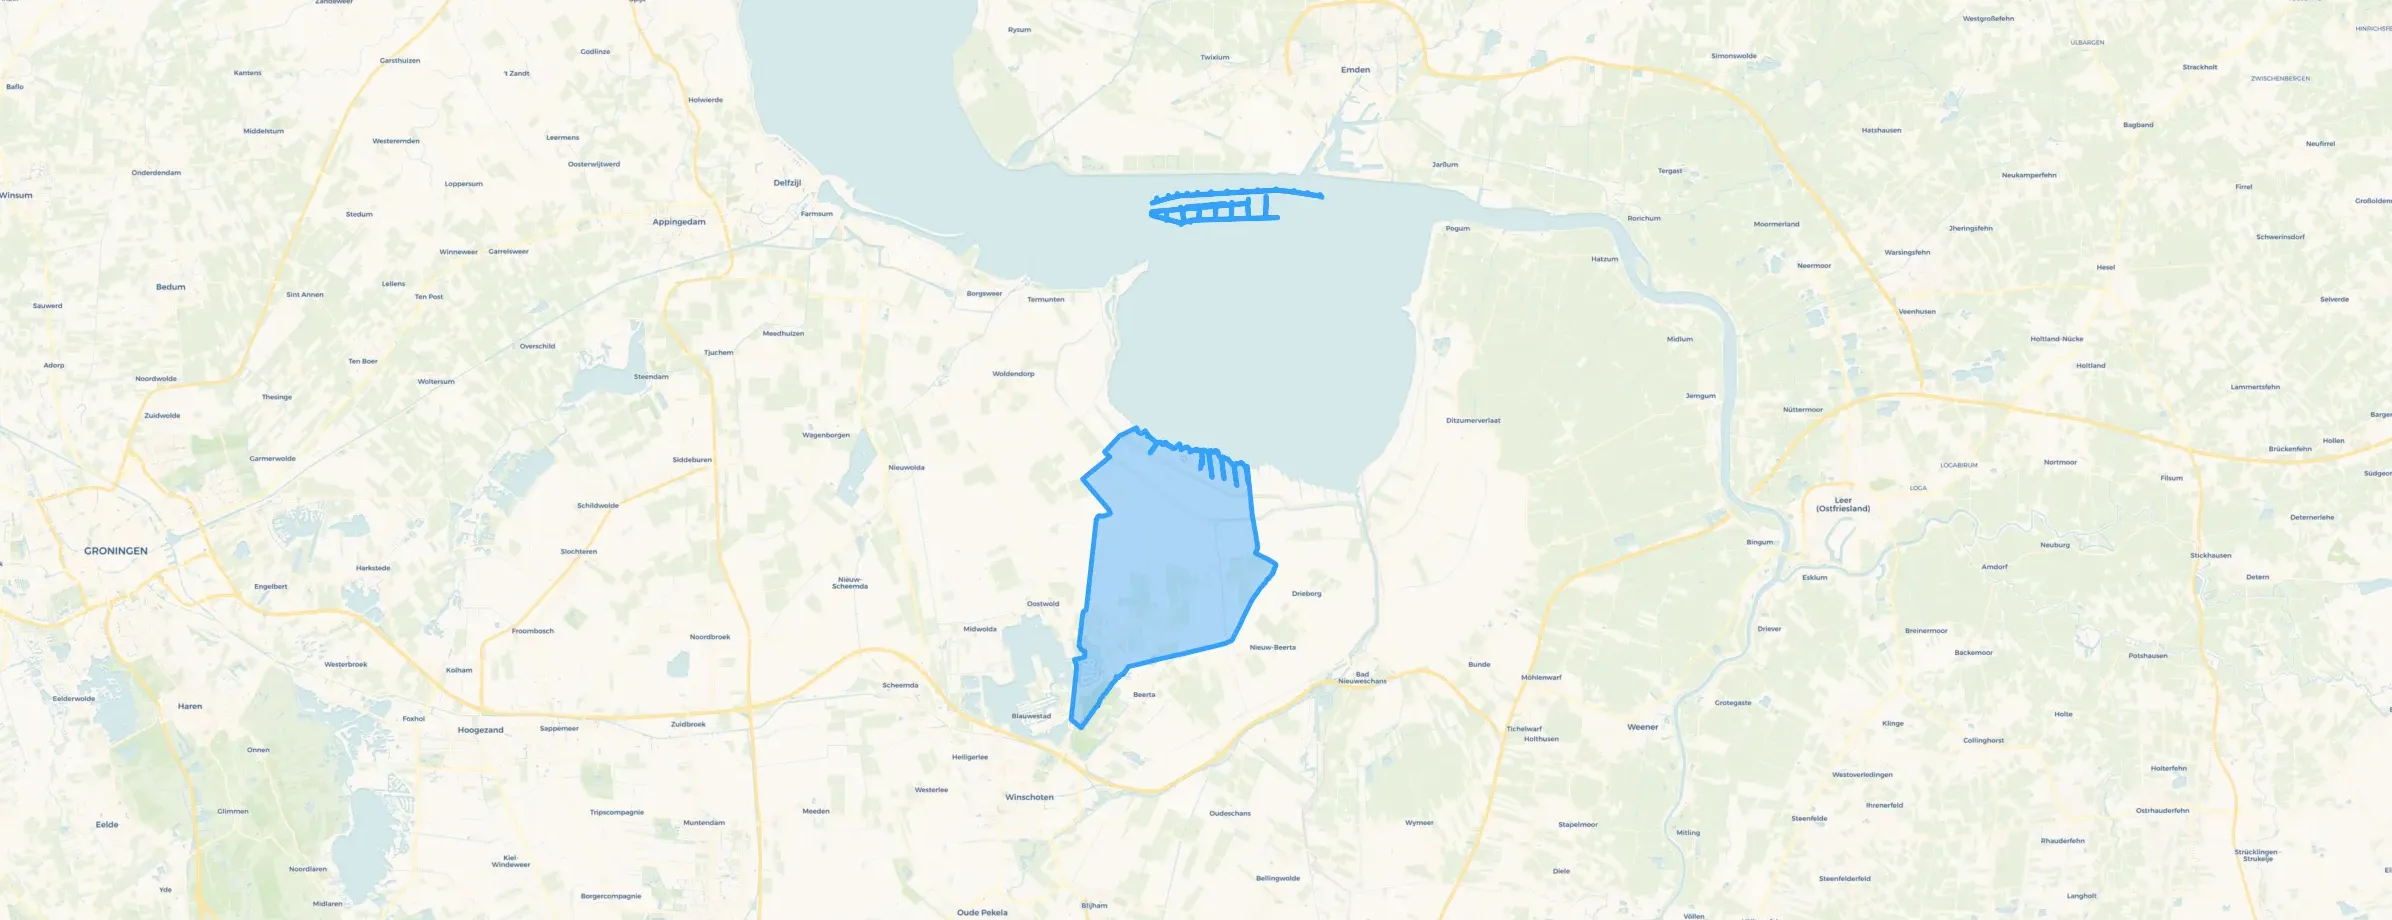
Finsterwolde is located in the province of Groningen, in the municipality of Oldambt The district has a total area of 4.210 hectares, of which 4.118 hectares are land and 92 hectares are water. The district is coded as WK189501. The postcode area is 9684AA-9685HJ.
Finsterwolde has 2.525 residents. Of these, 51,1% are men and 48,7% are women. Most residents are 45 to 65 years (34,1%). The other age groups are 24,4% for '65 years or older', 19,2% for '25 to 45 years', 12,5% for '0 to 15 years' and 9,7% for '15 to 25 years'. Of the residents, 40,2% is unmarried, 46,1% is married, 8,3% is divorced and 5,1% is widowed. 2.210 residents originate from the Netherlands, 190 come from Europe and 125 come from countries outside Europe.
There are 1.180 households in Finsterwolde. 32,2% of these are single-person households, 38,1% households without children and 29,7% households with children. The average household size is 2,1 persons.
In Finsterwolde there are 2.000 income recipients. The average income per income recipient is €30.900, which is €4.900 (14%) lower than the national average of €35.800. Per resident, the average income is €25.900, which is €3.300 (11%) lower than the national average of €29.200. Most residents of Finsterwolde are educated to an intermediate level. 43,2% have an intermediate education (HAVO, VWO or MBO 2-4), 38,4% have a lower education (VMBO or MBO 1) and 18,4% have a university or higher professional education (HBO/WO).
Of the 2.525 residents, around 56% are in paid employment, which amounts to 1.414 people. This is 9% lower than the national average of 65%. The majority of workers are in salaried employment (82%), while 18% are self-employed. In Finsterwolde, 32% of residents receive a benefit. The largest group is those receiving a state pension (AOW). 530 people receive this benefit.
In Finsterwolde there are 1.142 homes with an average assessed value (WOZ) of €282.000. Of these, around 96% are occupied and 4% unoccupied. Most homes are owner-occupied. This amounts to 24% rental homes and 76% owner-occupied homes. Of the homes, 76% privately owned, 19% owned by housing associations and 5% owned by other landlords. The most common construction periods in Finsterwolde are 1925-1950 (25%) and 1950-1970 (20%).
There are currently no homes for sale in Finsterwolde. The most recently listed home is Hoofdweg 60 by Bruins Verheek makelaars op Pararius. No homes were sold in Finsterwolde over the past year.
There are currently no homes for rent in Finsterwolde. No homes were let in Finsterwolde over the past year.
No recent rental data available for Finsterwolde.
In Finsterwolde there are 1.175 addresses with a registered energy label. The most common labels are G (31%), A (16%) and C (15%). On average, an address in Finsterwolde uses 3.090 kWh of electricity per year. This is 10% above the national average of 2.810 kWh. Natural gas consumption, at 1.460 m³ per year, is 14% above the national average of 1.280 m³.
A few bad apples are spoiling the atmosphere in the street. People don't want to take others into account. Vandalism of other people's property. Bullying and humiliation. Excessive behaviour.
Auto-translated to English by AISocially worthless with an occasional exception here and there. And I specifically mean drug violence, vandalism, and the enjoyment of living. Grim atmosphere due to individual crime that apparently nothing can be done about. And a housing association that is too lax. Insufficient for lifetime-proof homes. Often too expensive, resulting in no flow-through. Poor maintenance. Speed restrictions in a residential area with playing children are worthless. Everything is ignored here, see complaints mentioned above. Stairlifts for people with very limited mobility are out of the question. Some have been waiting for years and simply cannot move. So health problems for this group. Damp and drafts, and sewage are the main issues. Many status holders in the village and these people are left like the rest with little help and support. Just slogging and struggling. Well, I see a whole list already.
Auto-translated to English by AINice neighbourhood but many facilities have disappeared in the last few years due to budget cuts.
Auto-translated to English by AIQuiet neighbourhood, nice neighbours
Auto-translated to English by AIUnfortunately, many facilities have disappeared in recent years due to the municipality's cutbacks. Apart from that, a nice atmosphere and never really any nuisance.
Auto-translated to English by AINice neighbours, pleasant to live
Auto-translated to English by AINice neighbourhood, could always be better but that's the case everywhere.
Auto-translated to English by AIRelaxed atmosphere, togetherness
Auto-translated to English by AI
The most common type is detached houses (63%).
Over the past year a home for sale in Finsterwolde was listed for an average of €355,163 (€2,582 per m²).
A rental home in Finsterwolde cost an average of €1,156 per month (€15 per m²).
Residents give Finsterwolde a 6.3 out of 10 based on 8 reviews. The strongest score is for accessibility (5.8), the weakest for amenities (4.5).
Wijk Finsterwolde has 2,525 residents. The largest age group is 45 to 65 years (34%).
A considerable share of the supply in Finsterwolde is less efficient: 28% has an E, F or G label. The average natural gas consumption per household is 1,460 m³ per year.
From Finsterwolde you can on average reach a supermarket at 1.6 km, a GP at 2.0 km, a railway station at 7.9 km, a primary school at 1.8 km (as the crow flies, source: CBS).
Right now you will find 17 homes for sale in Finsterwolde.

Buurtje.nl uses cookies to make the site work and to improve it. In doing so, we process data such as your IP address and the pages you visit.
We use this data for three purposes: running the website (functional), measuring visits so we can improve Buurtje.nl (analytics), and — if you allow it — tailoring ads to your interests (marketing).
How we handle your data is described in our privacy policy. You can change your preferences at any time via 'Cookie preferences' at the bottom of every page.
Choose per category which cookies we may place. Read more in our privacy policy.