District in Tilburg
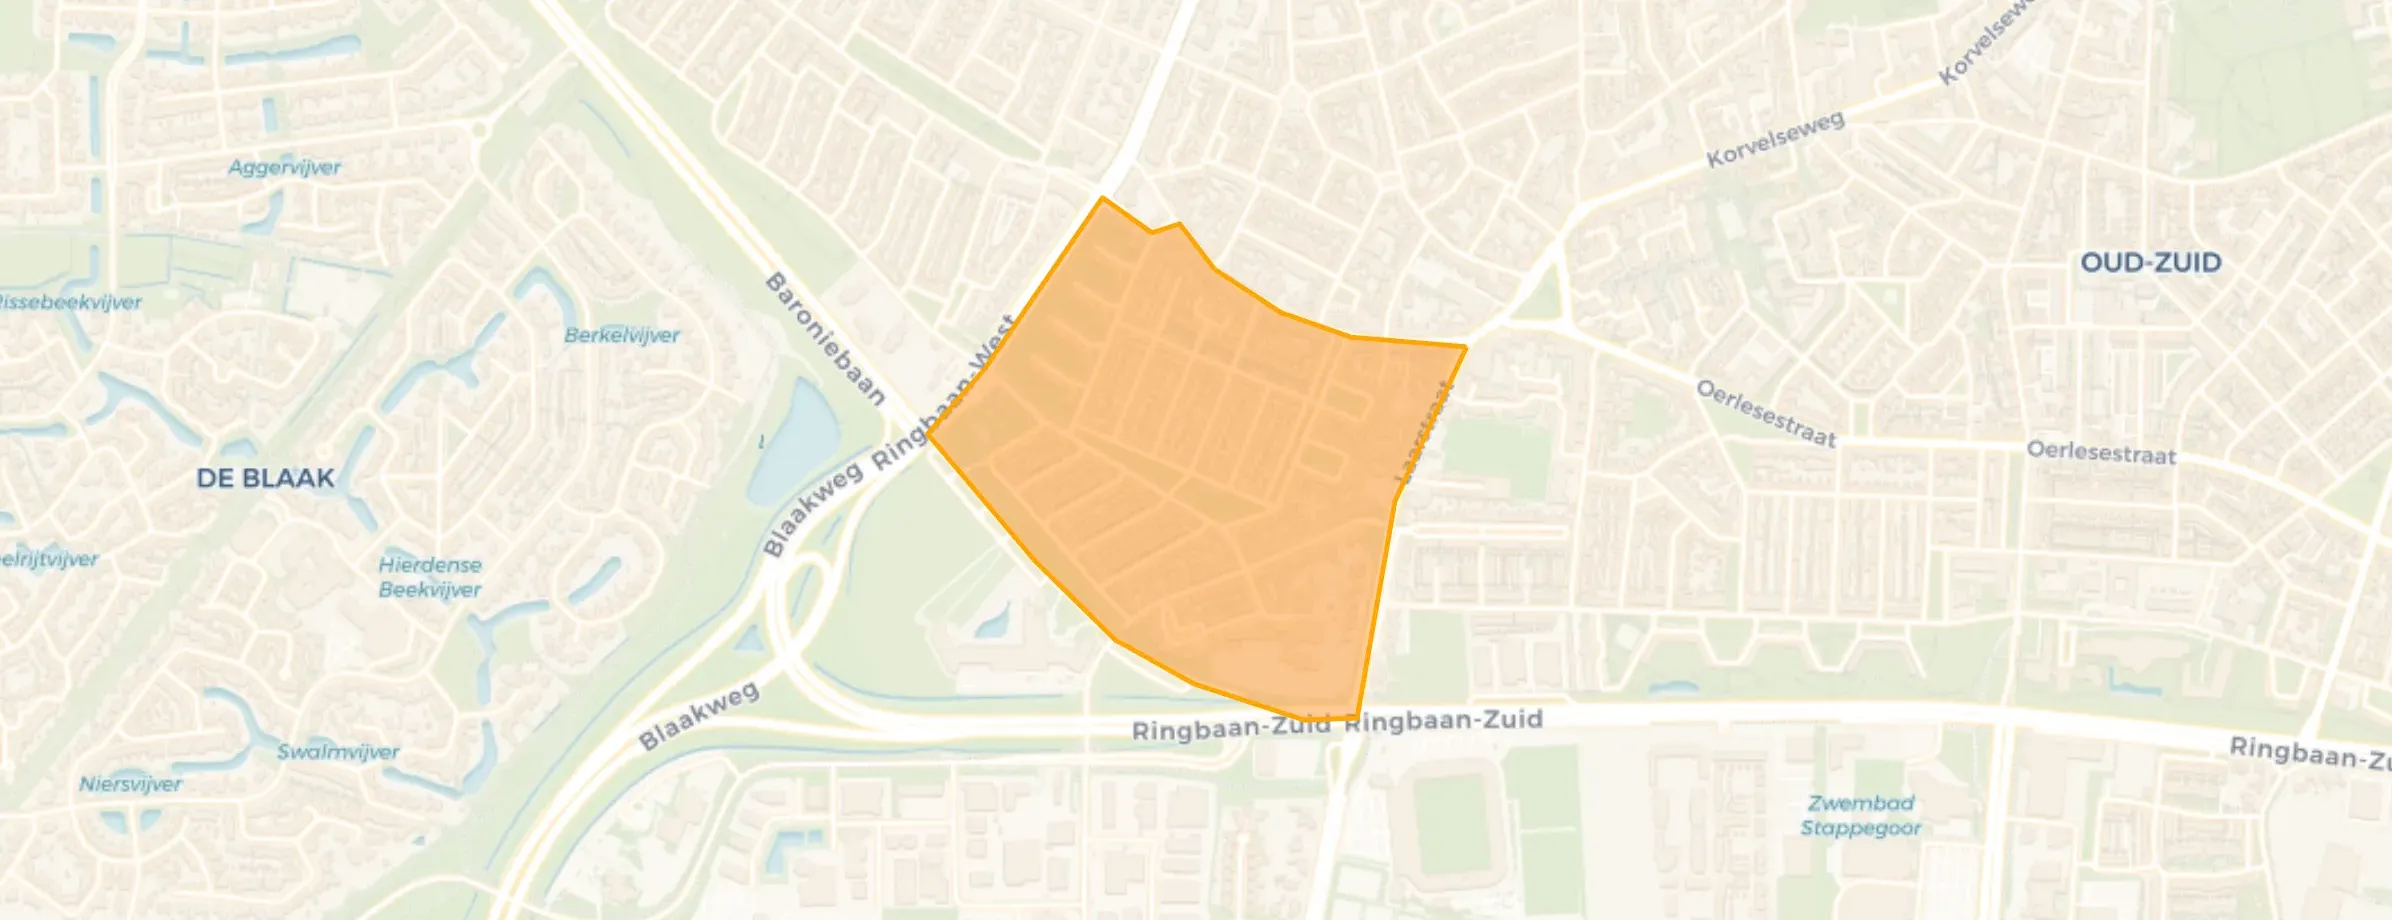
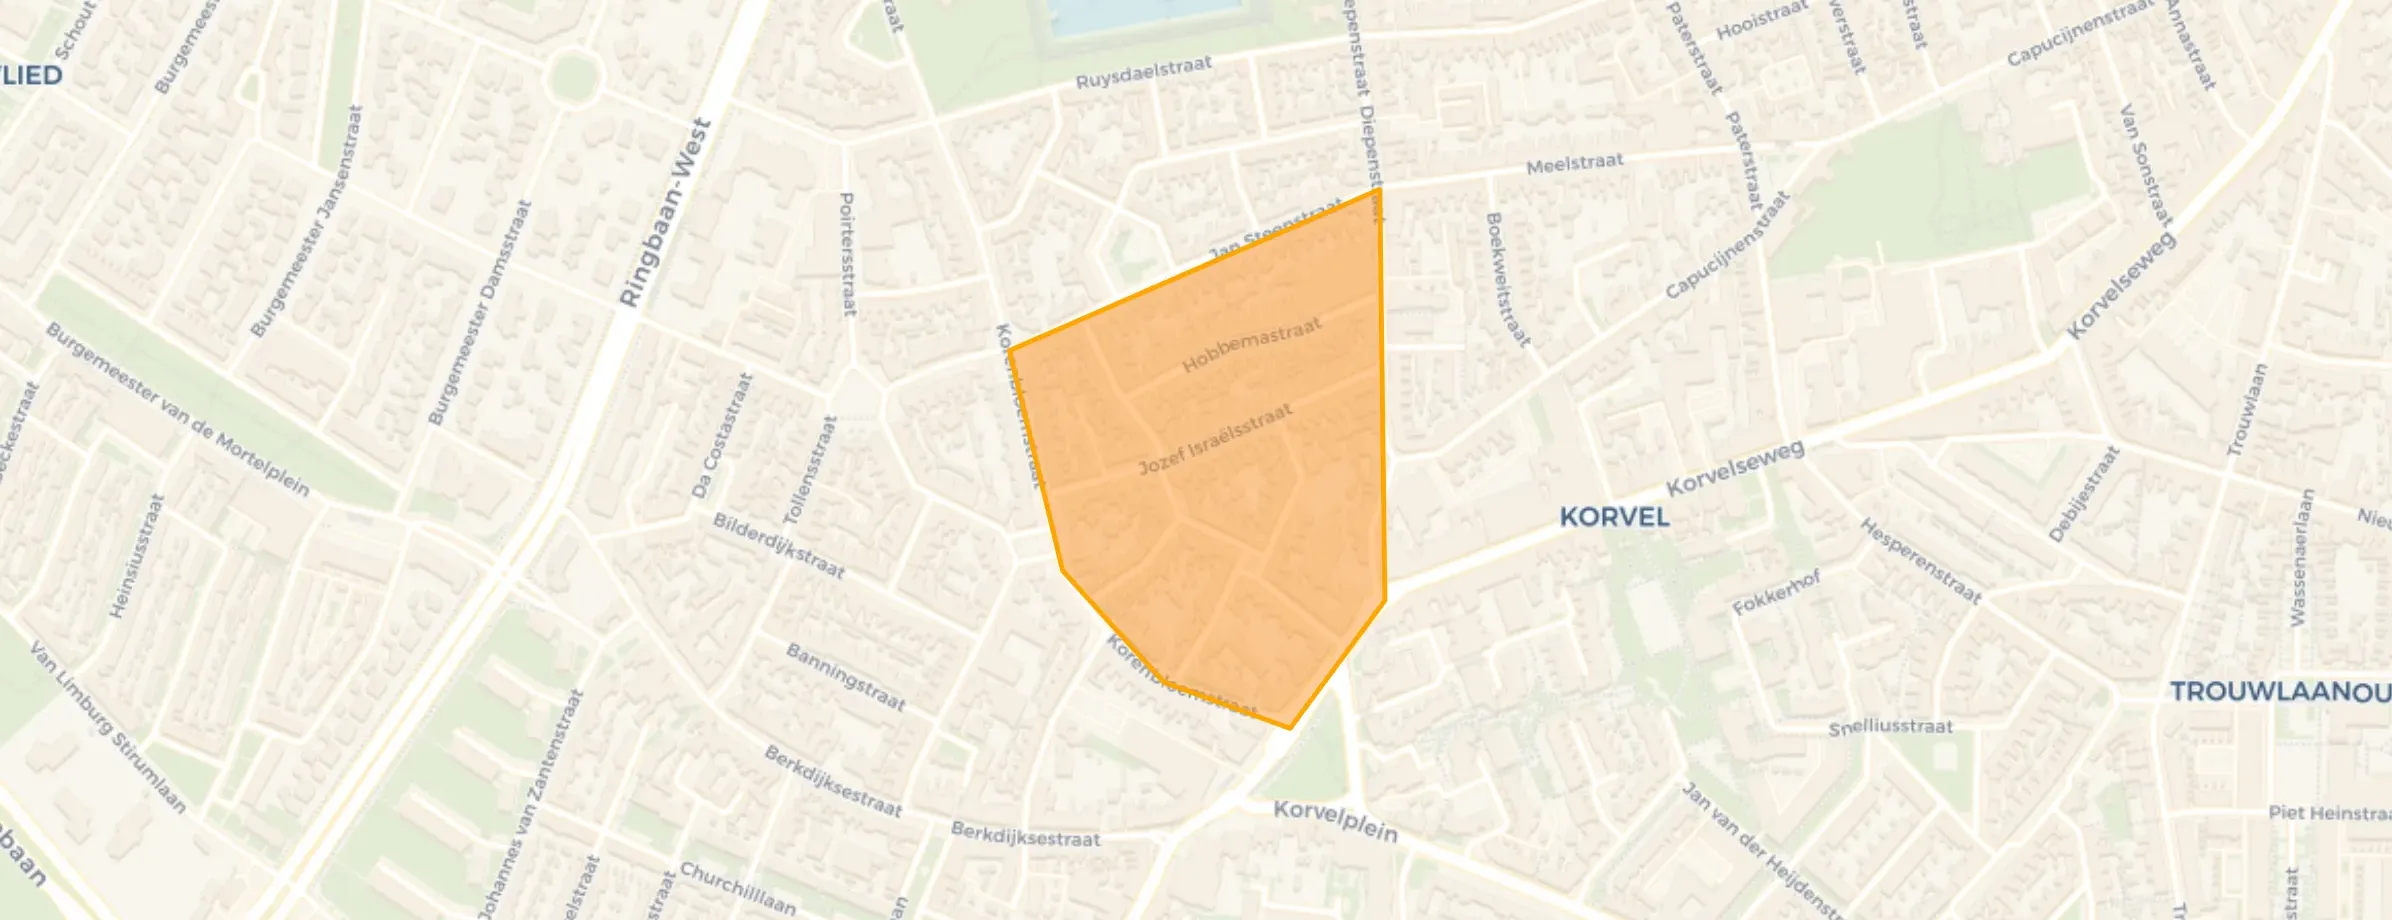
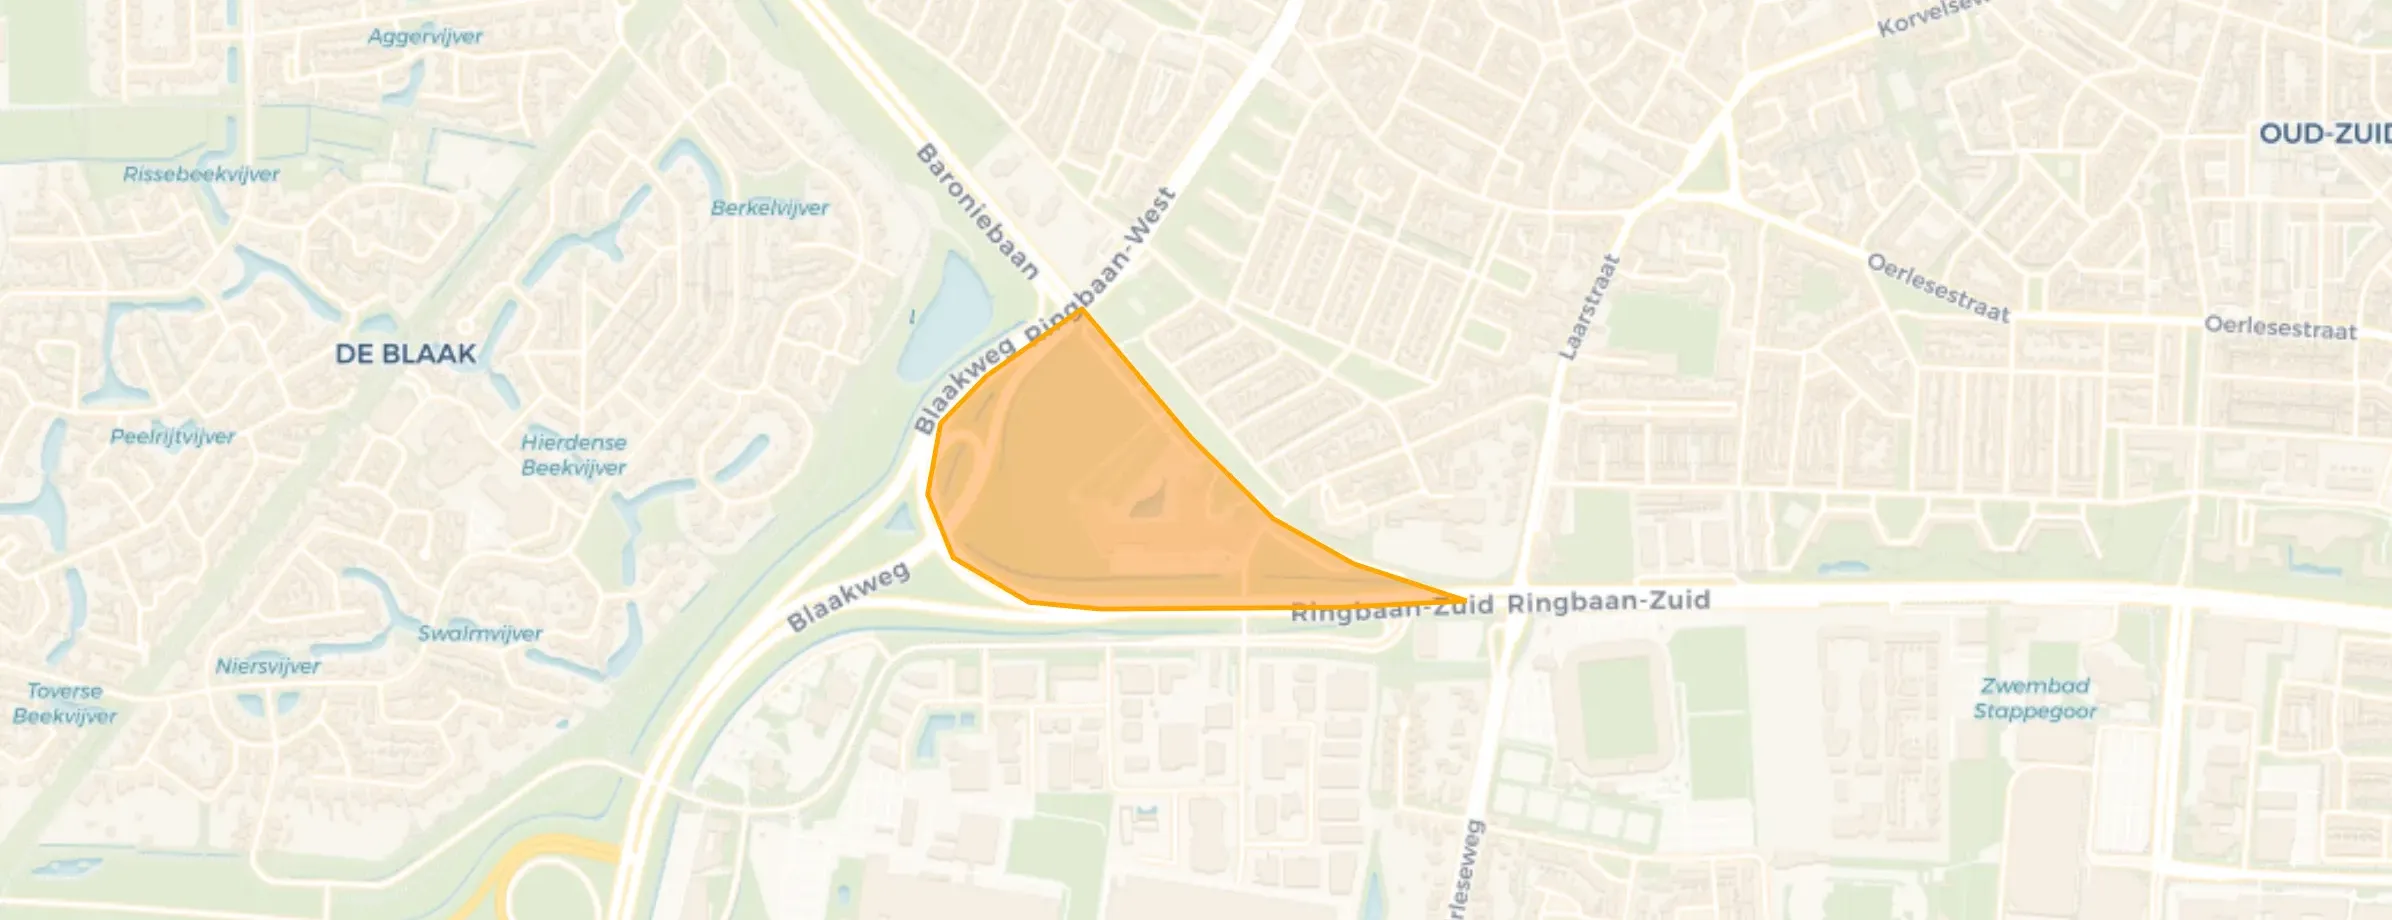
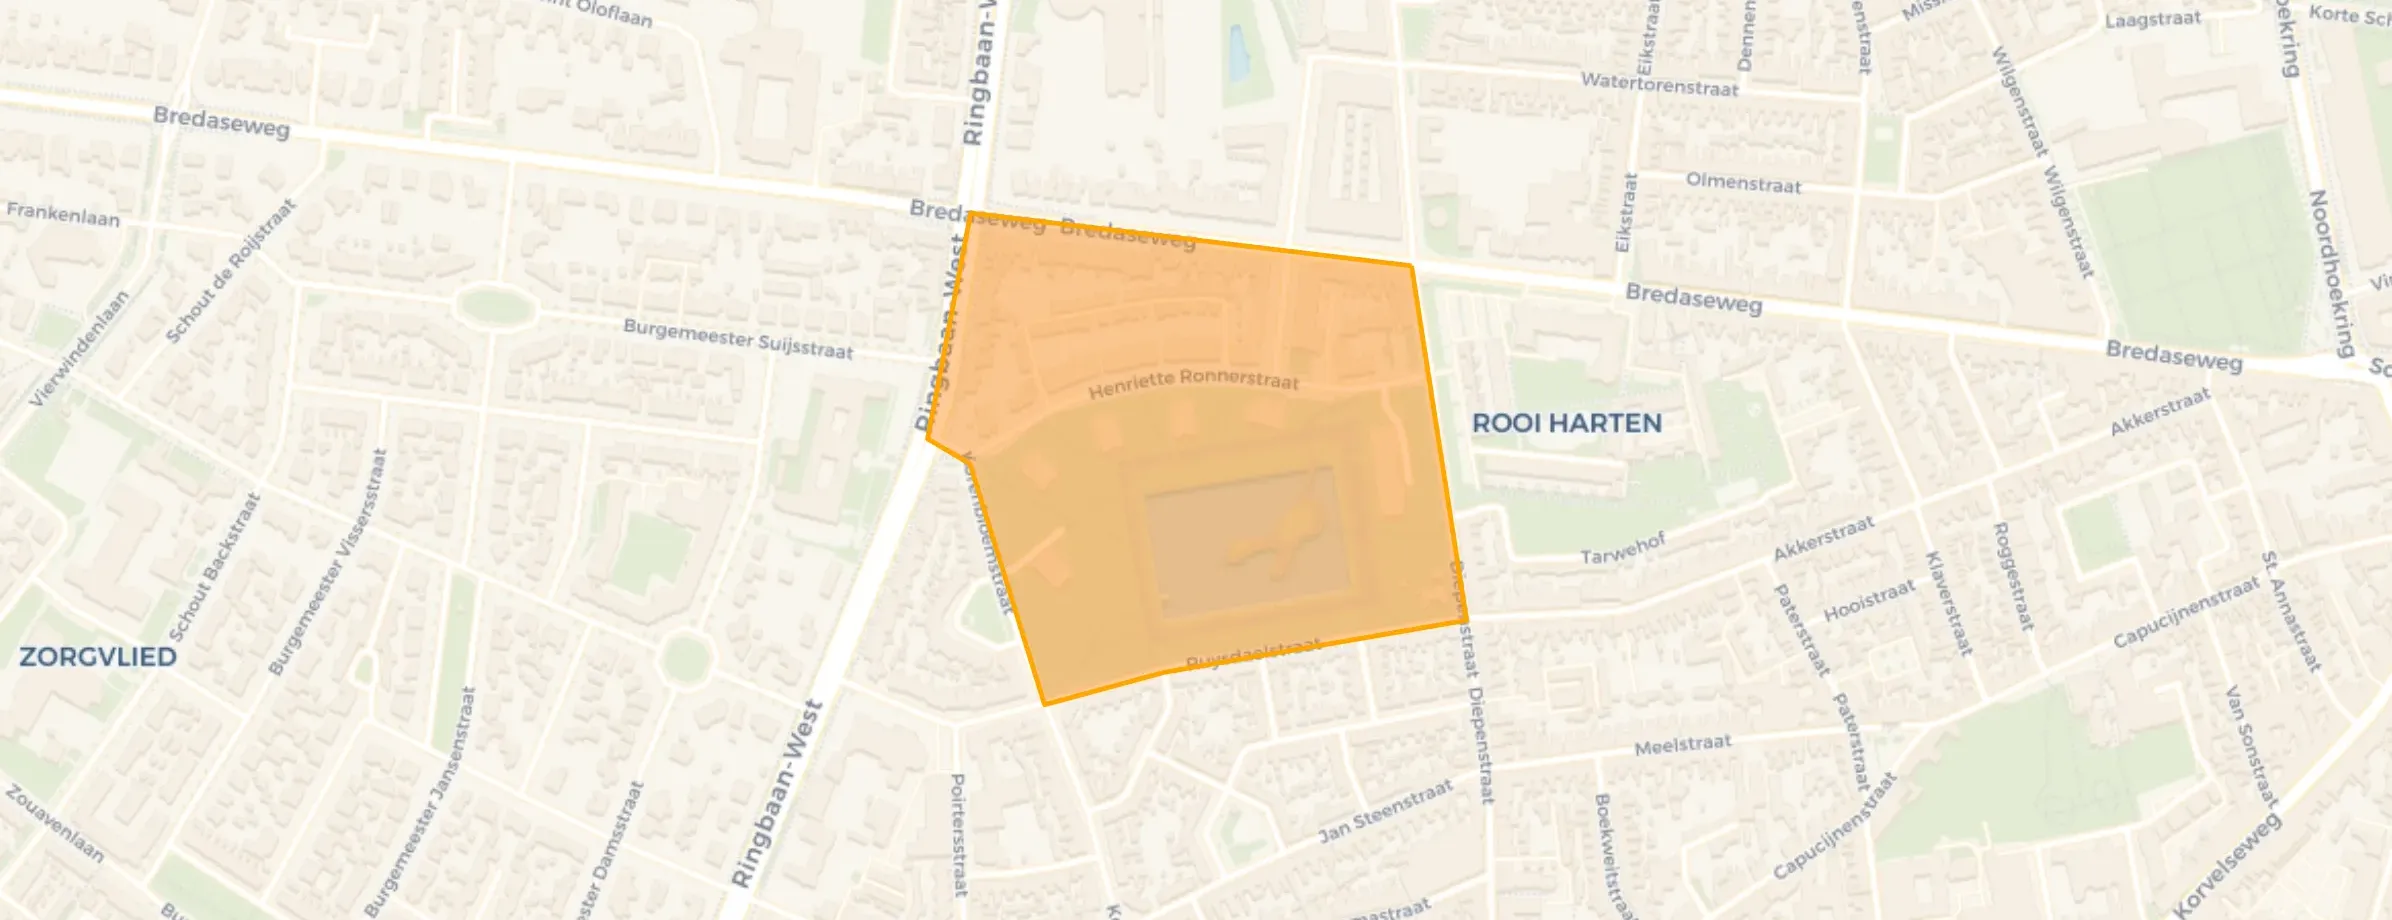
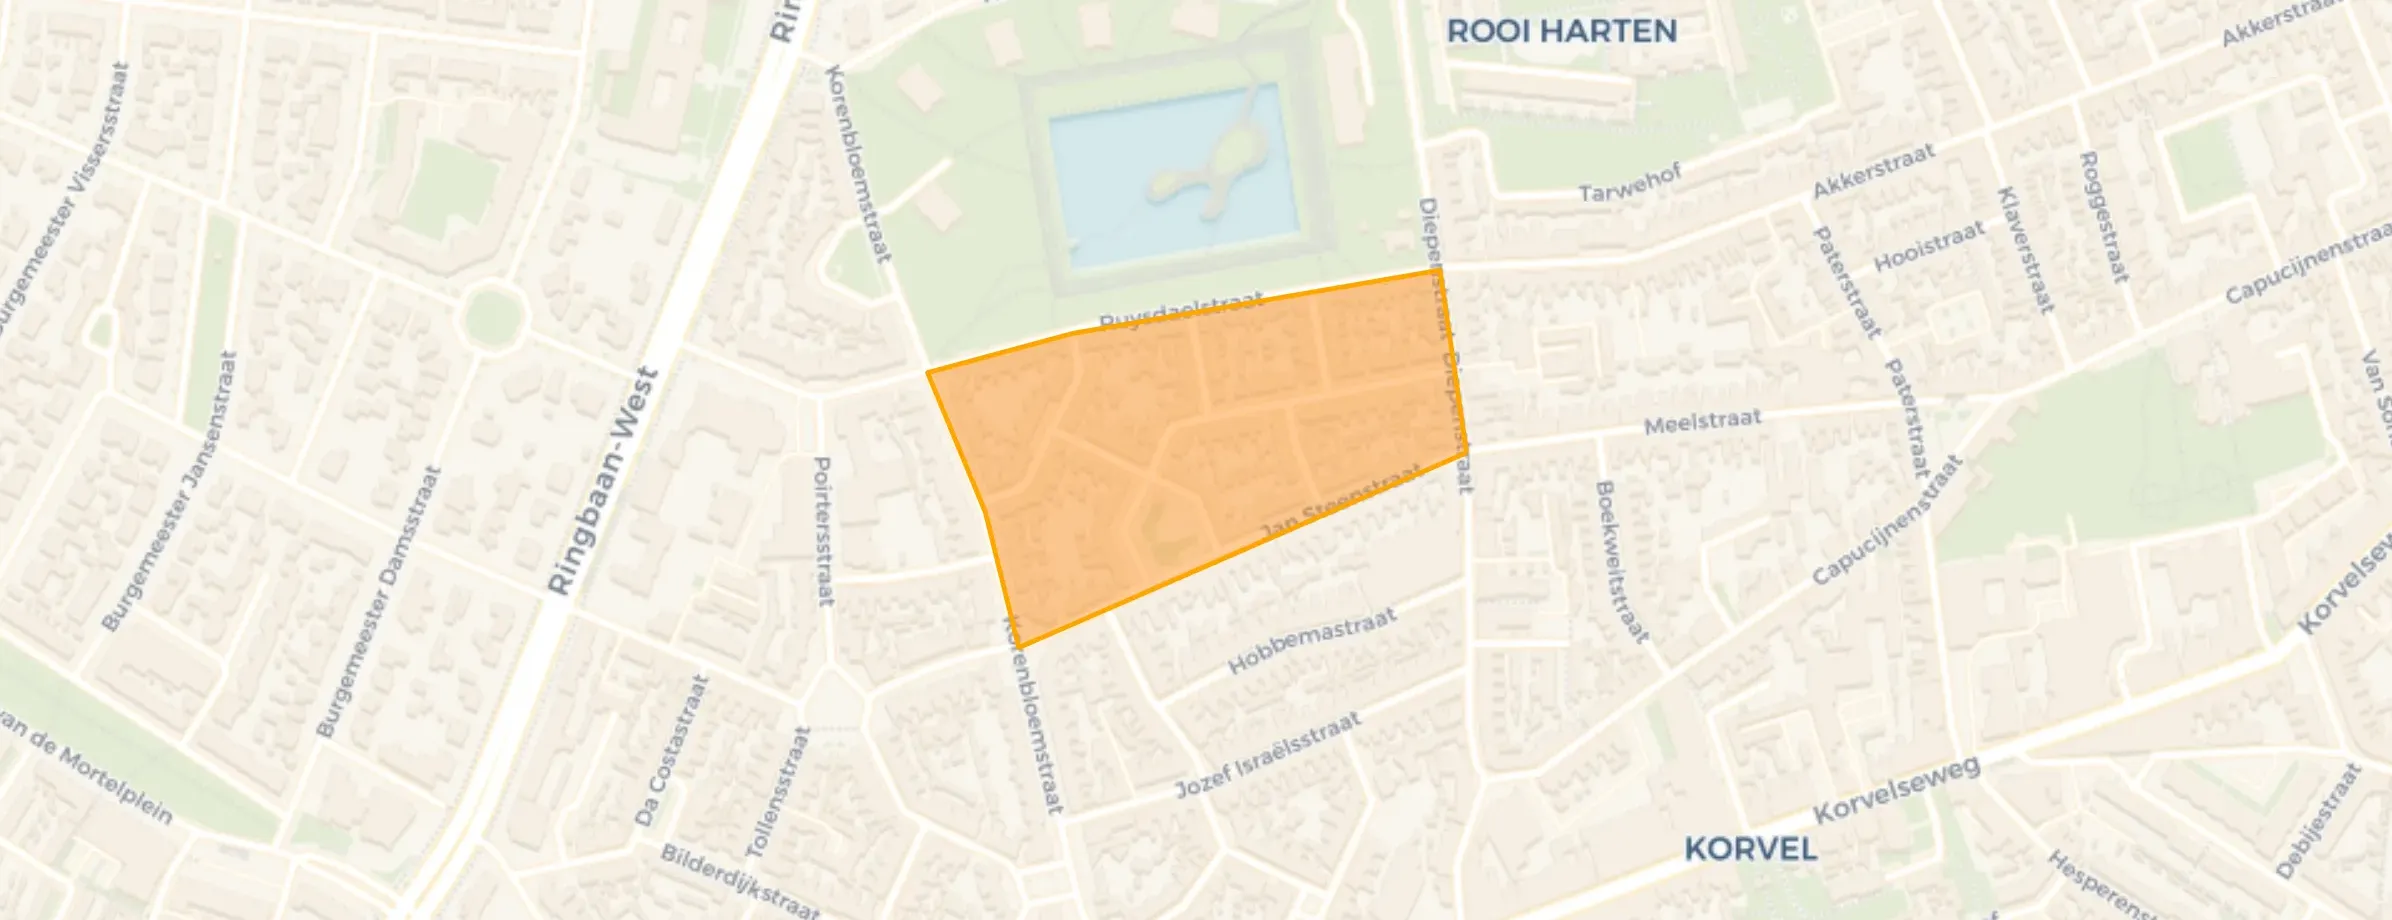
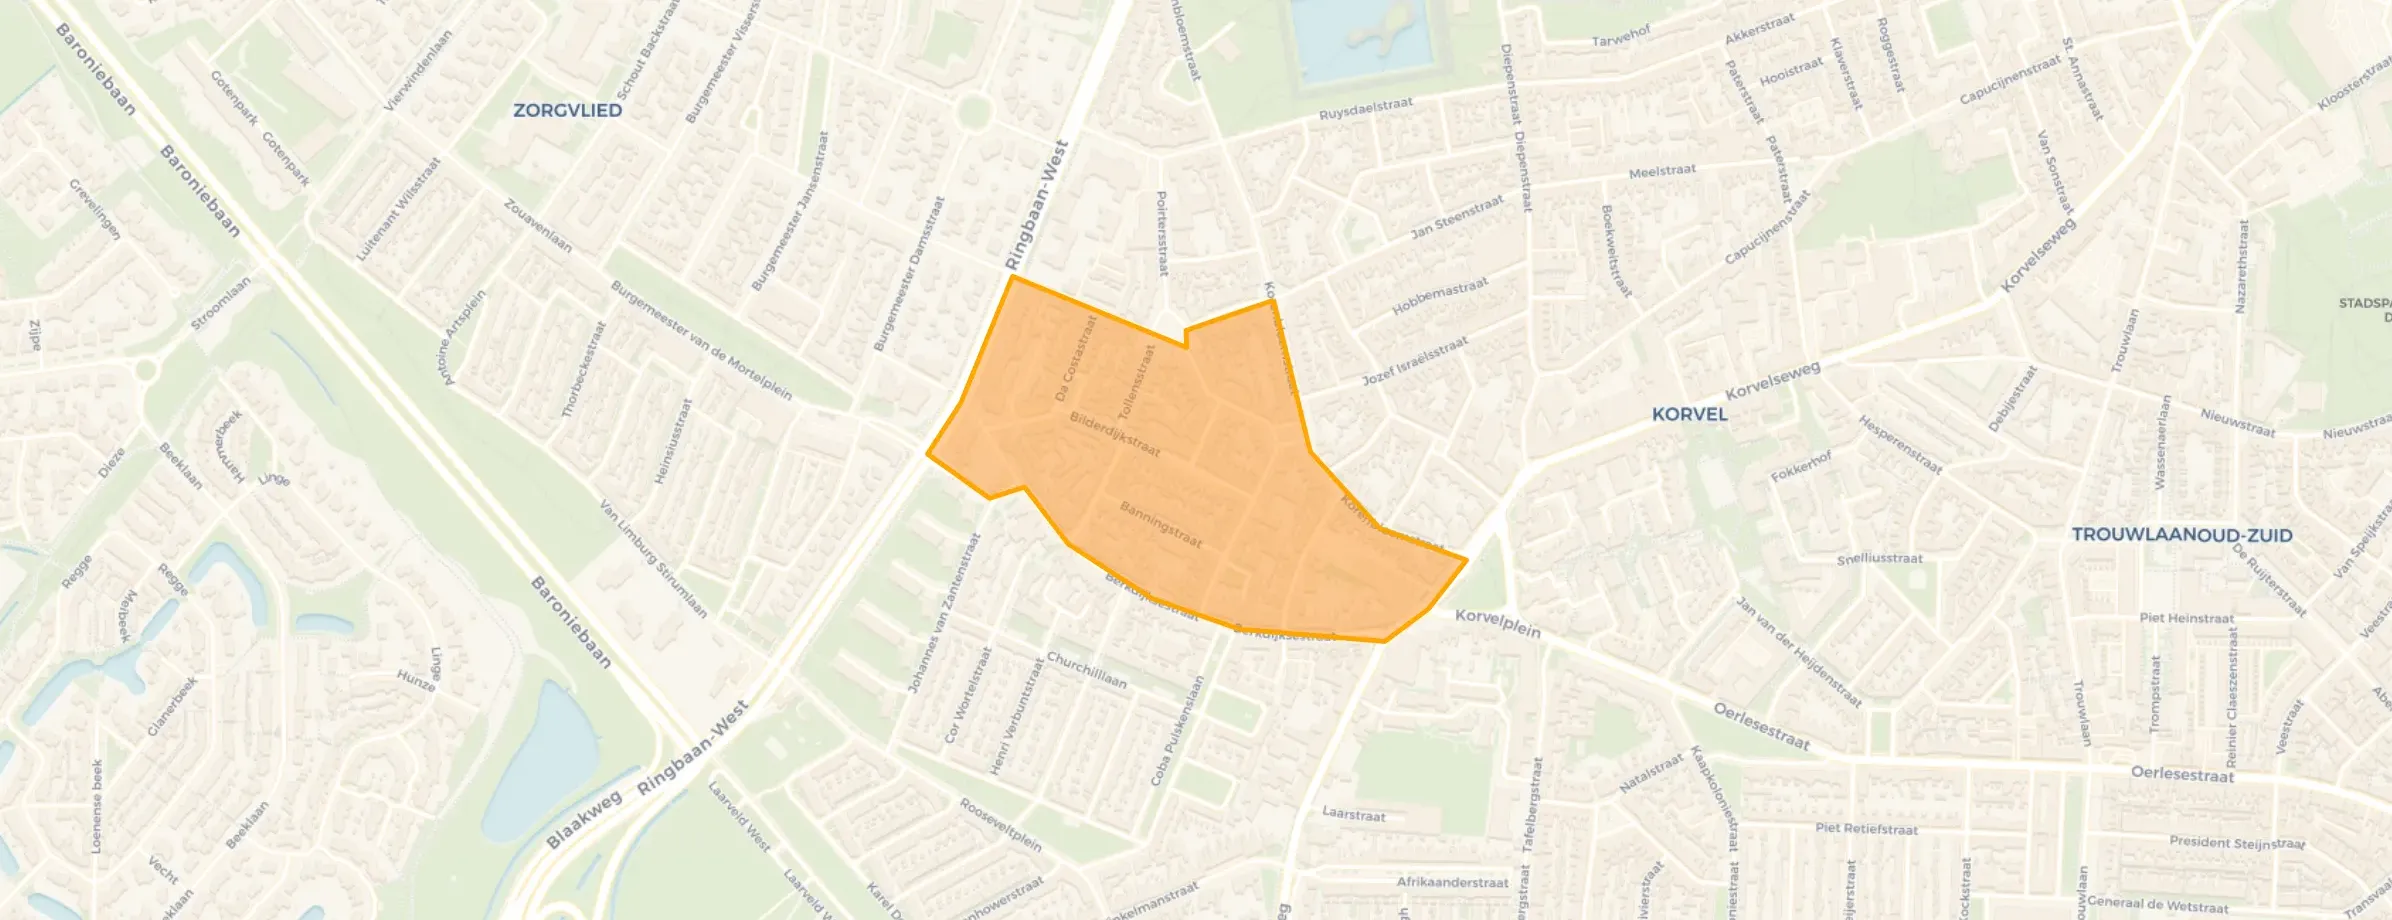
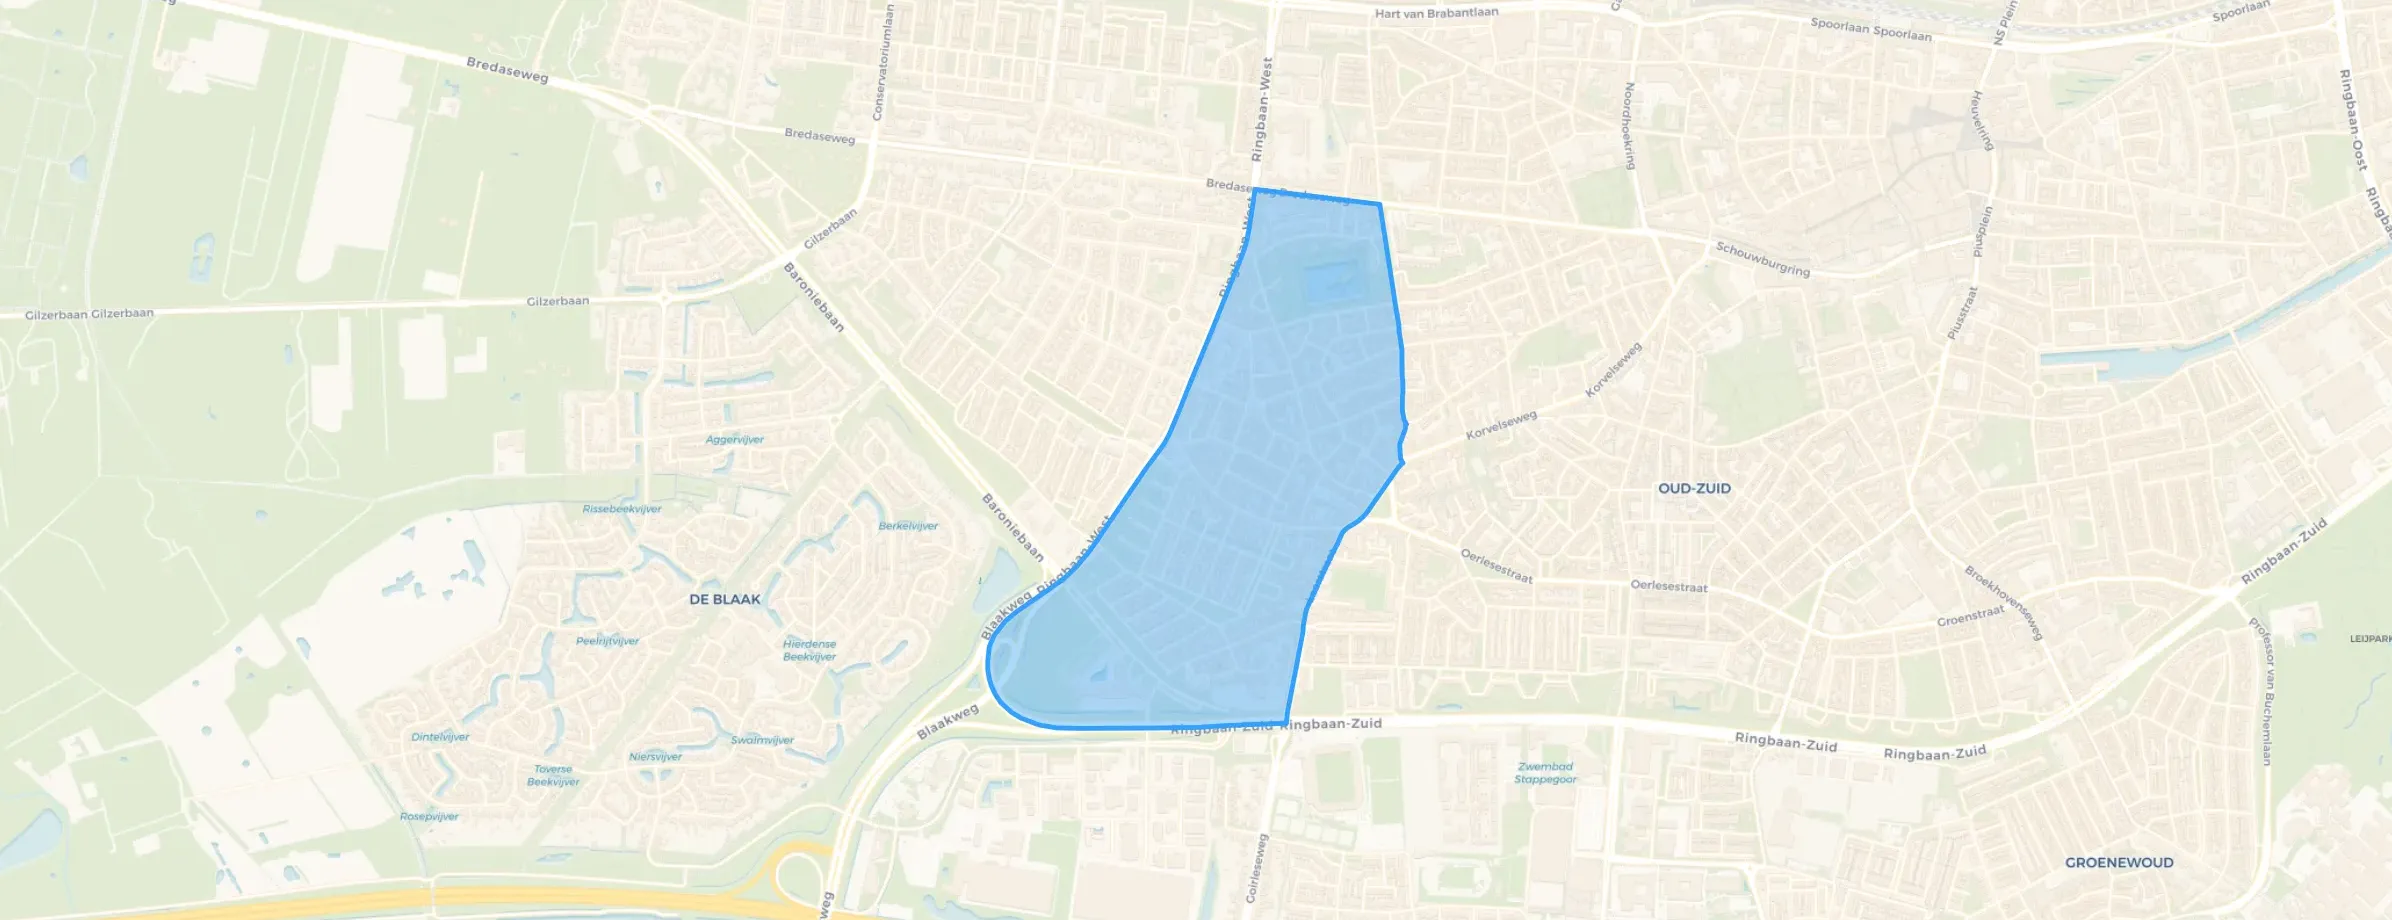
Korvel is located in the province of Noord-Brabant, in the municipality of Tilburg The district has a total area of 80 hectares, of which 79 hectares are land and 1 hectares are water. The district is coded as WK085517. The postcode area is 5025JX-5038NX.
Korvel has 5.810 residents. Of these, 48,9% are men and 51,1% are women. Most residents are 25 to 45 years (30,2%). The other age groups are 21,7% for '45 to 65 years', 19,3% for '65 years or older', 17,6% for '15 to 25 years' and 11,2% for '0 to 15 years'. Of the residents, 61,2% is unmarried, 24,4% is married, 8,1% is divorced and 6,5% is widowed. 3.825 residents originate from the Netherlands, 890 come from Europe and 1.095 come from countries outside Europe.
There are 3.225 households in Korvel. 57,2% of these are single-person households, 22,3% households without children and 20,5% households with children. The average household size is 1,7 persons.
In Korvel there are 4.500 income recipients. The average income per income recipient is €29.900, which is €5.900 (16%) lower than the national average of €35.800. Per resident, the average income is €25.700, which is €3.500 (12%) lower than the national average of €29.200. Most residents of Korvel are educated to an intermediate level. 45,3% have an intermediate education (HAVO, VWO or MBO 2-4), 28,0% have a lower education (VMBO or MBO 1) and 26,7% have a university or higher professional education (HBO/WO).
Of the 5.810 residents, around 63% are in paid employment, which amounts to 3.660 people. This is 2% lower than the national average of 65%. The majority of workers are in salaried employment (88%), while 12% are self-employed. In Korvel, 28% of residents receive a benefit. The largest group is those receiving a state pension (AOW). 1.030 people receive this benefit.
In Korvel there are 2.960 homes with an average assessed value (WOZ) of €251.000. Of these, around 96% are occupied and 4% unoccupied. Most homes are rental properties. This amounts to 61% rental homes and 39% owner-occupied homes. Of the homes, 39% privately owned, 29% owned by housing associations and 31% owned by other landlords. The most common construction periods in Korvel are 1950-1970 (25%) and 1925-1950 (24%).
There are currently no homes for sale in Korvel. The most recently listed home is Johannes van Zantenstraat 51 by Fijne Makelaar. No homes were sold in Korvel over the past year.
There are currently no homes for rent in Korvel. The most recent home is Thomas van Kempenstraat 8-10, offered by BVwonen op Pararius. No homes were let in Korvel over the past year.
No recent rental data available for Korvel.
In Korvel there are 3.005 addresses with a registered energy label. The most common labels are C (25%), F (18%) and A (14%). On average, an address in Korvel uses 2.300 kWh of electricity per year. This is 18% below the national average of 2.810 kWh. With an annual consumption of 990 m³ per address, natural gas consumption is 23% below the national average of 1.280 m³.
Neighbours are welcoming and kind, everything is close together but that's not a problem, no issues with noise or anything. If something is going on, the neighbourhood hears about it fairly quickly. Not much greenery.
Auto-translated to English by AIMy husband grew up in this neighbourhood; it used to be pleasant. We've been living here for 17 years now and it has deteriorated badly. The houses have recently been renovated and look very neat, but that's just a facade. It has become impoverished. It's every man for himself. The sense of community is completely gone. I hardly dare to go outside, especially in the evening. Also, a councillor from Delft is ruining the infrastructure.
Auto-translated to English by AIDespite the bumps in the road (one in front of our house), they drive like mad and against the direction. Few social contacts, can count them on one hand. My husband grew up in this neighbourhood, for him back then a 10, now a 3.
Auto-translated to English by AIEven though we live on a hump in the road, they race through the street way too fast here, a neighbourhood party would be welcome.
Auto-translated to English by AIThe housing stock is predominantly pre-war — 52% of the homes date from before 1945. In addition, the most common type is terraced houses (45%).
Over the past year a home for sale in Korvel was listed for an average of €391,278 (€3,630 per m²).
Residents give Korvel a 5.7 out of 10 based on 4 reviews. Accessibility stands out with a 8.5; nature and greenery lags behind with a 3.2.
Wijk Korvel has 5,810 residents. The largest age group is 25 to 45 years (30%). Notably, 57% of the households are single-person households.
A considerable share of the supply in Korvel is less efficient: 41% has an E, F or G label. The average natural gas consumption per household is 990 m³ per year.
From Korvel you can on average reach a supermarket at 0.5 km, a GP at 0.5 km, a railway station at 2.3 km, a primary school at 0.6 km (as the crow flies, source: CBS).
Right now you will find 20 homes for sale and 7 homes for rent in Korvel.