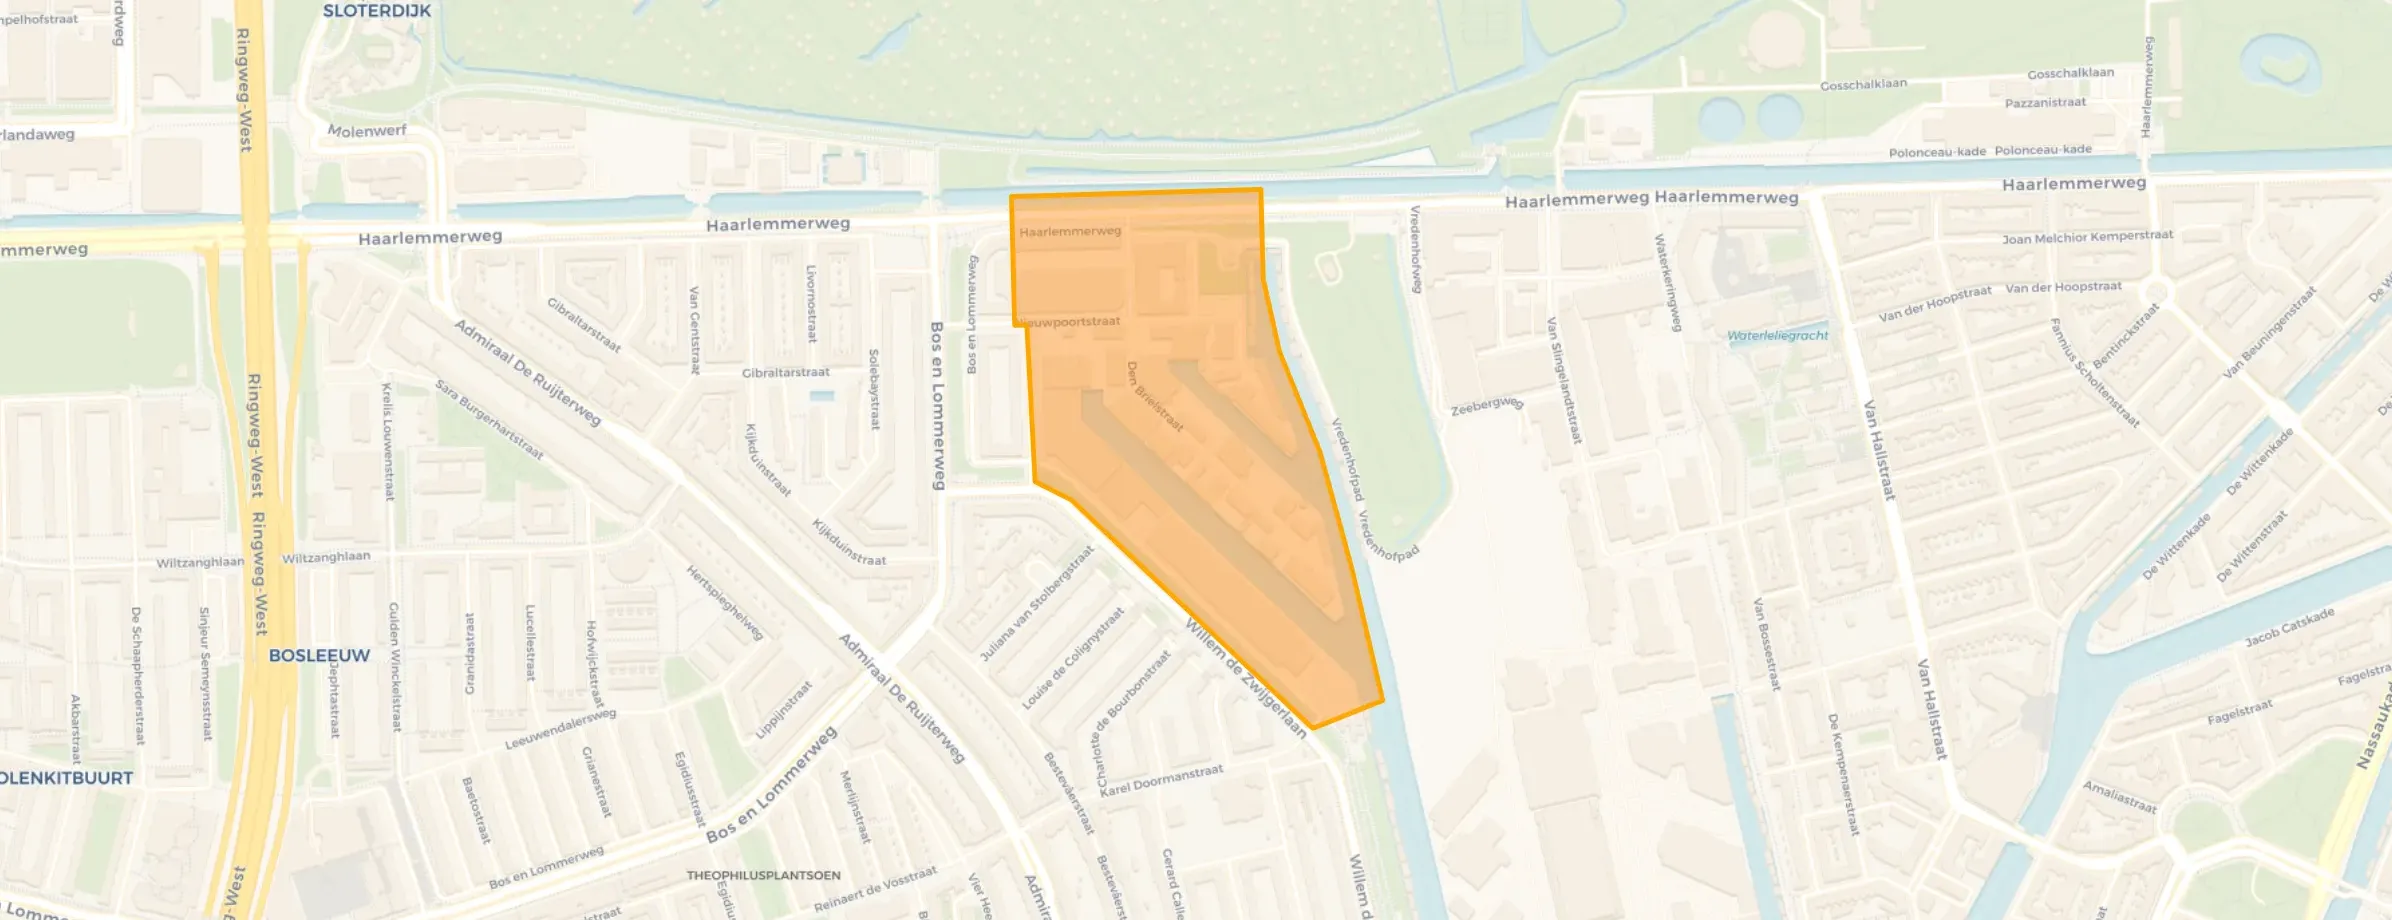
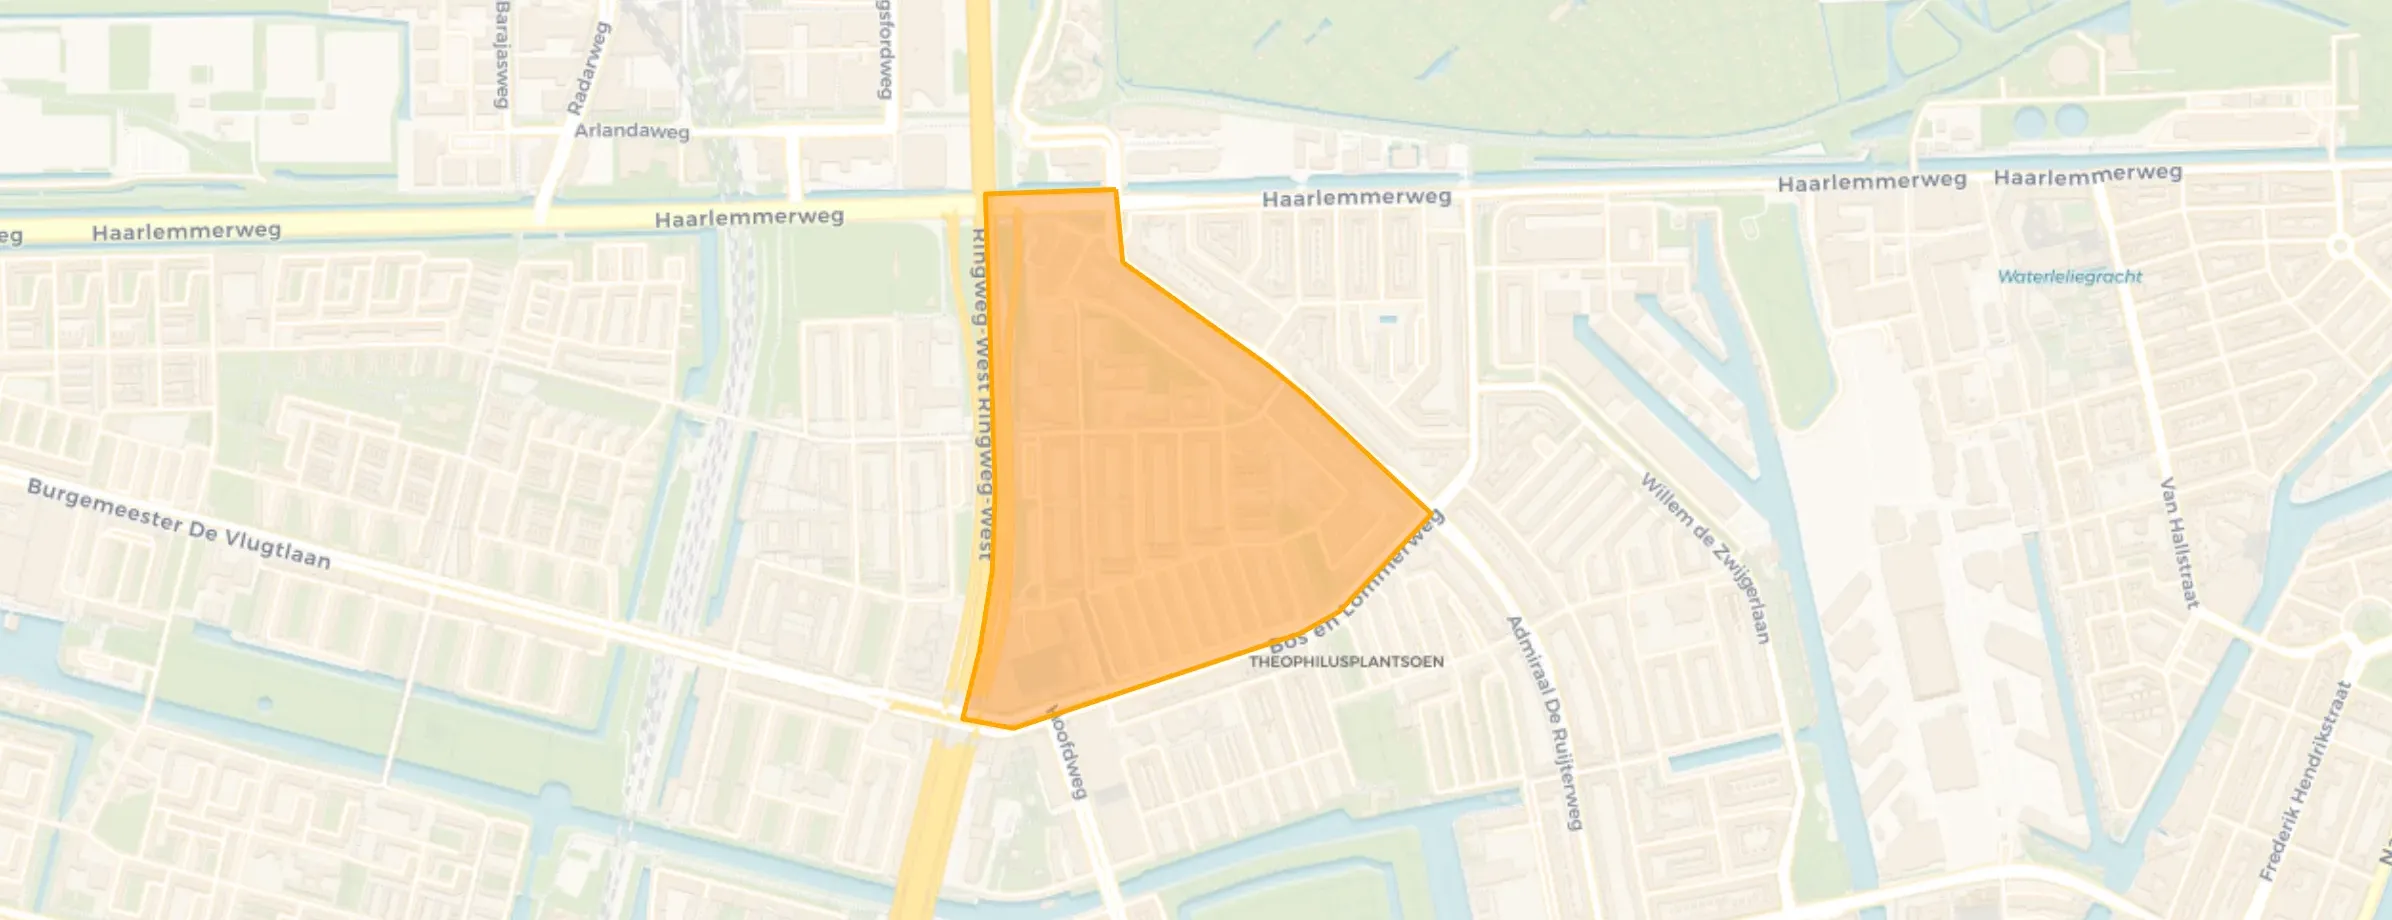
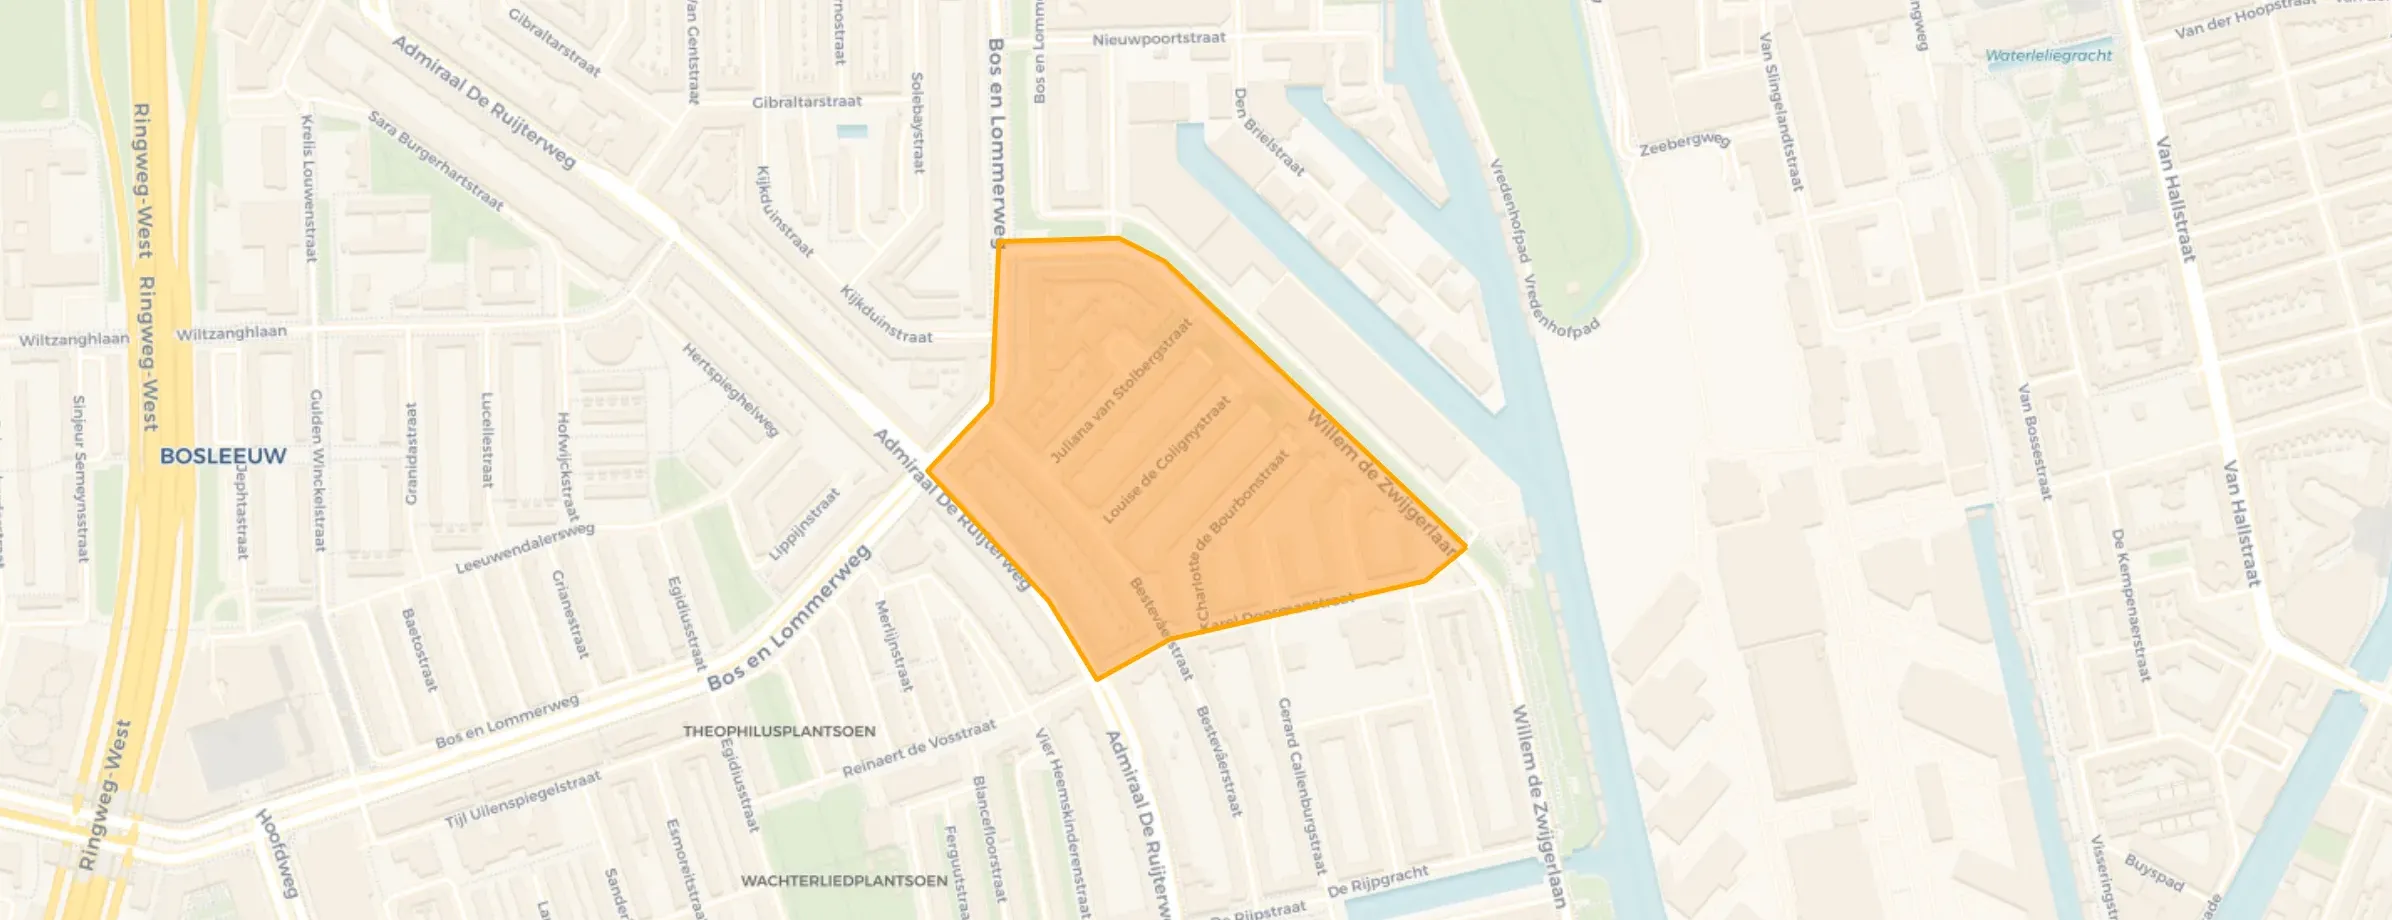
District in Amsterdam
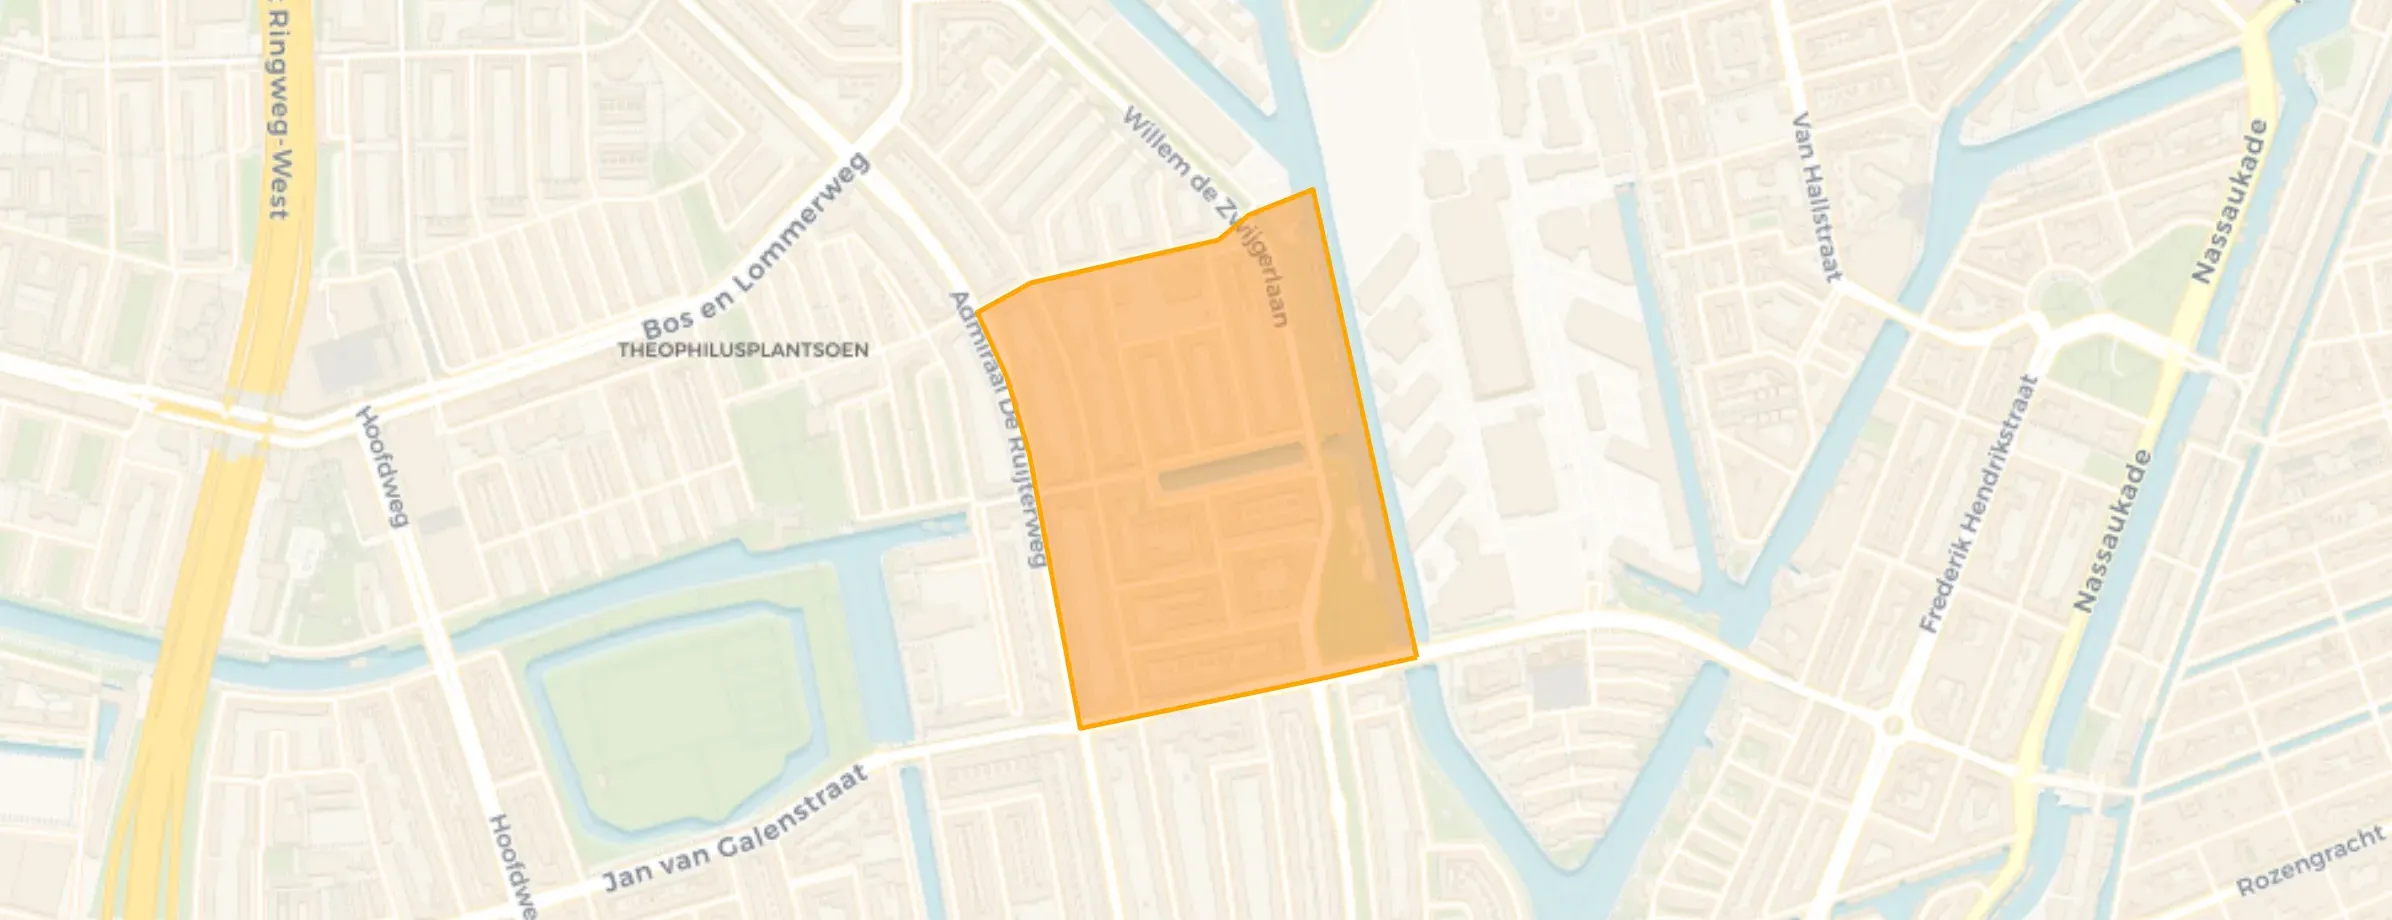
Landlust is located in the province of Noord-Holland, in the municipality of Amsterdam The district has a total area of 109 hectares, of which 102 hectares are land and 7 hectares are water. The district is coded as WK0363EE. The postcode area is 1055CL-1056XZ.
Landlust has 19.130 residents. Of these, 50,3% are men and 49,7% are women. Most residents are 25 to 45 years (44,4%). The other age groups are 22,1% for '45 to 65 years', 12,4% for '0 to 15 years', 12,3% for '15 to 25 years' and 8,8% for '65 years or older'. Of the residents, 68,9% is unmarried, 22,2% is married, 7,1% is divorced and 1,8% is widowed. 6.510 residents originate from the Netherlands, 3.345 come from Europe and 9.275 come from countries outside Europe.
There are 10.640 households in Landlust. 54,4% of these are single-person households, 24,0% households without children and 21,7% households with children. The average household size is 1,8 persons. The national average is 2,1 persons.
In Landlust there are 15.400 income recipients. The average income per income recipient is €44.300, which is €2.100 (5%) higher than the national average of €42.200. Per resident, the average income is €36.900, which is €2.000 (6%) higher than the national average of €34.900. Most residents of Landlust are highly educated. 51,3% have a university or higher professional education (HBO/WO), 24,4% have an intermediate education (HAVO, VWO or MBO 2-4) and 24,2% have a lower education (VMBO or MBO 1).
Of the 19.130 residents, around 71% are in paid employment, which amounts to 13.582 people. This is 1% lower than the national average of 72%. The majority of workers are in salaried employment (80%), while 20% are self-employed. In Landlust, 19% of residents receive a benefit. The largest group is those receiving a state pension (AOW). 1.440 people receive this benefit.
In Landlust there are 9.849 homes with an average assessed value (WOZ) of €435.000. Of these, around 96% are occupied and 4% unoccupied. Most homes are rental properties. This amounts to 69% rental homes and 31% owner-occupied homes. Of the homes, 31% privately owned, 42% owned by housing associations and 27% owned by other landlords. The most common construction periods in Landlust are 1925-1950 (62%) and 1950-1970 (17%).
There are currently no homes for sale in Landlust. The most recently listed home is Jan Haringstraat 7-1 by JandeMakelaar NVM makelaars op Funda. No homes were sold in Landlust over the past year.
There are currently no homes for rent in Landlust. The most recent home is Joos Banckersplantsoen 2, offered by Openbare Makelaardij op Funda. No homes were let in Landlust over the past year.
No recent rental data available for Landlust.
In Landlust there are 9.418 addresses with a registered energy label. The most common labels are C (26%), A (20%) and D (16%). On average, an address in Landlust uses 1.650 kWh of electricity per year. This is 35% below the national average of 2.550 kWh. With an annual consumption of 600 m³ per address, natural gas consumption is 25% below the national average of 800 m³.
Everything has been renovated. Quiet and safe neighbourhood
Auto-translated to English by AIThis is a neighborhood that has improved a lot in the last 10 years. The buurt is quiet but still quite lively with a perfect combination of young professionals and families. You can reach Oud-West and Jordaan in 5 minutes by bike. Walking distance to Erasmus-Park and Westerpak. Very hip and with a sense of community.
Auto-translated to English by AII've lived in this neighbourhood my whole life and it's fantastic! There's plenty to do, just outside the city centre so there are few tourists. People really live here, there are many parks nearby and plenty of amenities! House prices aren't great, but if you live here, I think this is one of the simplest yet nicest neighbourhoods in the city. I work in a bakery in the neighbourhood myself, so I see hundreds of people from the area every weekend; they're healthy and fun people. I'm very proud of my neighbourhood.
Auto-translated to English by AII have experienced violence but very little. I have lovely social neighbours, the people are kind. I have never experienced racism or discrimination in the neighbourhood. I gave a failing grade for Education because, for example, the Marcanti College next to the neighbourhood has only inexperienced teachers and rude students.
Auto-translated to English by AIDgregjywwwwwwwwwwwwwwwwwwww
Auto-translated to English by AIMany drug-using and drug-dealing Moroccan loitering youths
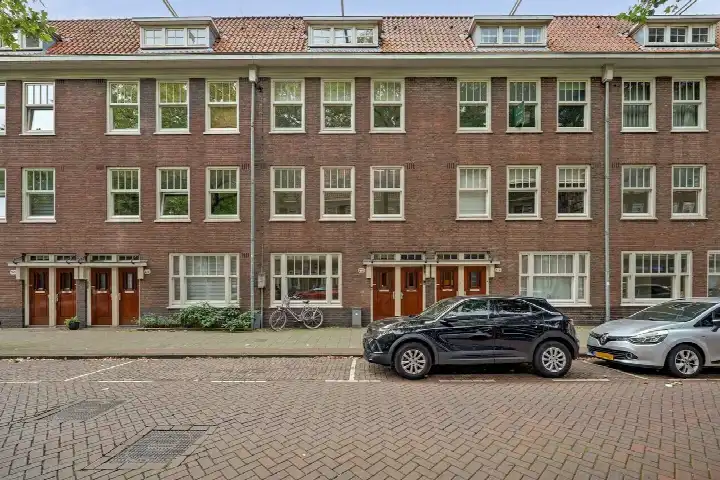
Auto-translated to English by AIThe housing stock is predominantly pre-war — 79% of the homes date from before 1945. In addition, the most common type is flats (99%).
Over the past year a home for sale in Landlust was listed for an average of €520,845 (€8,675 per m²). Last quarter prices fell by 5%.
A rental home in Landlust cost an average of €2,507 per month (€38 per m²). That is 16% above the national average.
Residents give Landlust a 7.0 out of 10 based on 6 reviews. The strongest score is for safety (7.8), the weakest for housing (6.0).
Wijk Landlust has 19,130 residents. The largest age group is 25 to 45 years (44%). Notably, 54% of the households are single-person households.
From Landlust you can on average reach a supermarket at 0.4 km, a GP at 0.6 km, a railway station at 2.7 km, a primary school at 0.5 km (as the crow flies, source: CBS).
Right now you will find 155 homes for sale and 12 homes for rent in Landlust.