District in Nijmegen
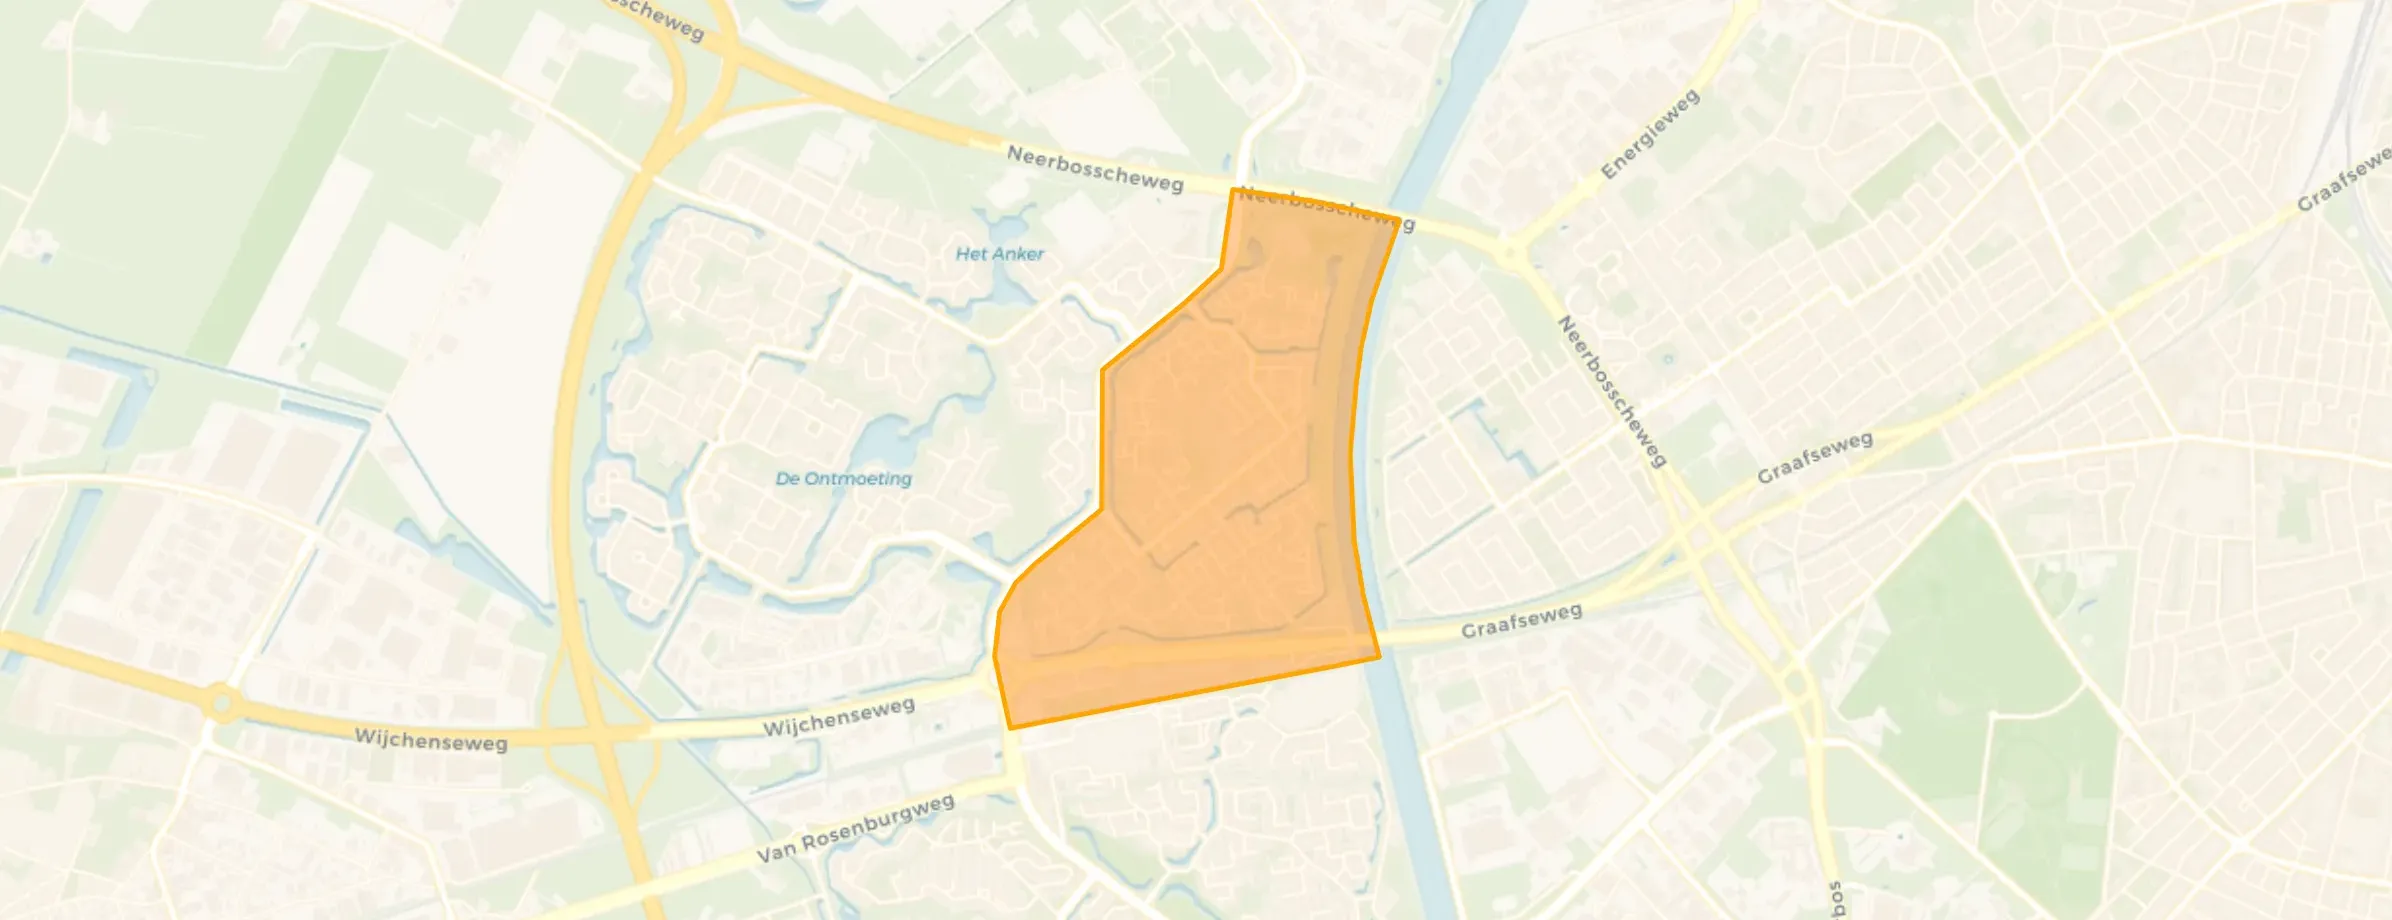
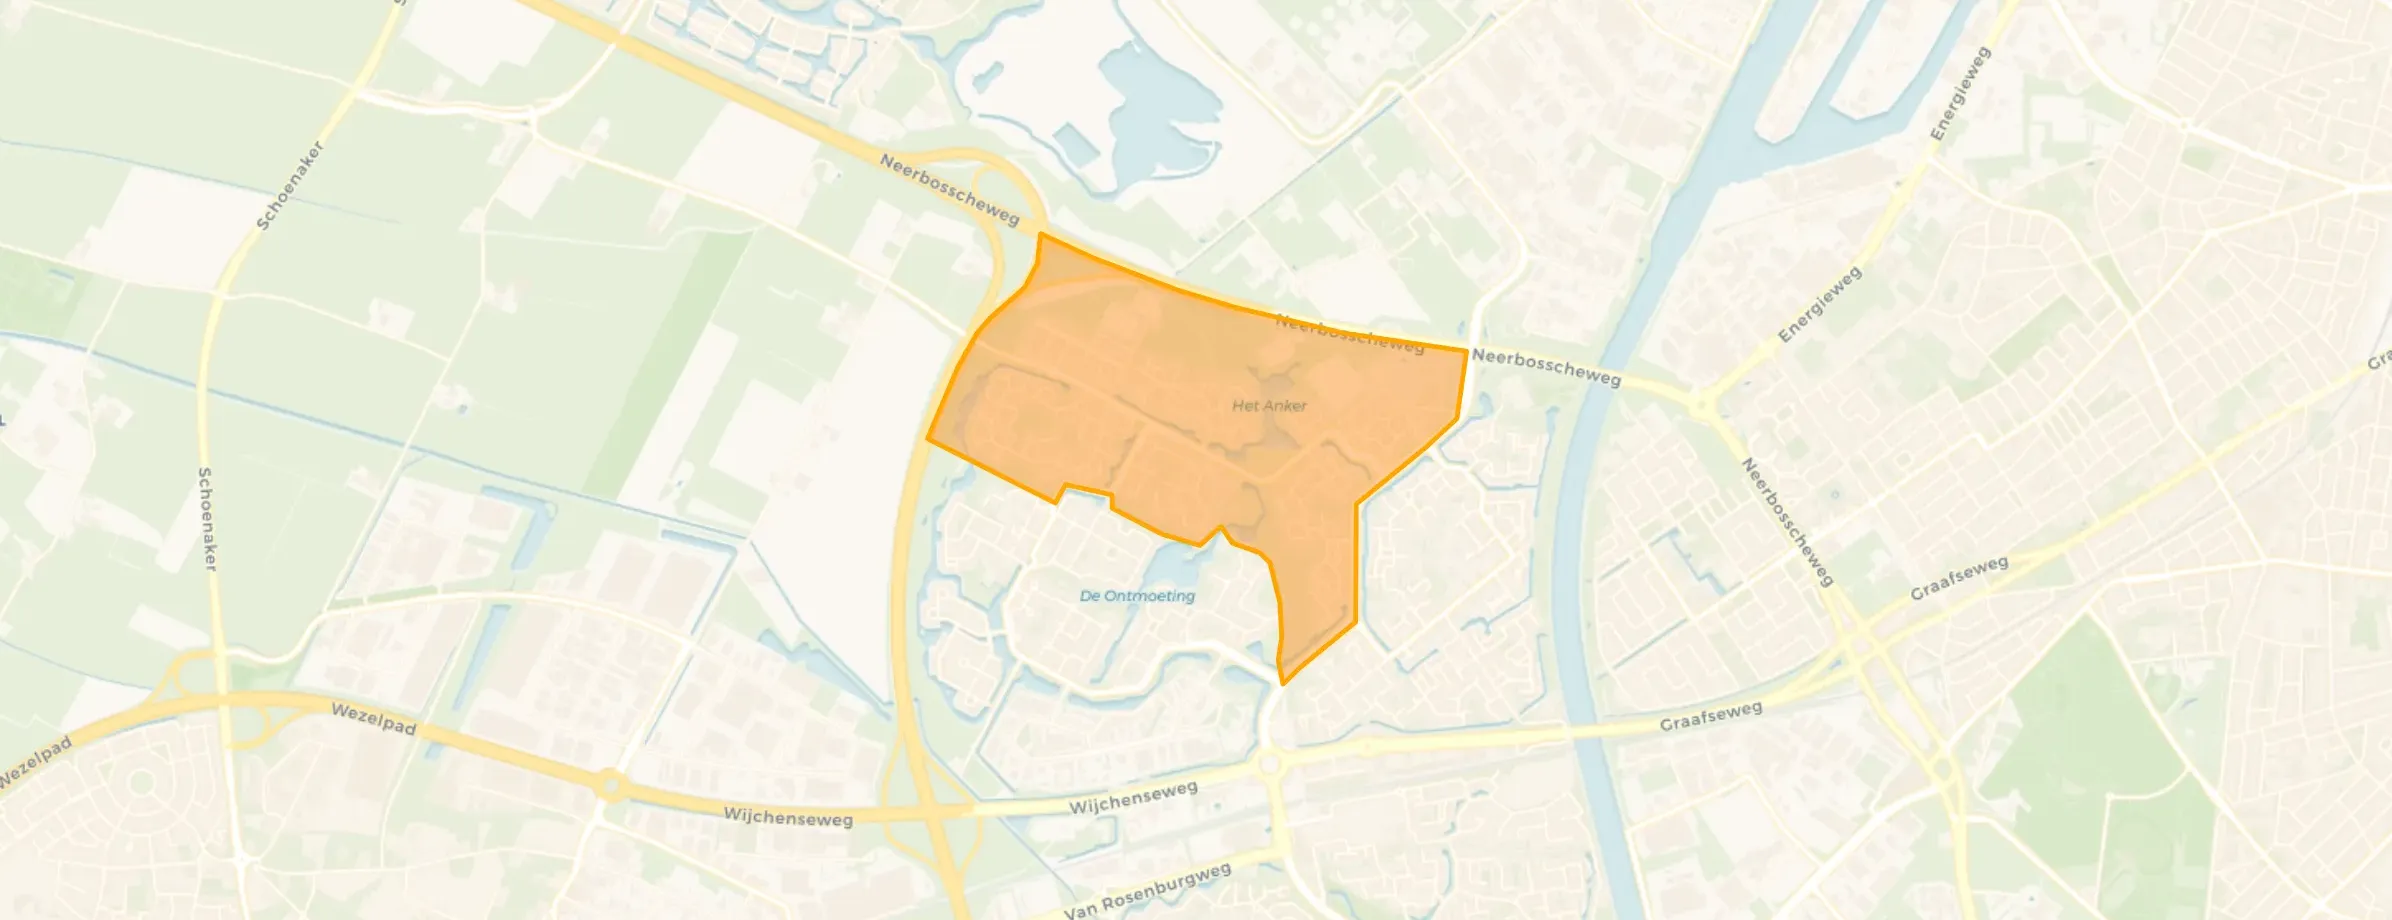
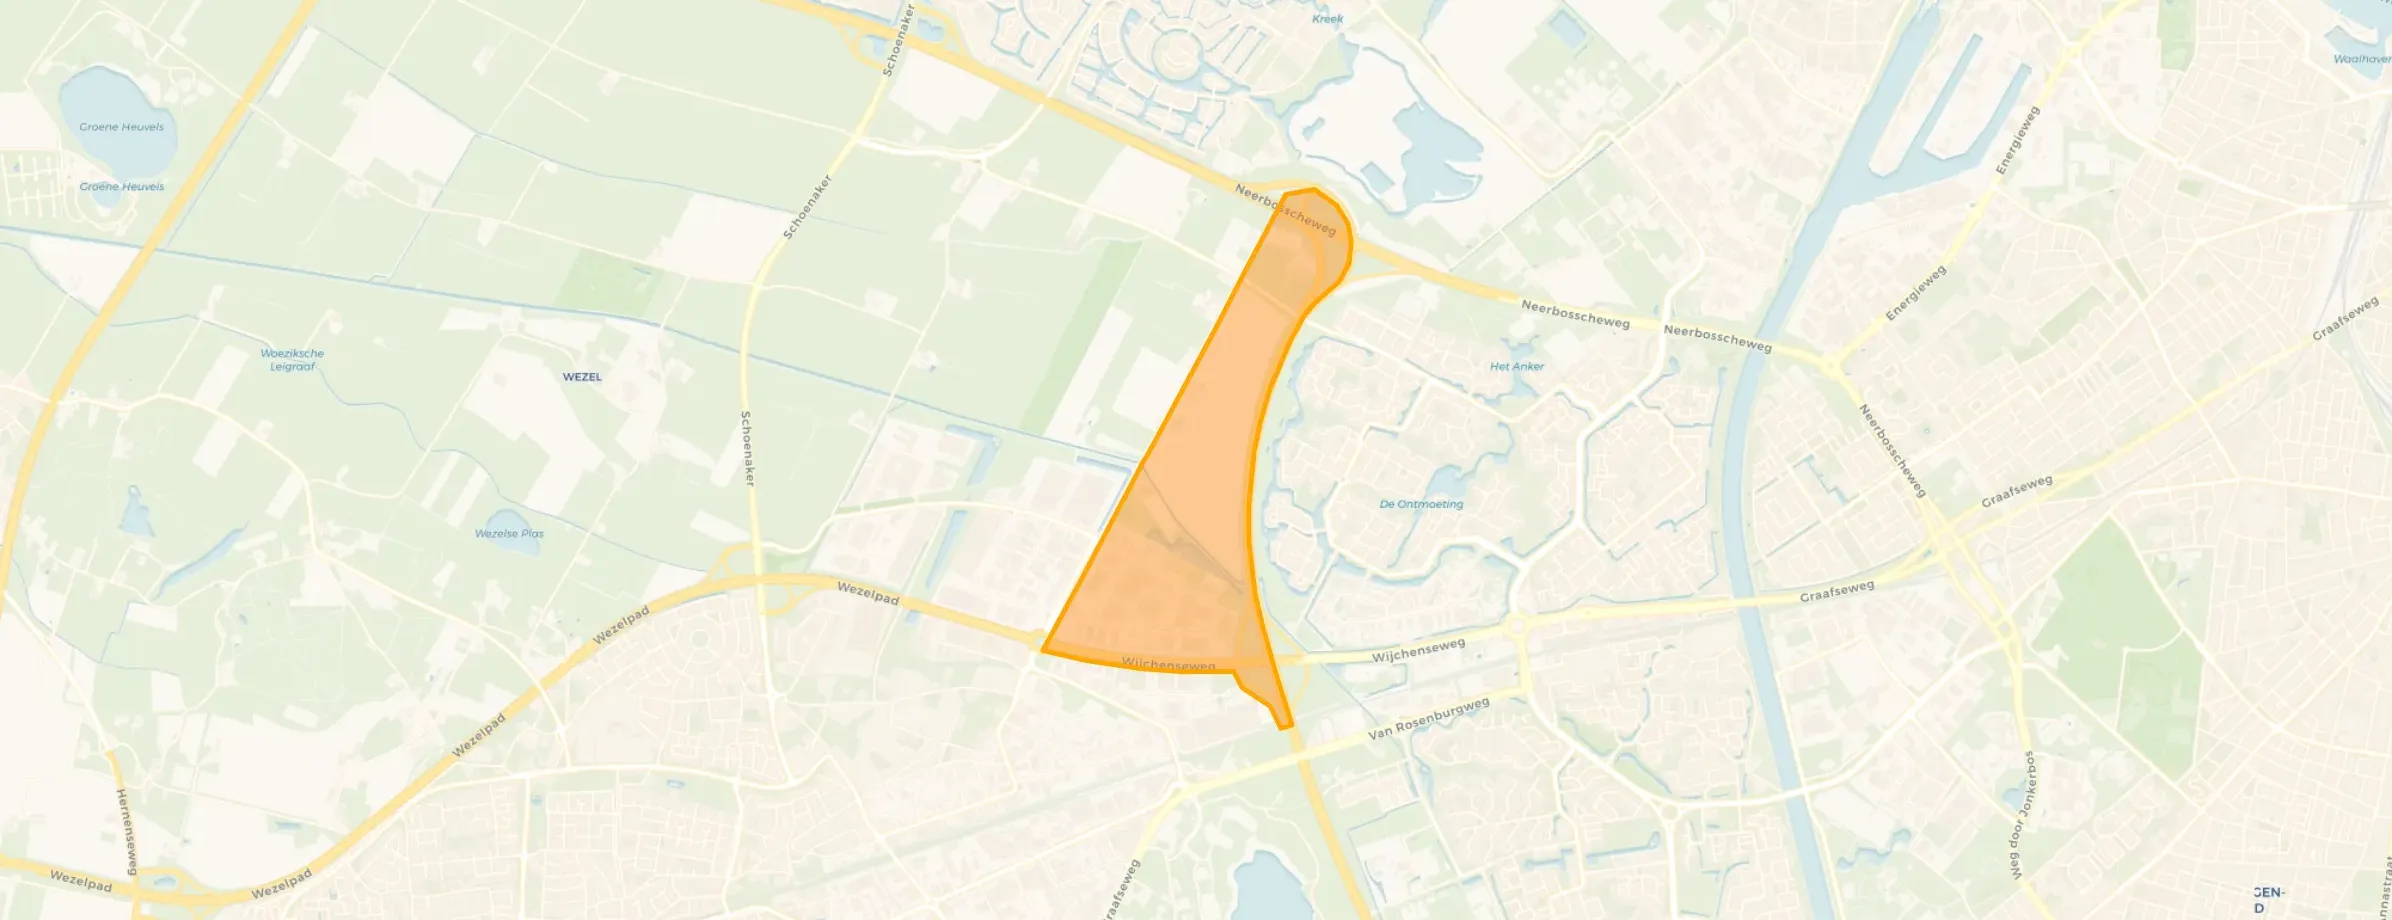
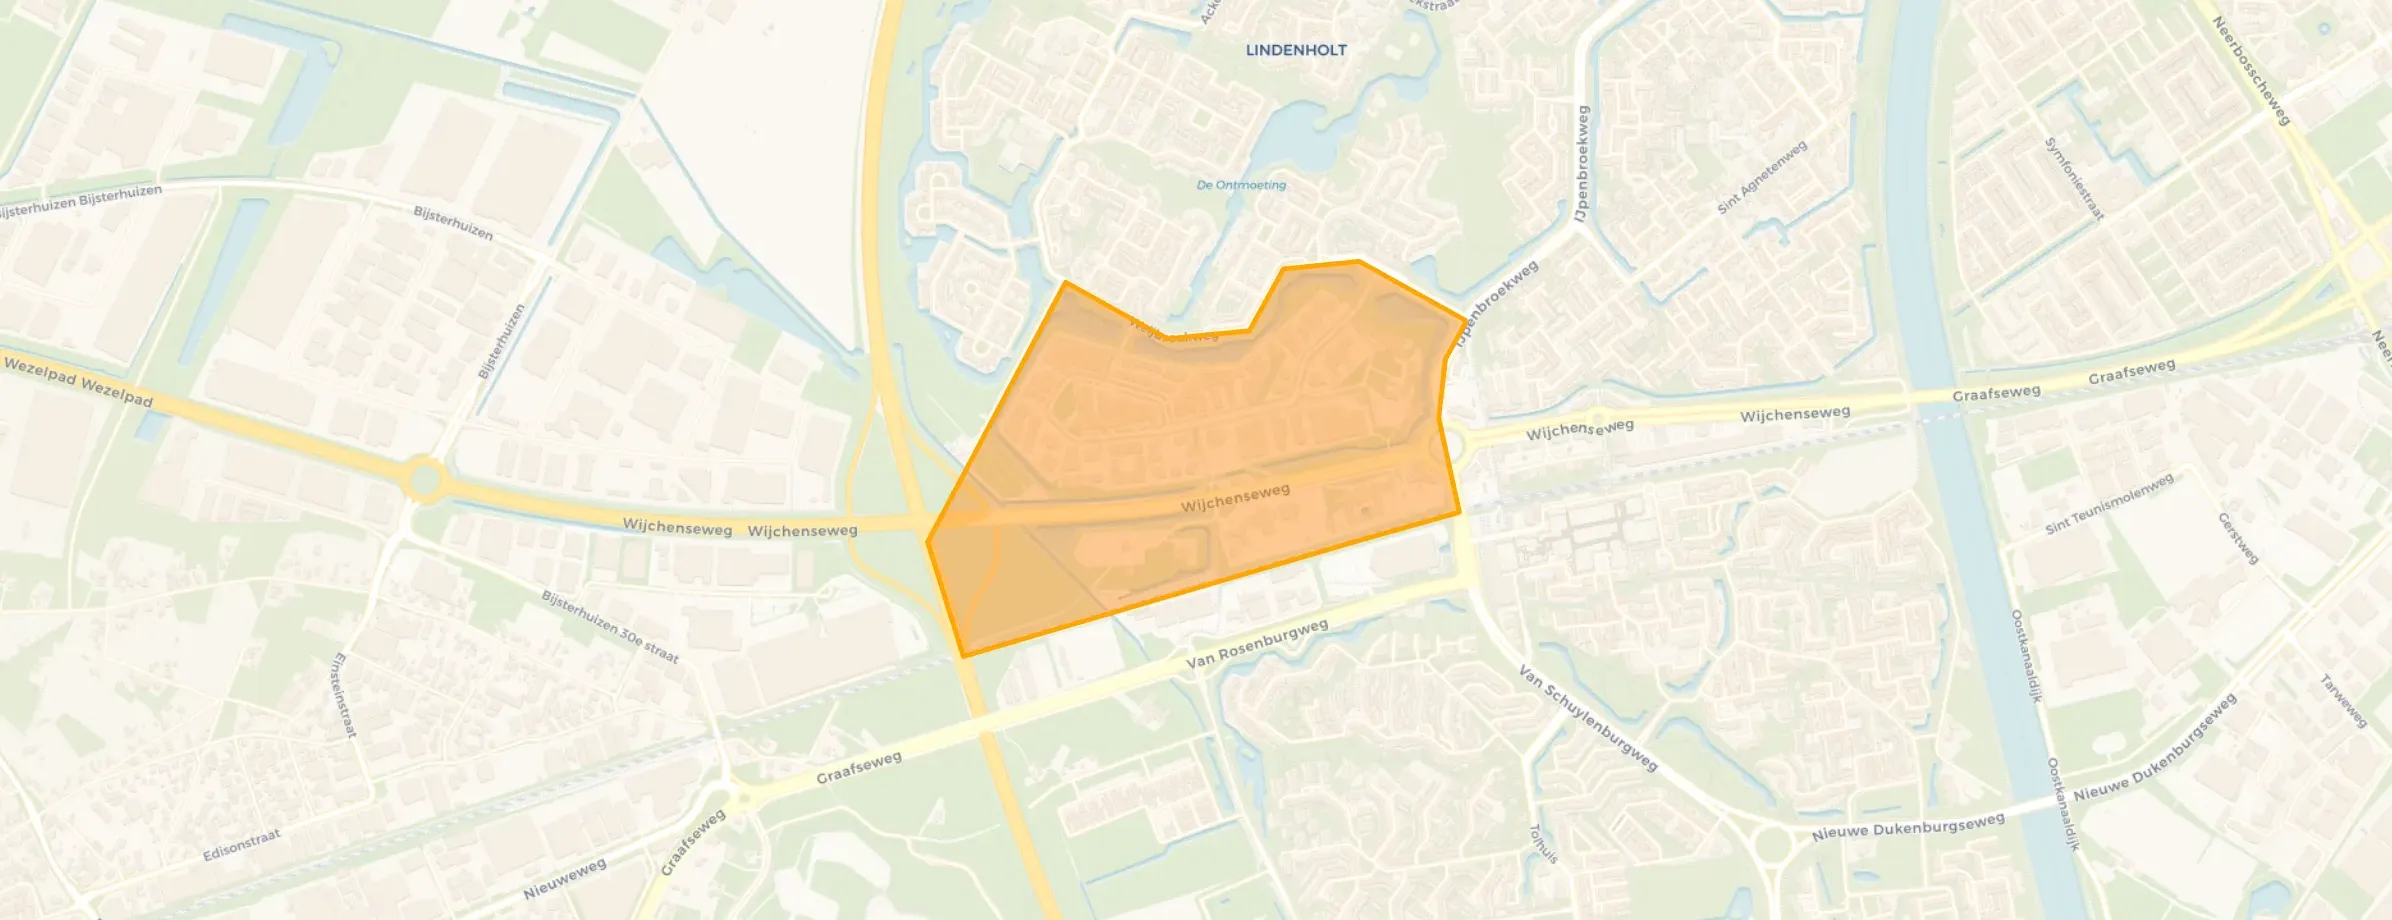
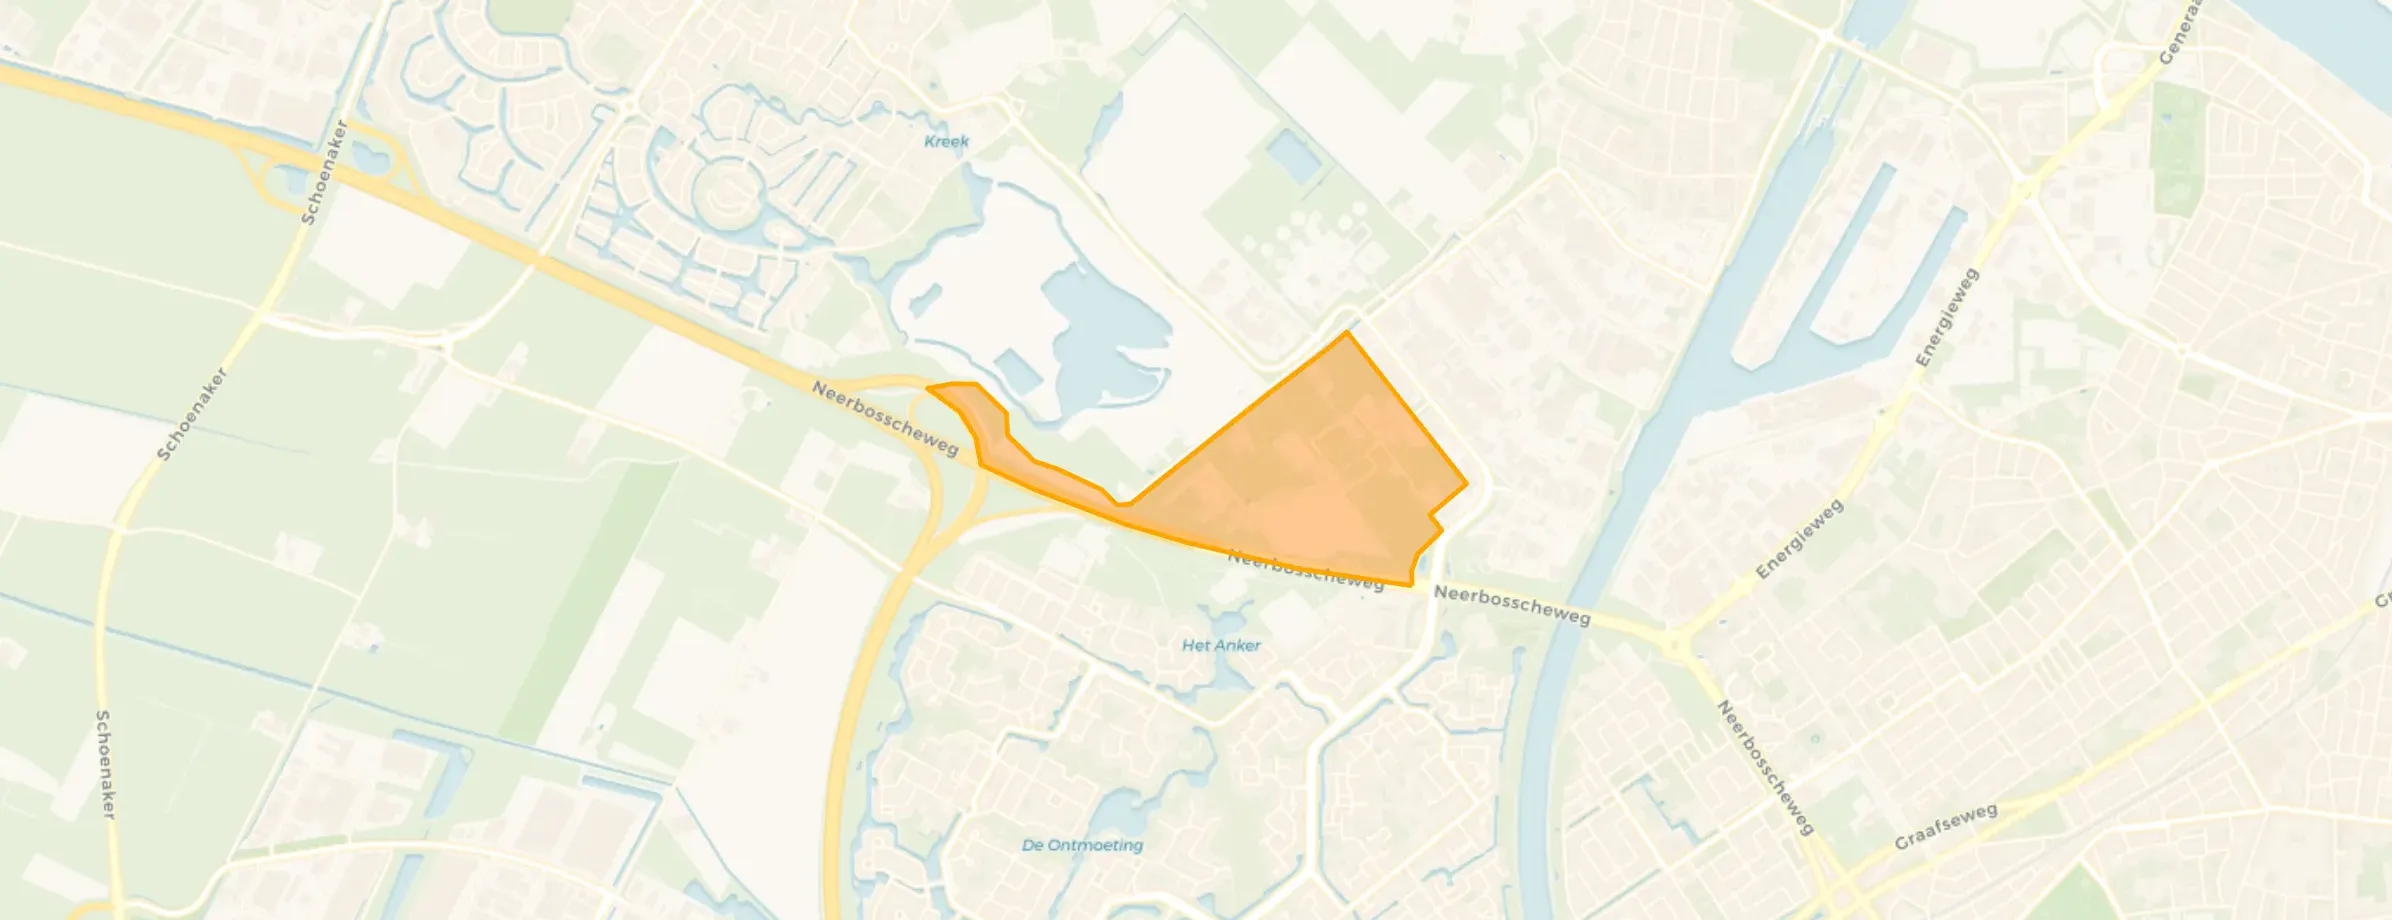
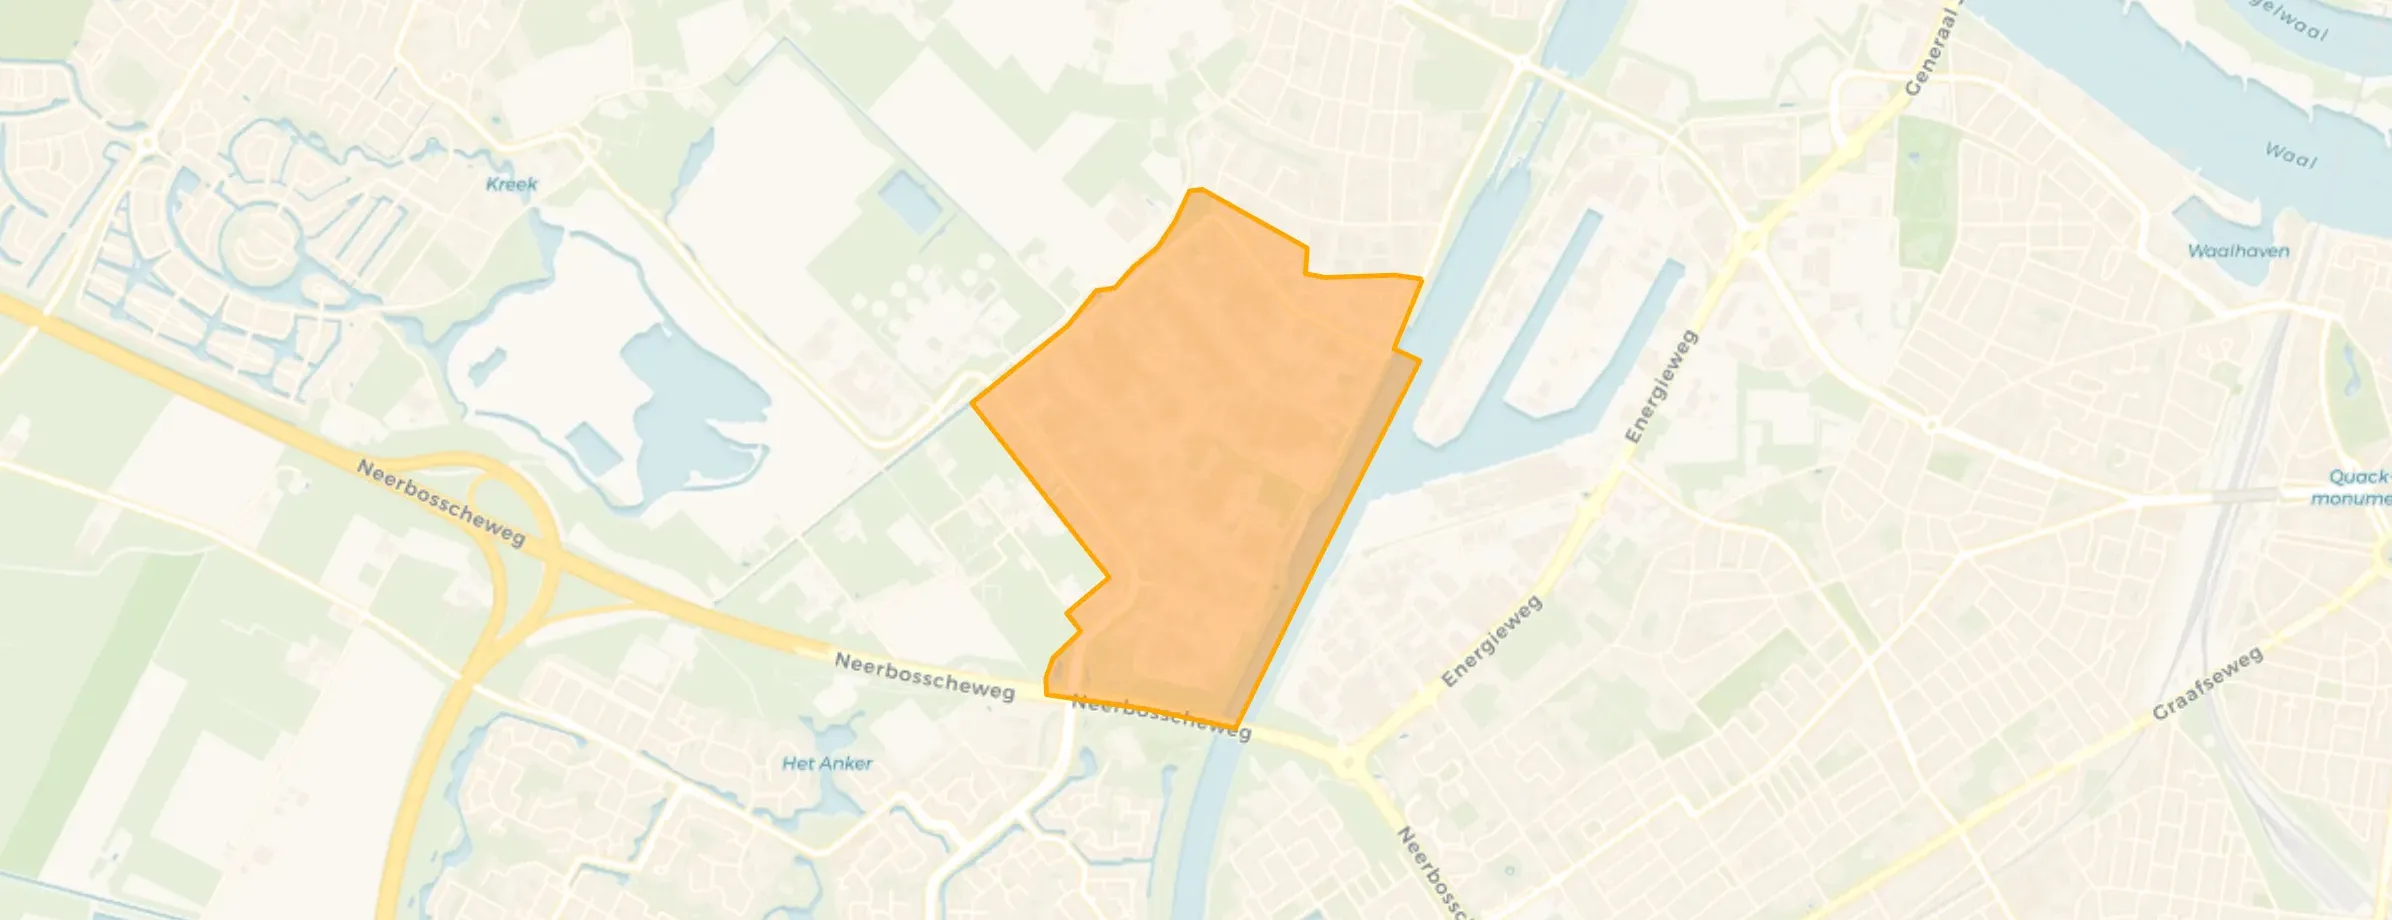
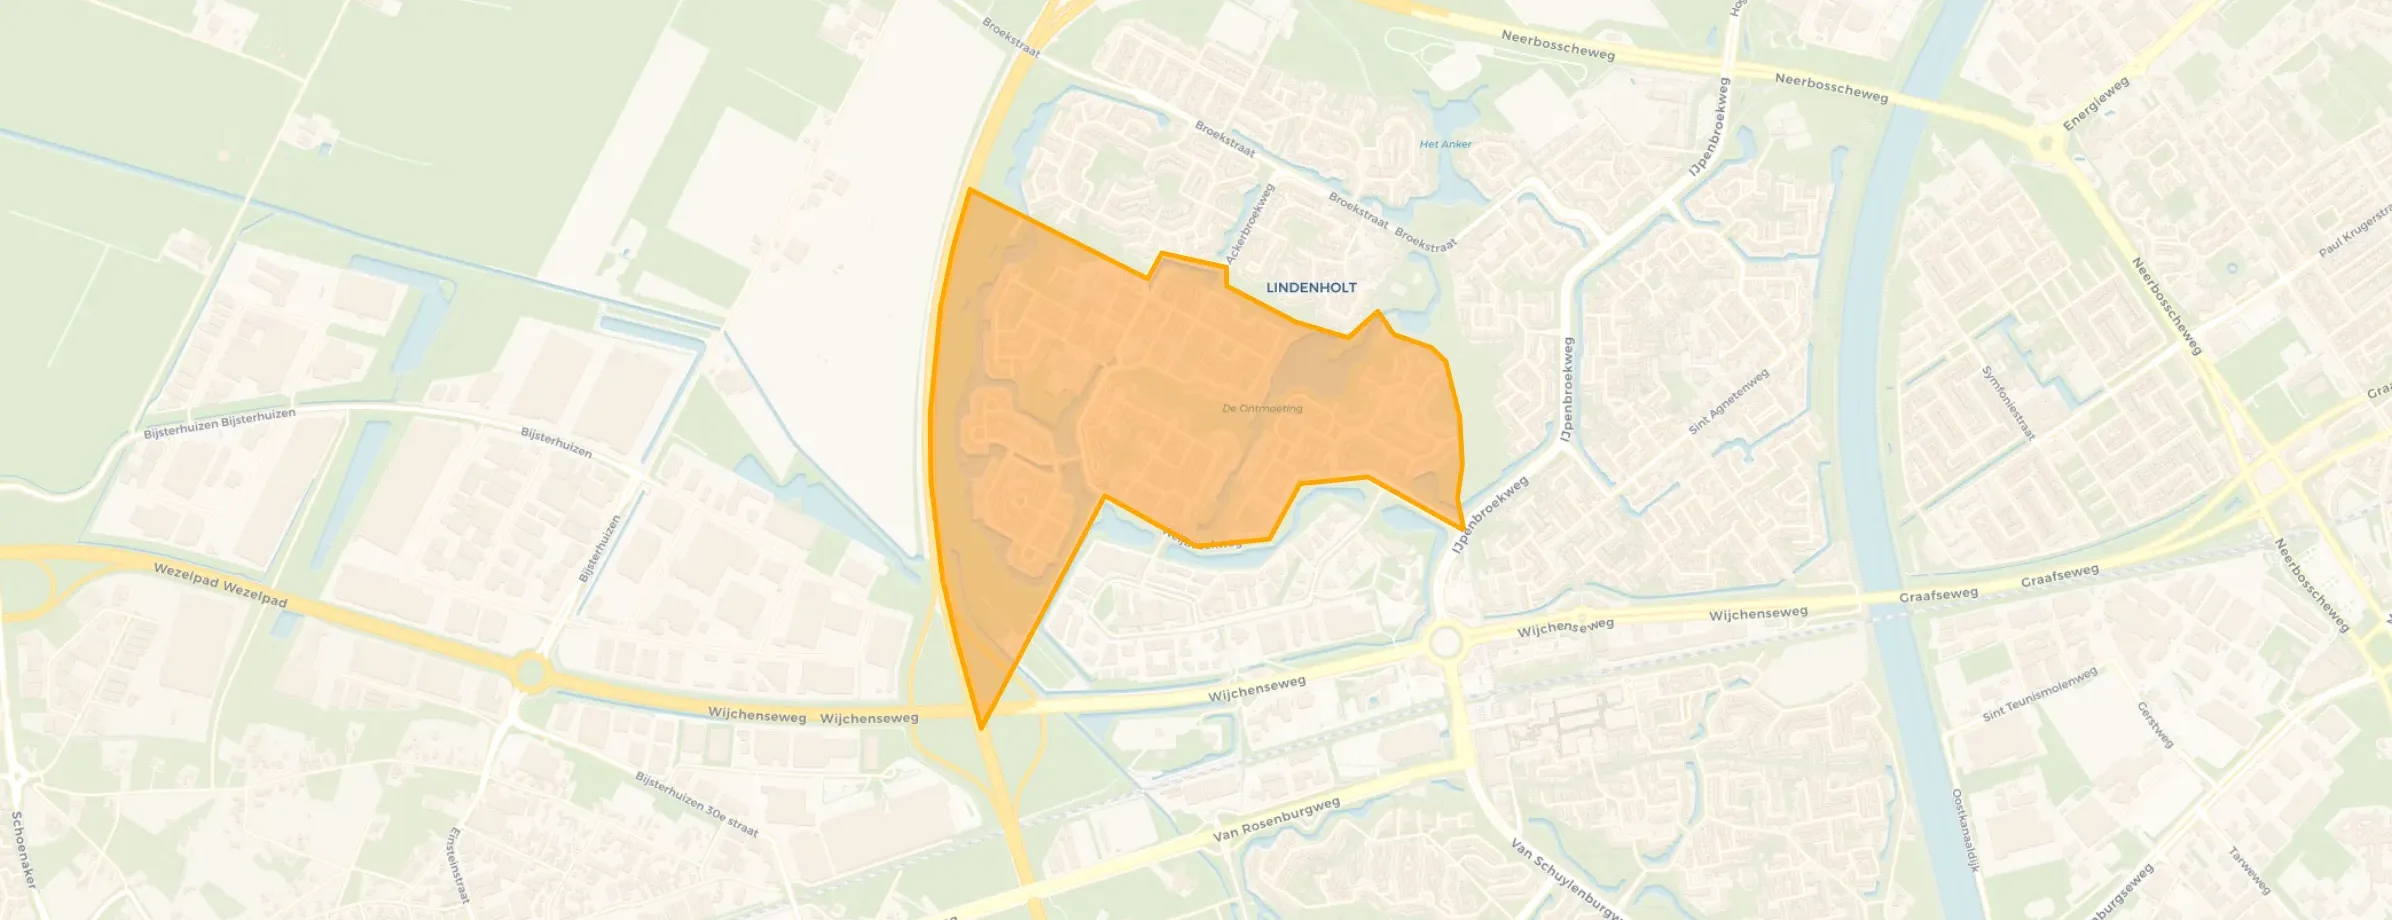
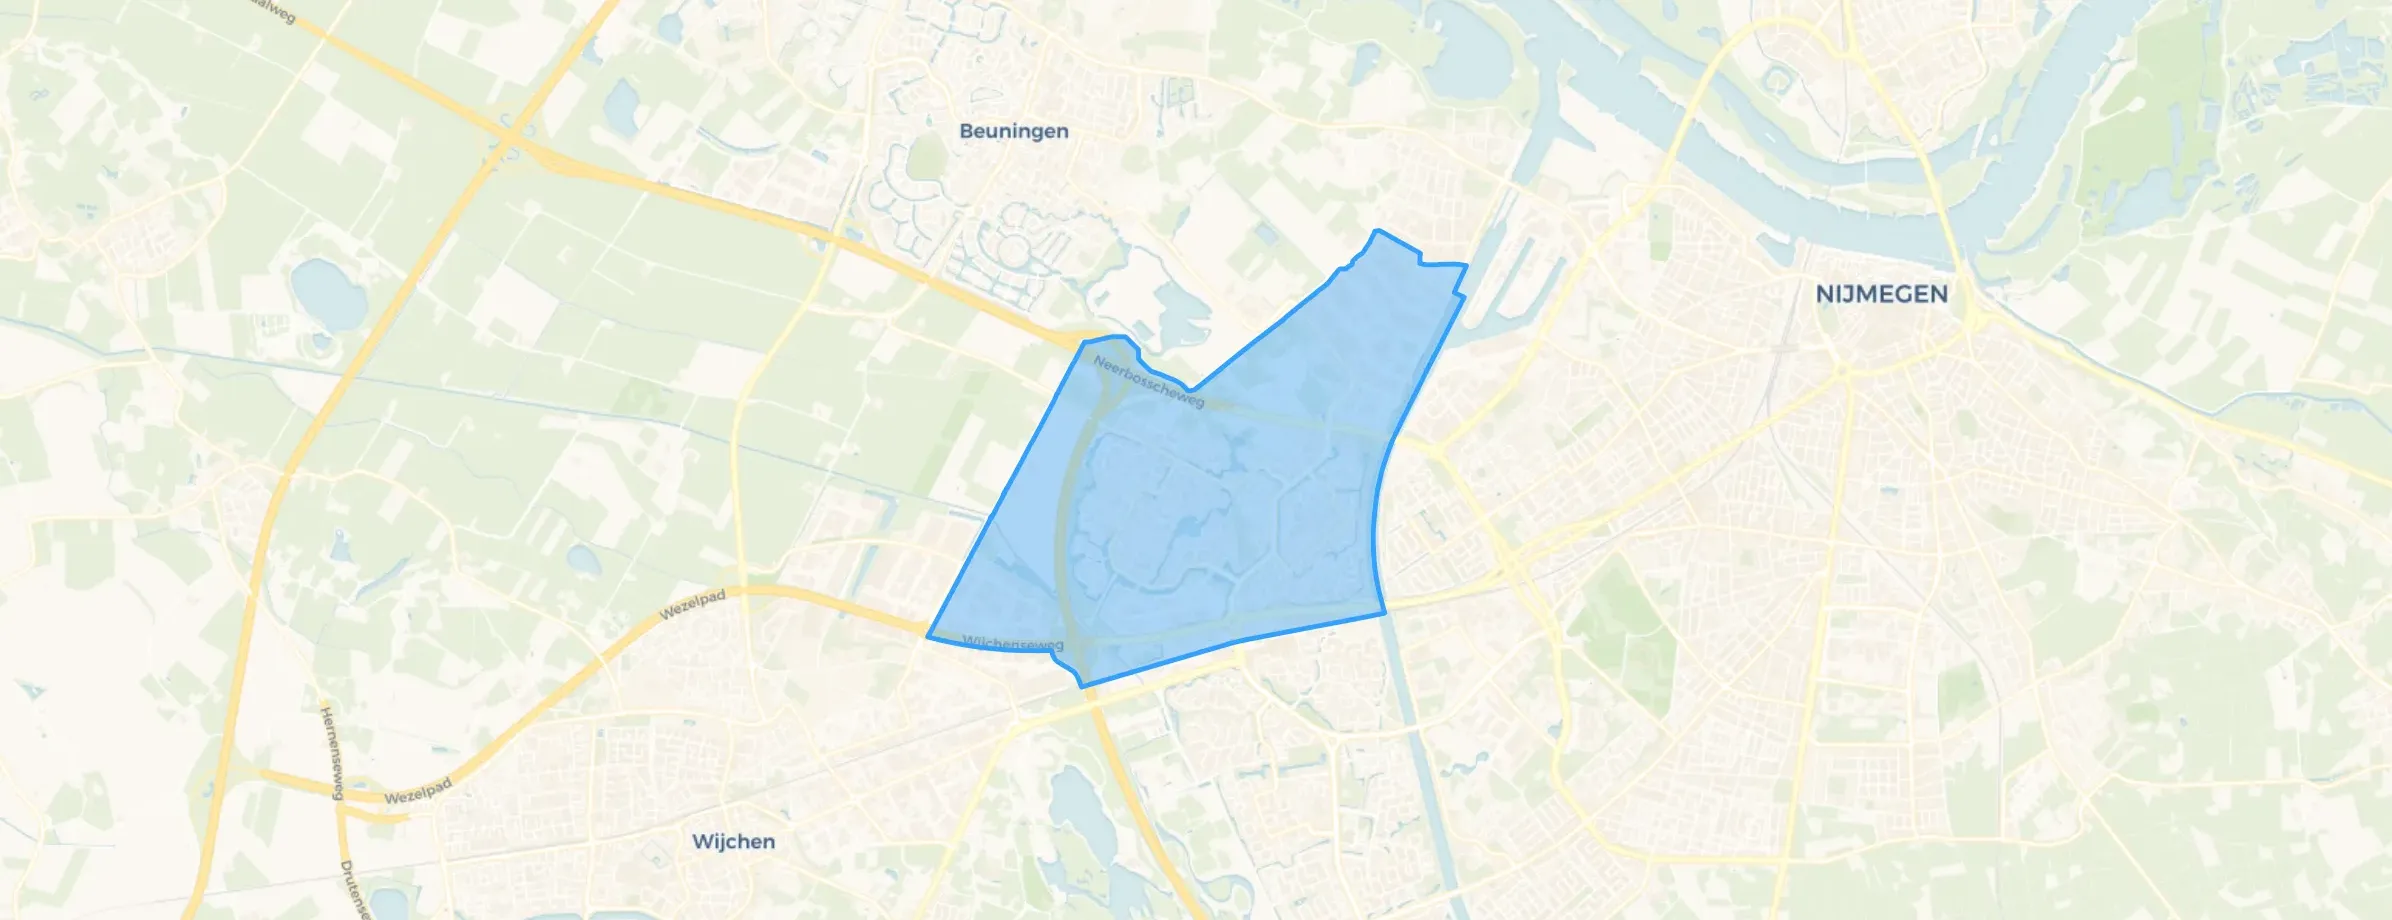
Lindenholt is located in the province of Gelderland, in the municipality of Nijmegen The district has a total area of 753 hectares, of which 718 hectares are land and 35 hectares are water. The district is coded as WK026808. The postcode area is 6537TL-6546XZ.
Lindenholt has 14.530 residents. Of these, 50,8% are men and 49,2% are women. Most residents are 45 to 65 years (28,0%). The other age groups are 26,7% for '25 to 45 years', 18,4% for '65 years or older', 14,6% for '0 to 15 years' and 12,3% for '15 to 25 years'. Of the residents, 50,9% is unmarried, 37,3% is married, 8,5% is divorced and 3,4% is widowed. 9.575 residents originate from the Netherlands, 1.275 come from Europe and 3.685 come from countries outside Europe.
There are 6.665 households in Lindenholt. 35,8% of these are single-person households, 28,8% households without children and 35,4% households with children. The average household size is 2,2 persons. The national average is 2,1 persons.
In Lindenholt there are 12.000 income recipients. The average income per income recipient is €36.900, which is €5.300 (13%) lower than the national average of €42.200. Per resident, the average income is €30.600, which is €4.300 (12%) lower than the national average of €34.900. Most residents of Lindenholt are educated to an intermediate level. 44,5% have an intermediate education (HAVO, VWO or MBO 2-4), 29,0% have a lower education (VMBO or MBO 1) and 26,5% have a university or higher professional education (HBO/WO).
Of the 14.530 residents, around 68% are in paid employment, which amounts to 9.880 people. This is 4% lower than the national average of 72%. The majority of workers are in salaried employment (87%), while 13% are self-employed. In Lindenholt, 27% of residents receive a benefit. The largest group is those receiving a state pension (AOW). 2.360 people receive this benefit.
In Lindenholt there are 6.466 homes with an average assessed value (WOZ) of €320.000. Of these, around 97% are occupied and 3% unoccupied. Most homes are owner-occupied. This amounts to 39% rental homes and 61% owner-occupied homes. Of the homes, 61% privately owned, 33% owned by housing associations and 6% owned by other landlords. The most common construction periods in Lindenholt are 1980-1990 (54%) and 1990-2000 (15%).
There are currently no homes for sale in Lindenholt. The most recently listed home is Valkenaerhof 52 by ST Makelaars op Funda. No homes were sold in Lindenholt over the past year.
There are currently no homes for rent in Lindenholt. The most recent home is Hillekensacker 1408, offered by Hestia makelaars & taxateurs. No homes were let in Lindenholt over the past year.
No recent rental data available for Lindenholt.
In Lindenholt there are 4.237 addresses with a registered energy label. The most common labels are C (33%), A (32%) and B (22%). On average, an address in Lindenholt uses 2.570 kWh of electricity per year. This is 1% above the national average of 2.550 kWh. Natural gas consumption, at 810 m³ per year, is 1% above the national average of 800 m³.
?
Auto-translated to English by AIIt's a neighbourhood that everyone would want. There for each other. Keeping everything tidy. Togetherness. Friendship. Just. Very nice to live in.
Auto-translated to English by AIWe have a cosy neighbourhood where everyone is there for each other. Togetherness, friendships, conviviality. Doing and organising things together.
Auto-translated to English by AIWe try to do all sorts of things together. Lunch with neighbours, neighbourhood BBQ. Cosiness everywhere. Never want to leave here. Together with 4 men, I set up an activities committee and keep everything tidy.
Auto-translated to English by AIMy experience is that I really enjoy living here. Cosy and doing things together. Lunch with the neighbours once every 2 months. 15 people.
Auto-translated to English by AIOverall, the Kamp is perfectly fine, aside from a handful of incidents. I've lived here my whole life and have never felt unsafe—though I prefer not to walk through the Voorstenkamp unless necessary. I do notice that people don't greet each other as often when passing by. Perhaps that's due to my Brabant roots.
Auto-translated to English by AIIt is a nice neighbourhood to live in
Auto-translated to English by AIIs a nice quiet neighbourhood in my living area, lots of greenery around me.
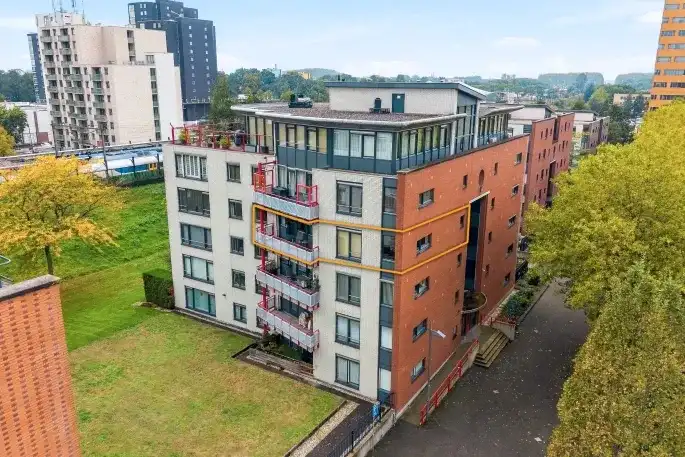
Auto-translated to English by AIThe housing stock is mainly post-war — 78% was built between 1945 and 1990. In addition, the most common type is terraced houses (48%).
Over the past year a home for sale in Lindenholt was listed for an average of €430,378 (€3,674 per m²). That is 19% below the Dutch national average.
Residents give Lindenholt a 8.5 out of 10 based on 8 reviews. Accessibility stands out with a 9.4; cleanliness lags behind with a 7.6.
Wijk Lindenholt has 14,530 residents. Many families: 35% of the households have children.
The housing supply in Lindenholt is remarkably efficient: 60% has an A, A+ or B label. The average natural gas consumption per household is 810 m³ per year.
From Lindenholt you can on average reach a supermarket at 0.7 km, a GP at 1.0 km, a railway station at 2.2 km, a primary school at 0.8 km (as the crow flies, source: CBS).
Right now you will find 41 homes for sale and 2 homes for rent in Lindenholt.