District in Eindhoven
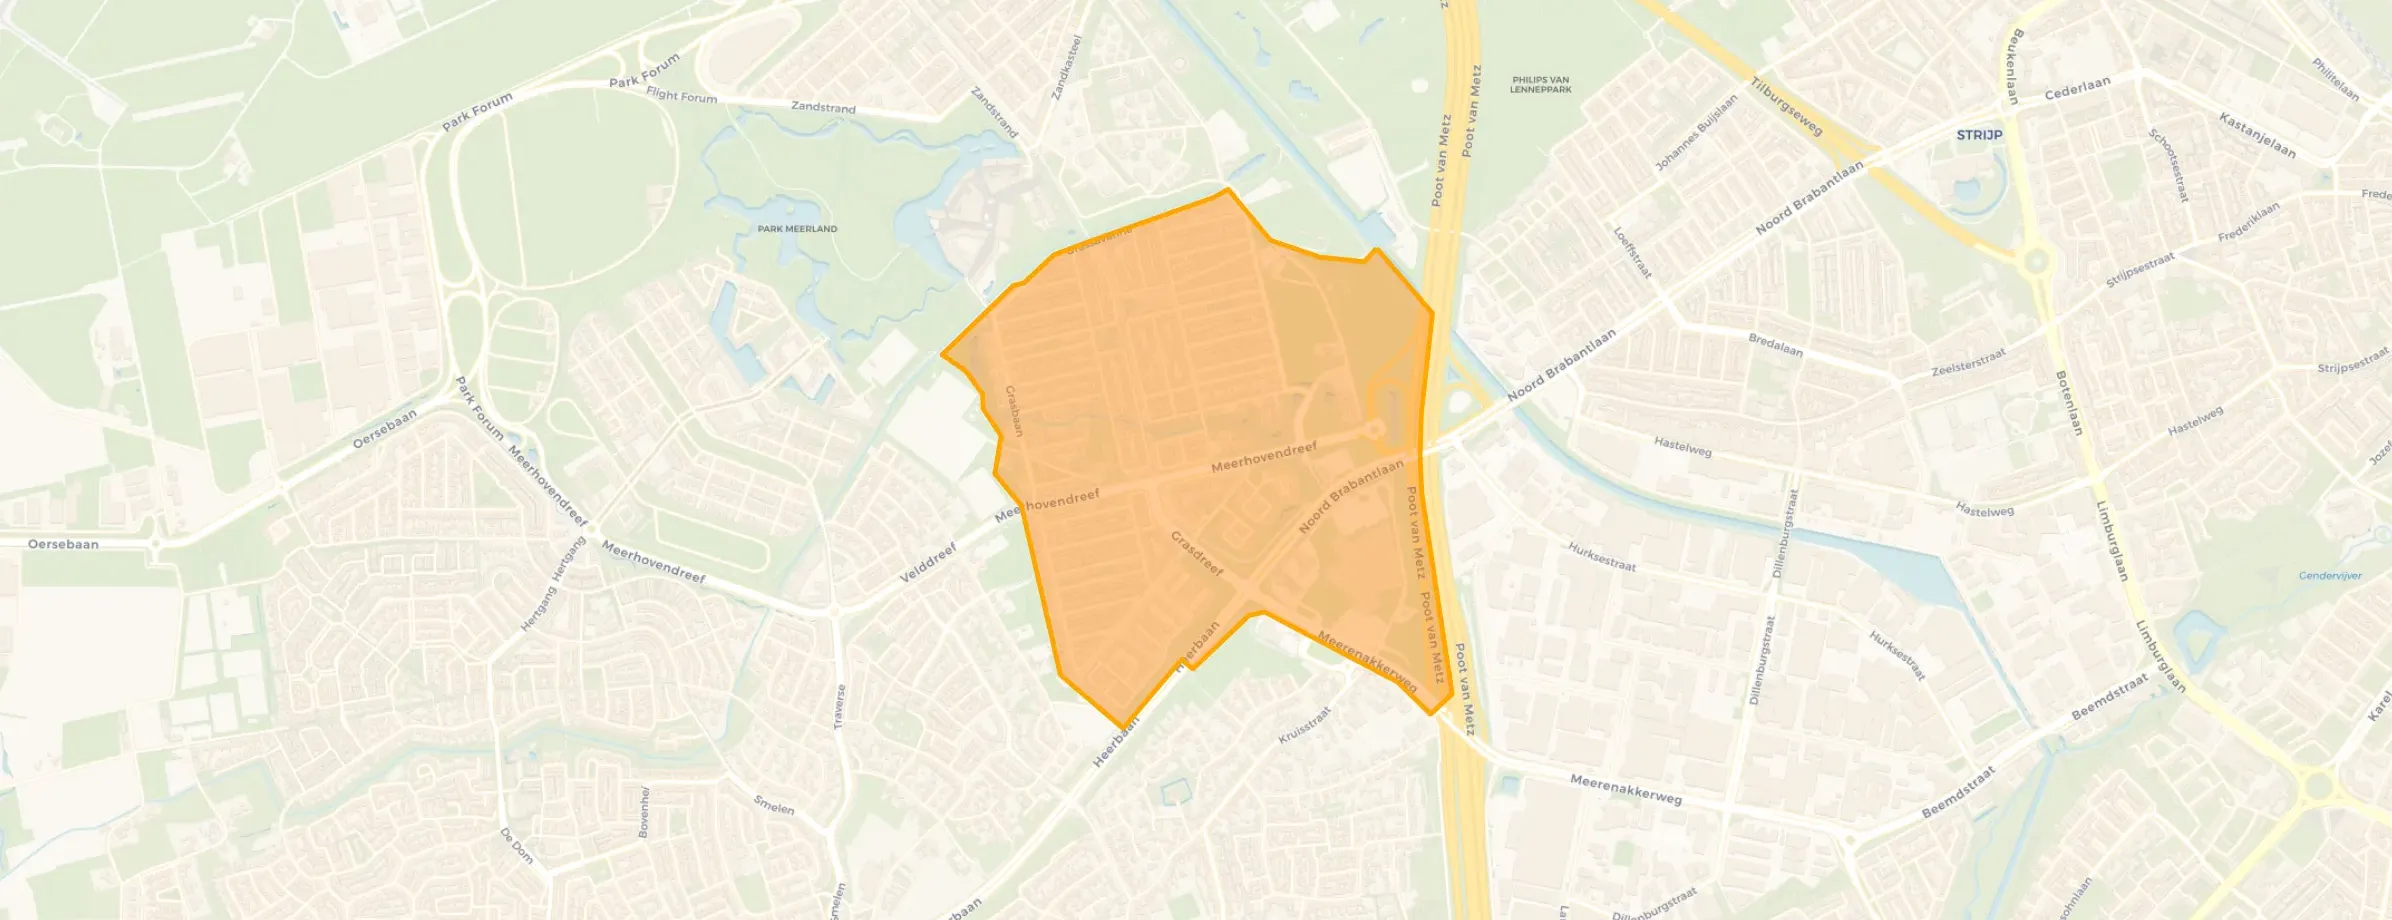
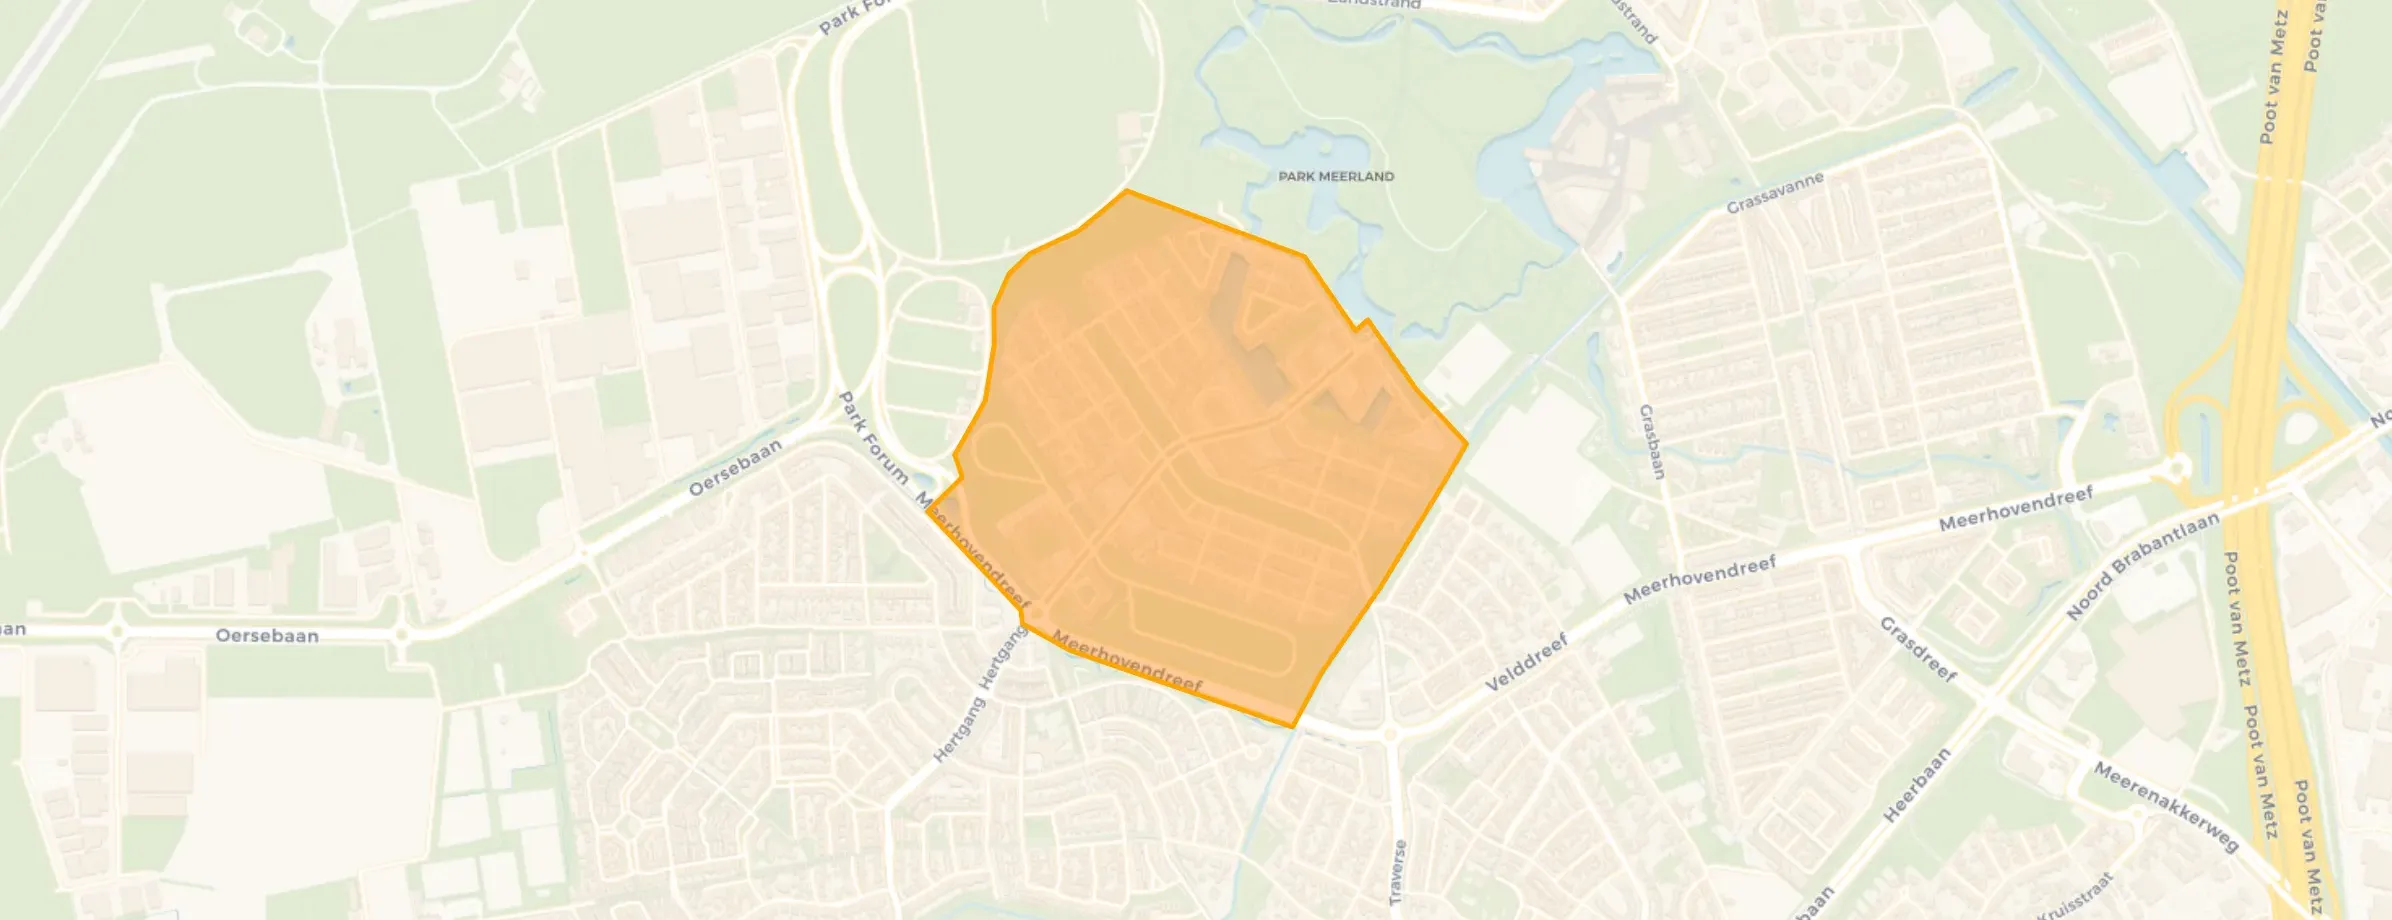
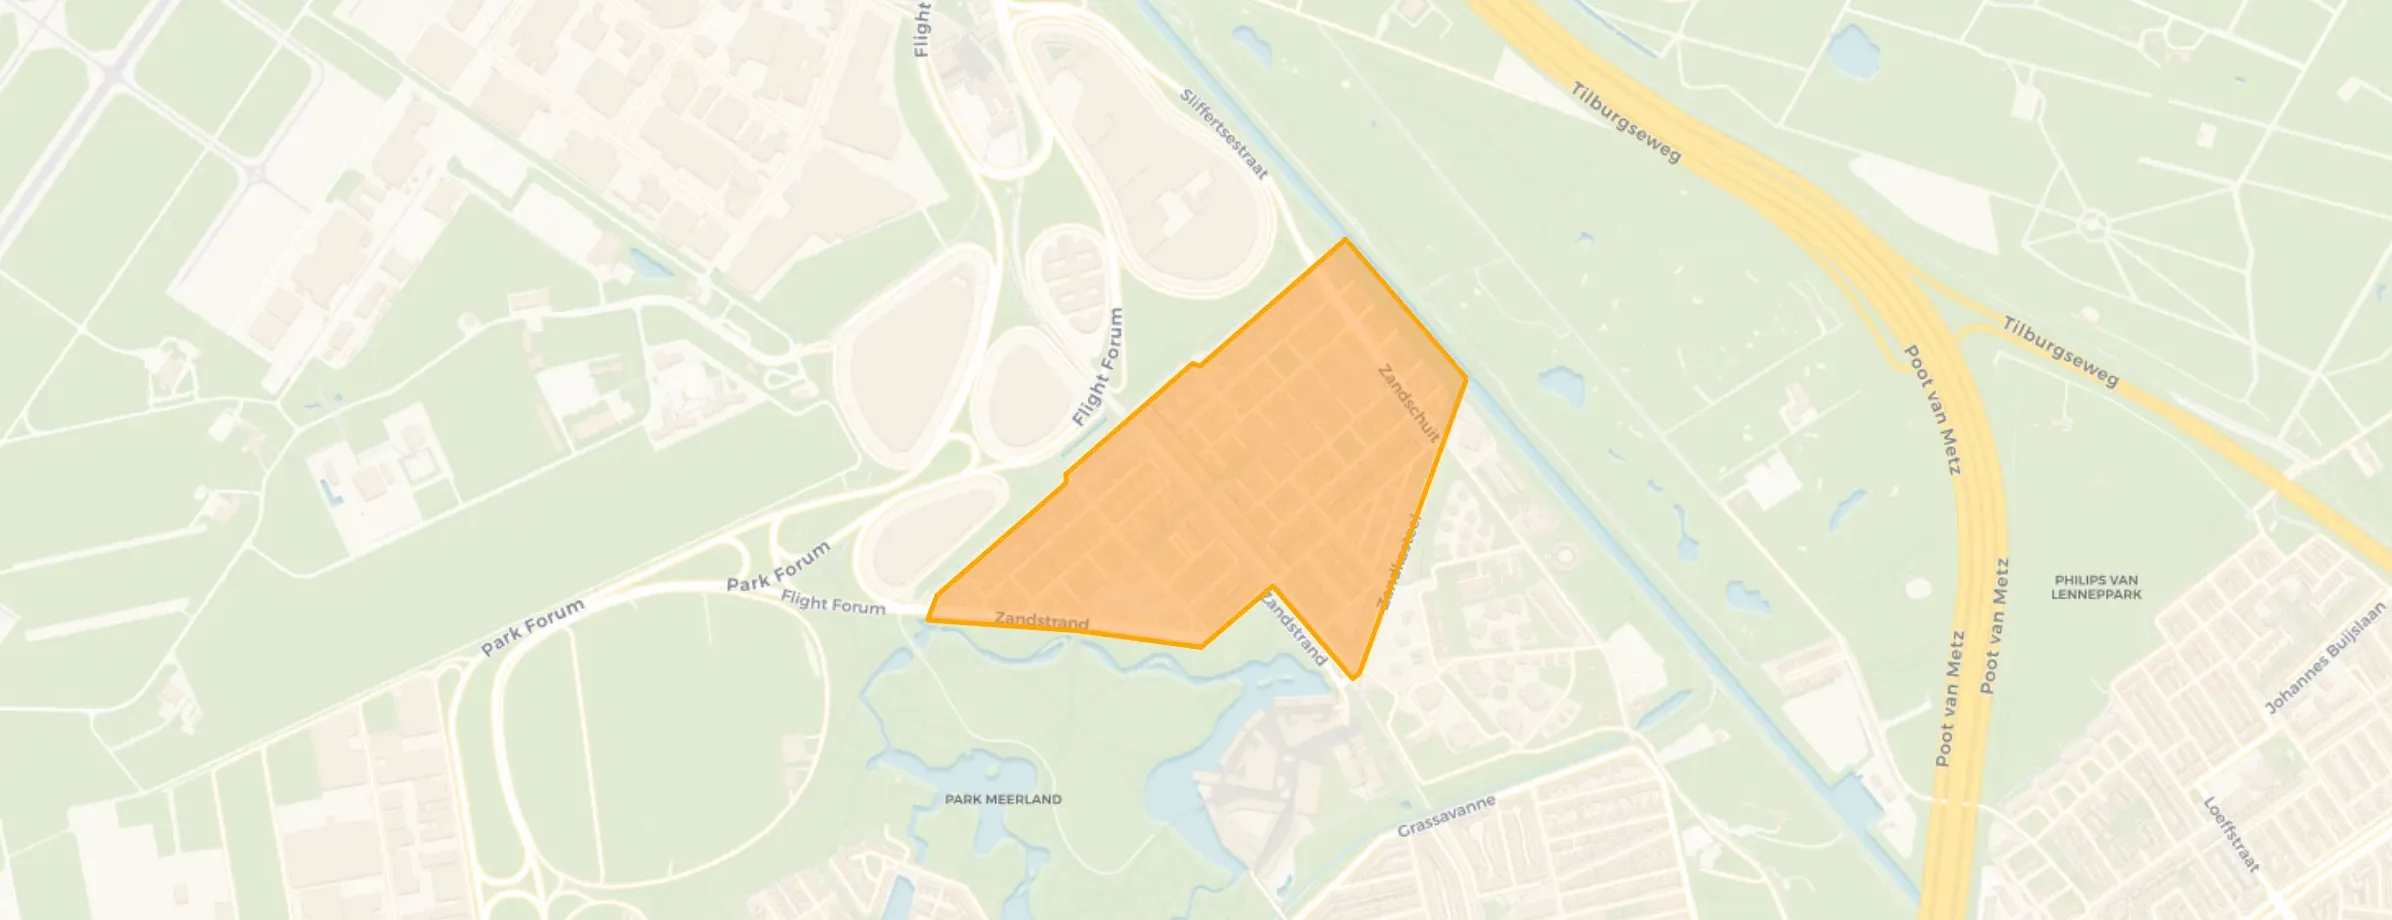
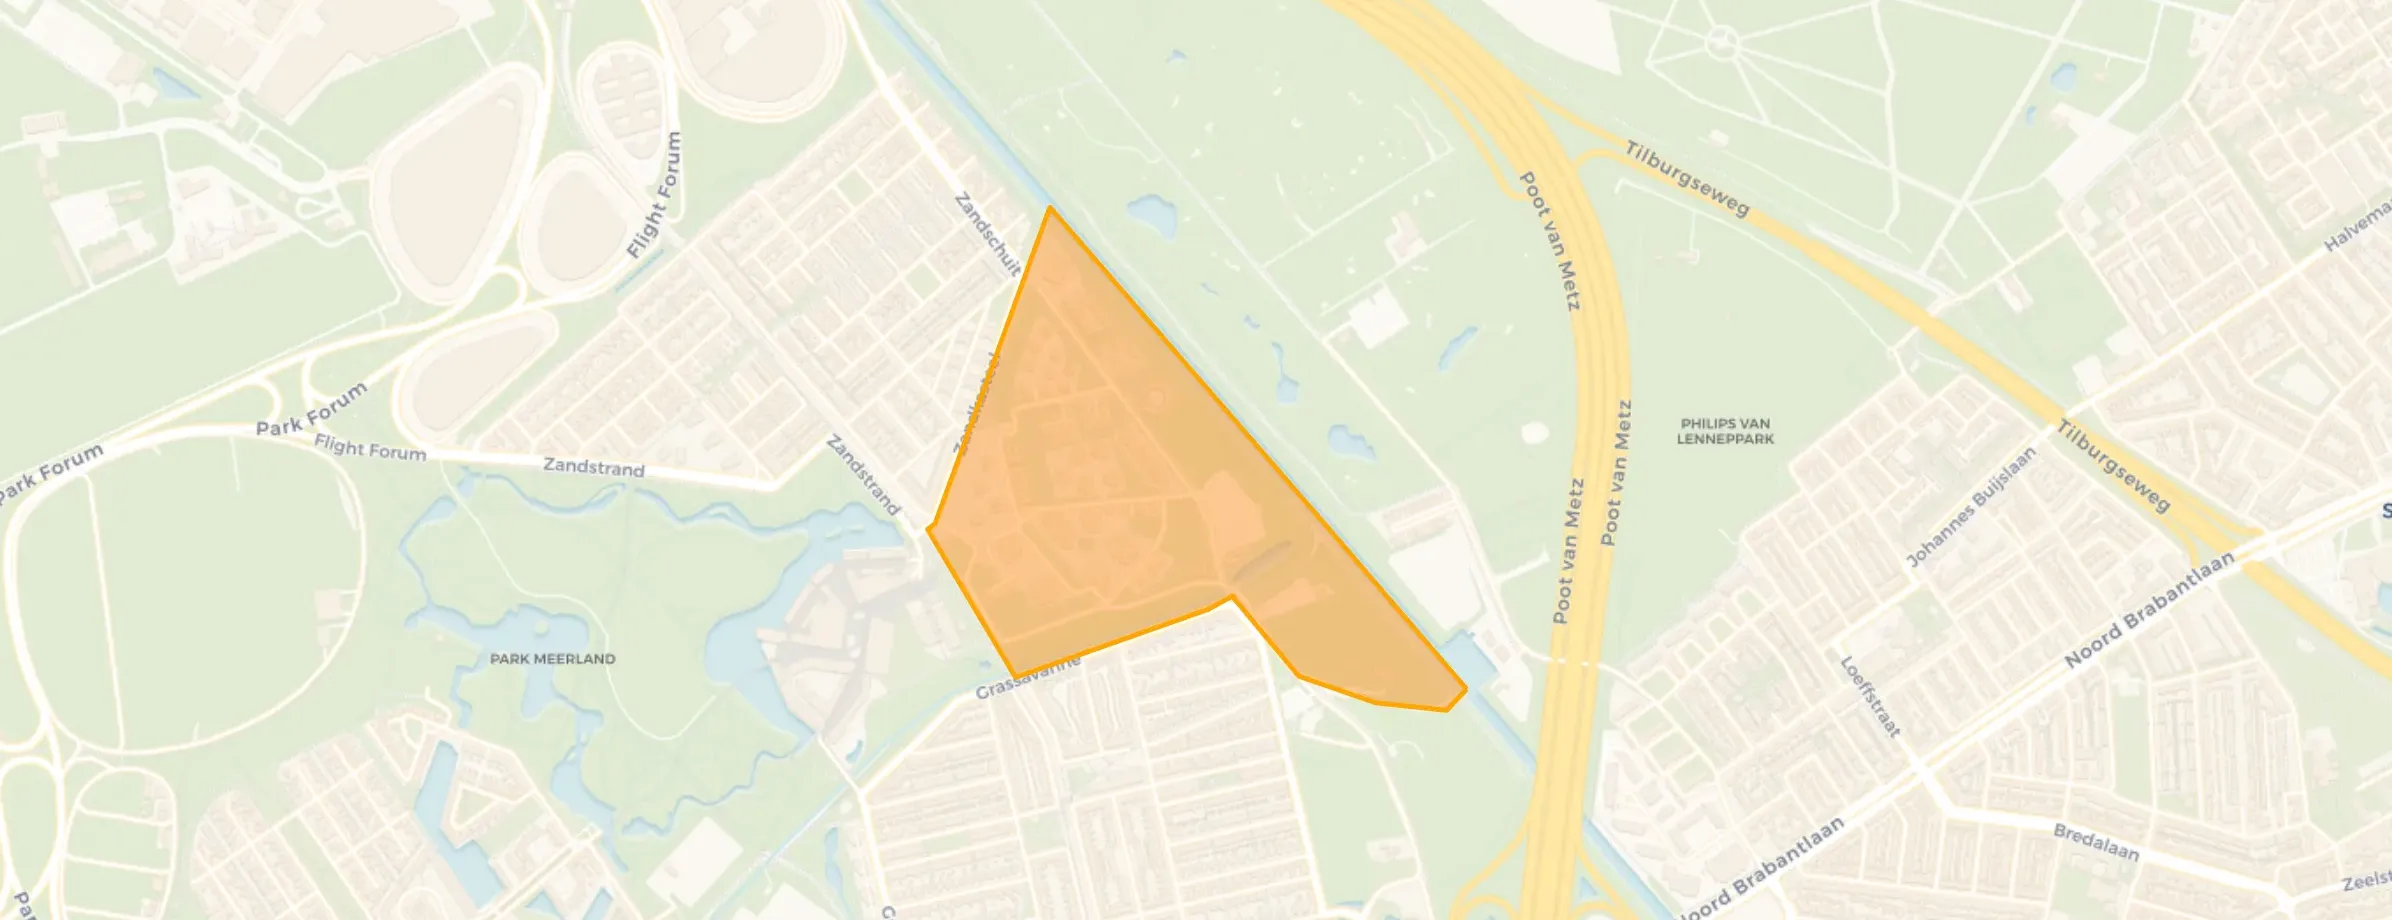
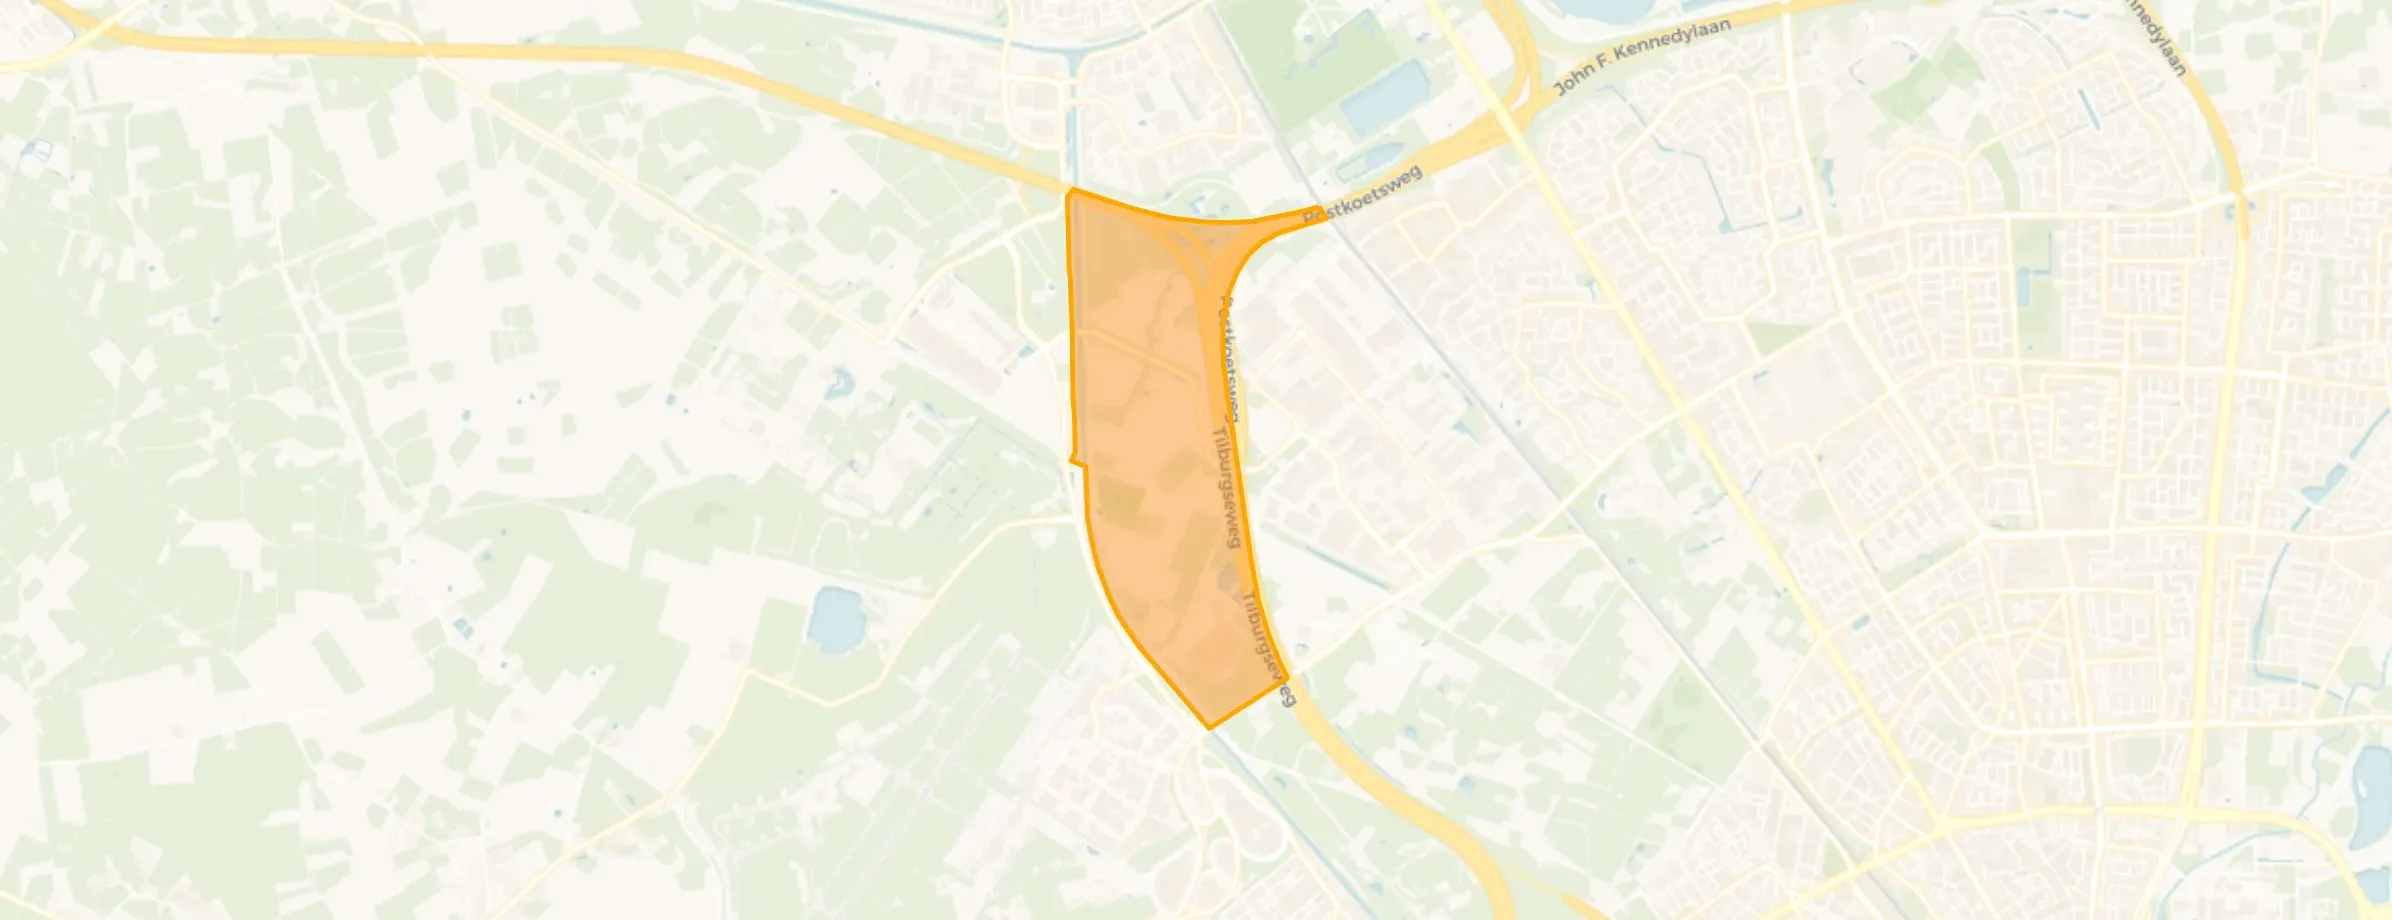
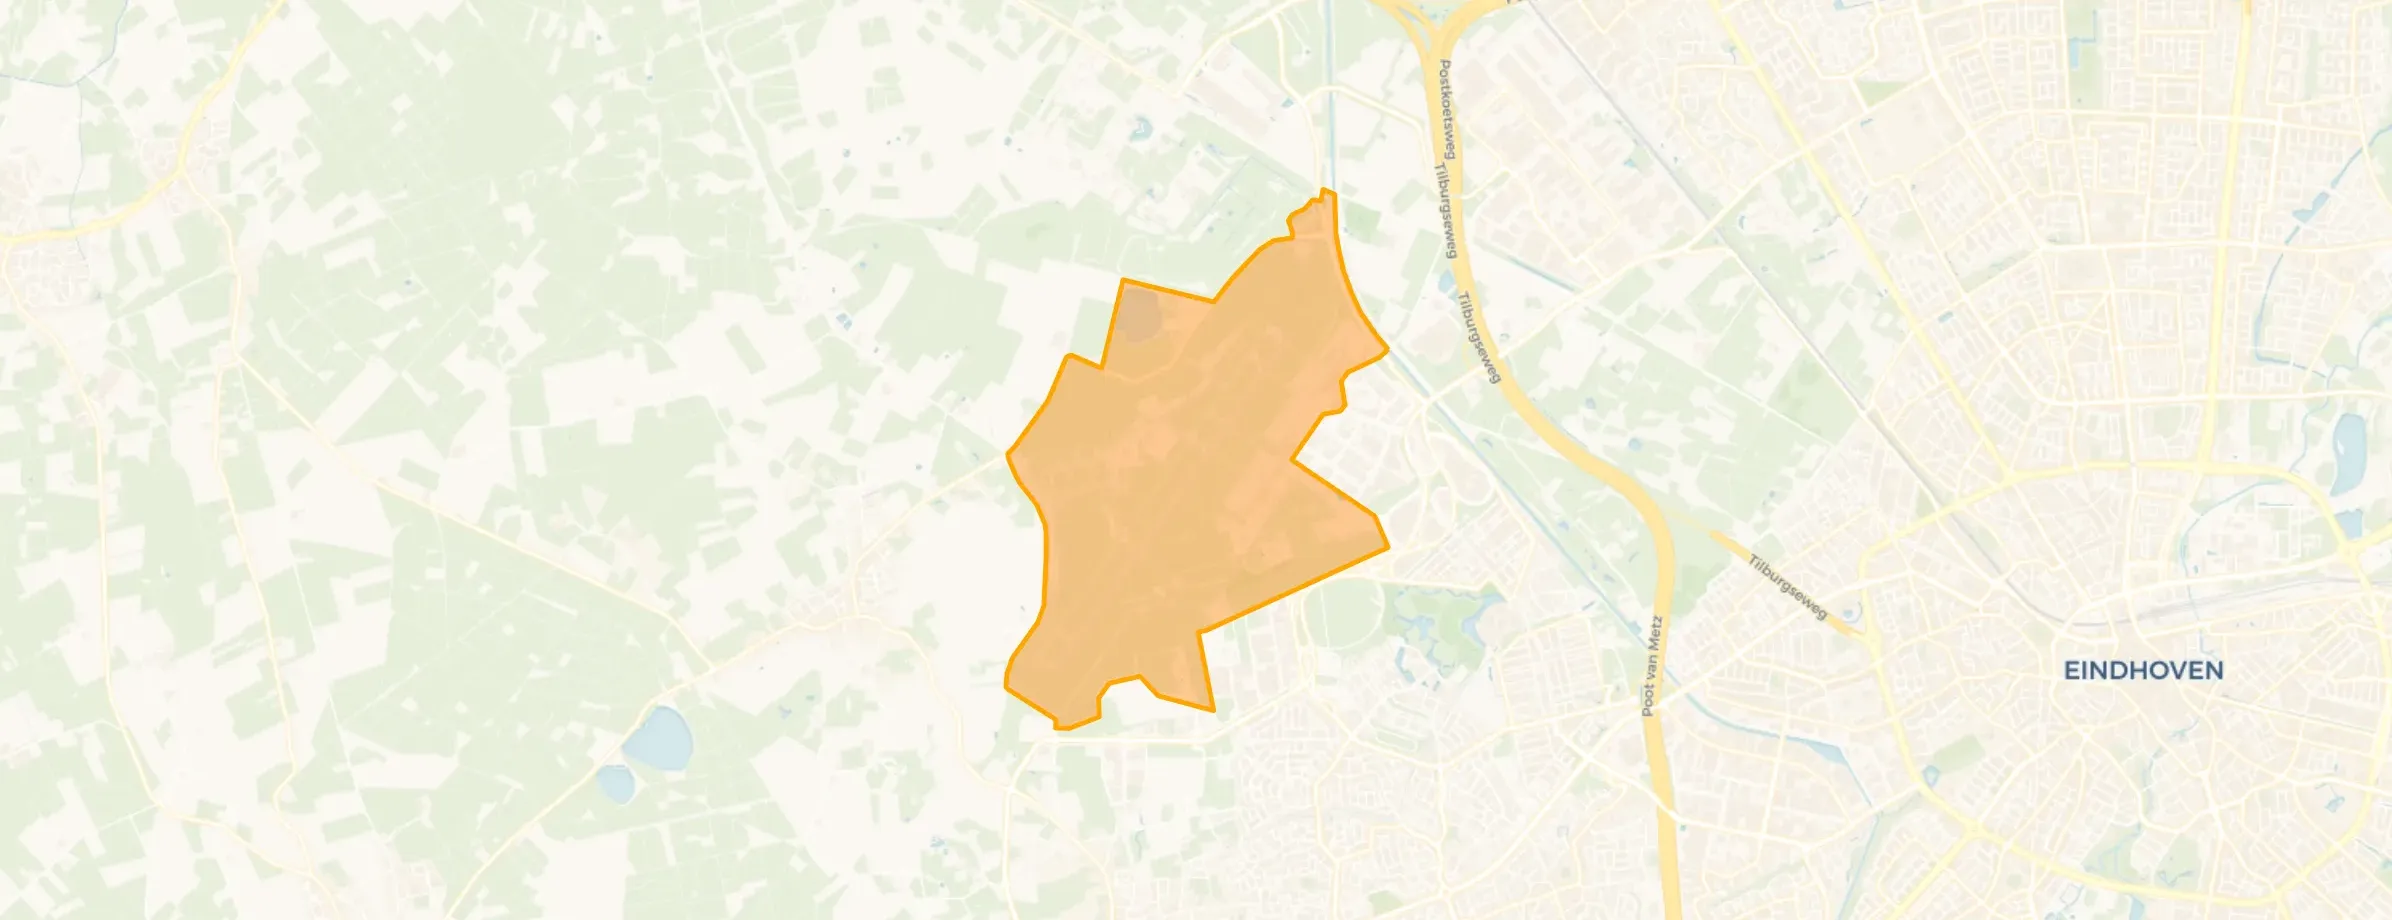
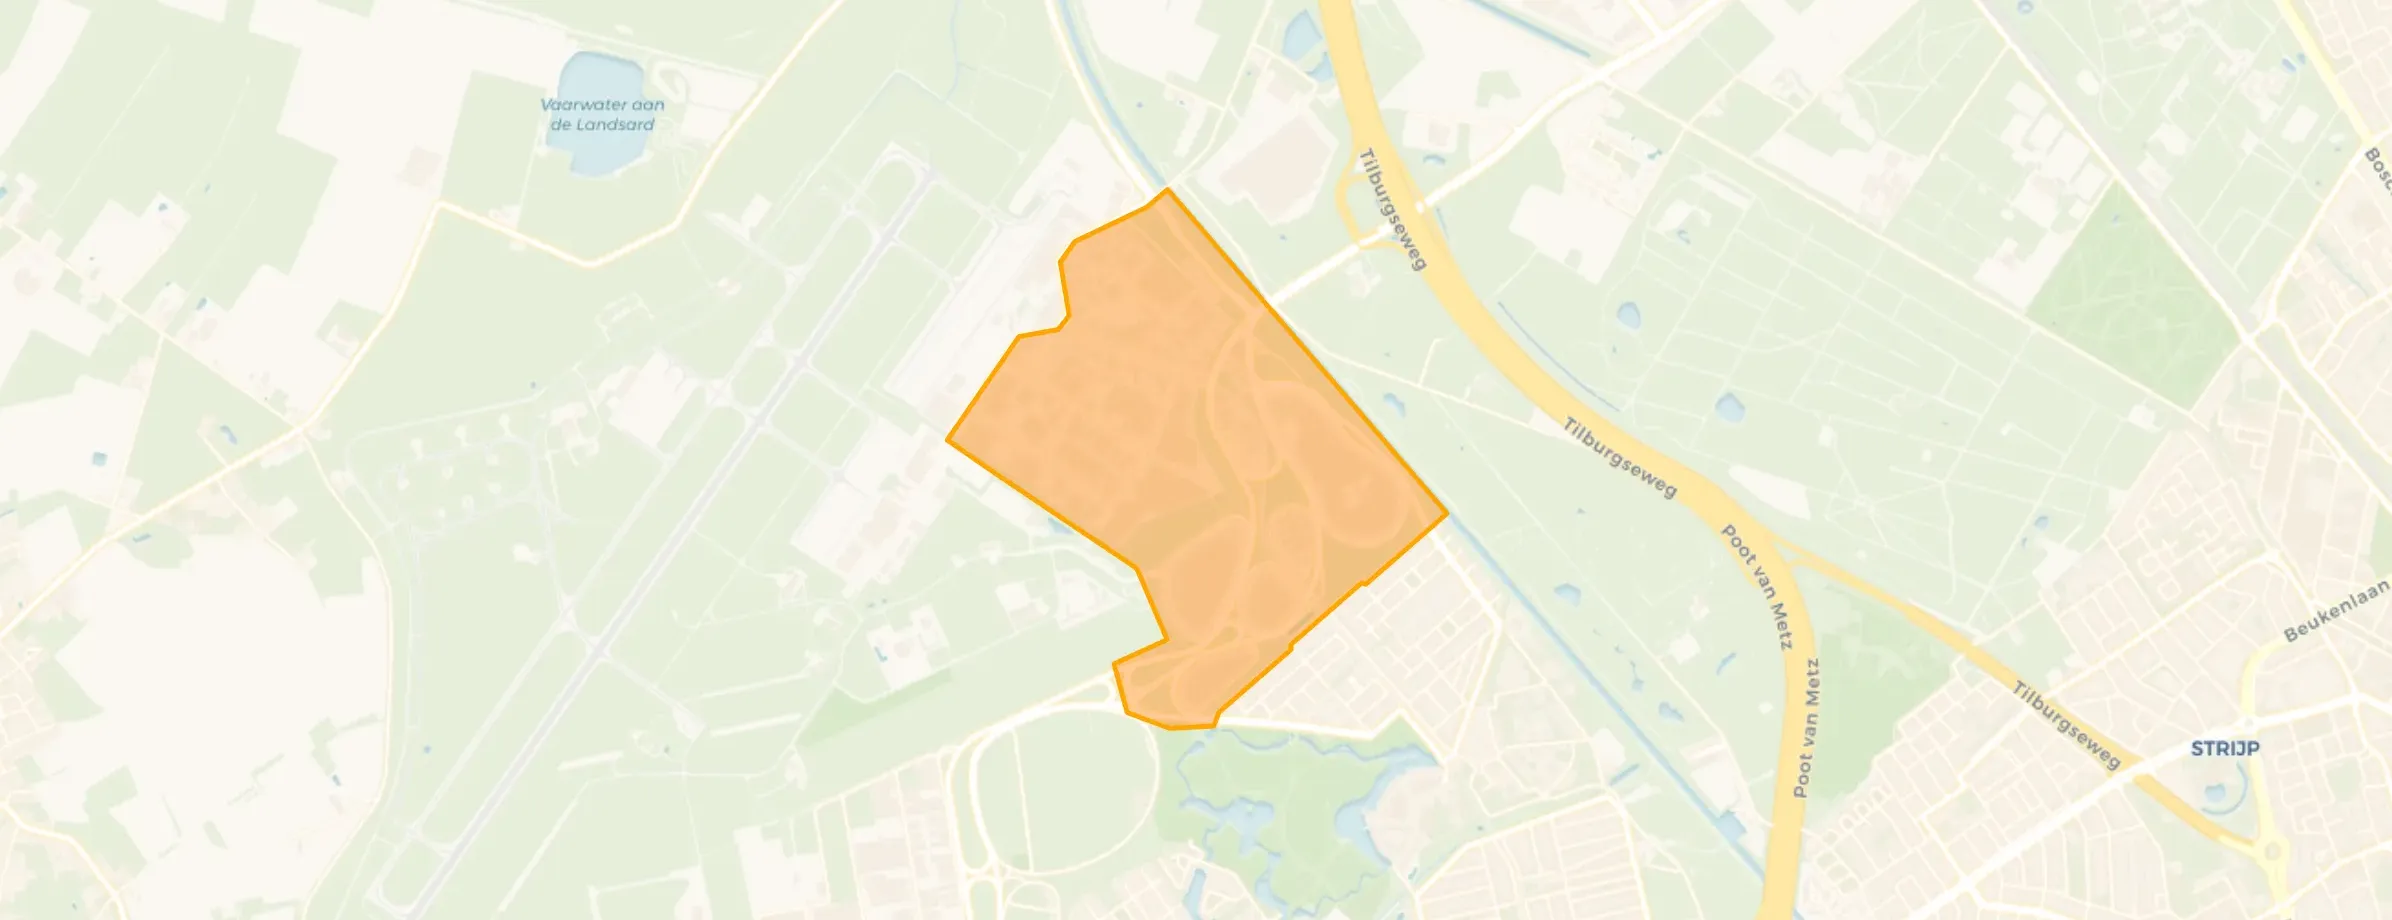
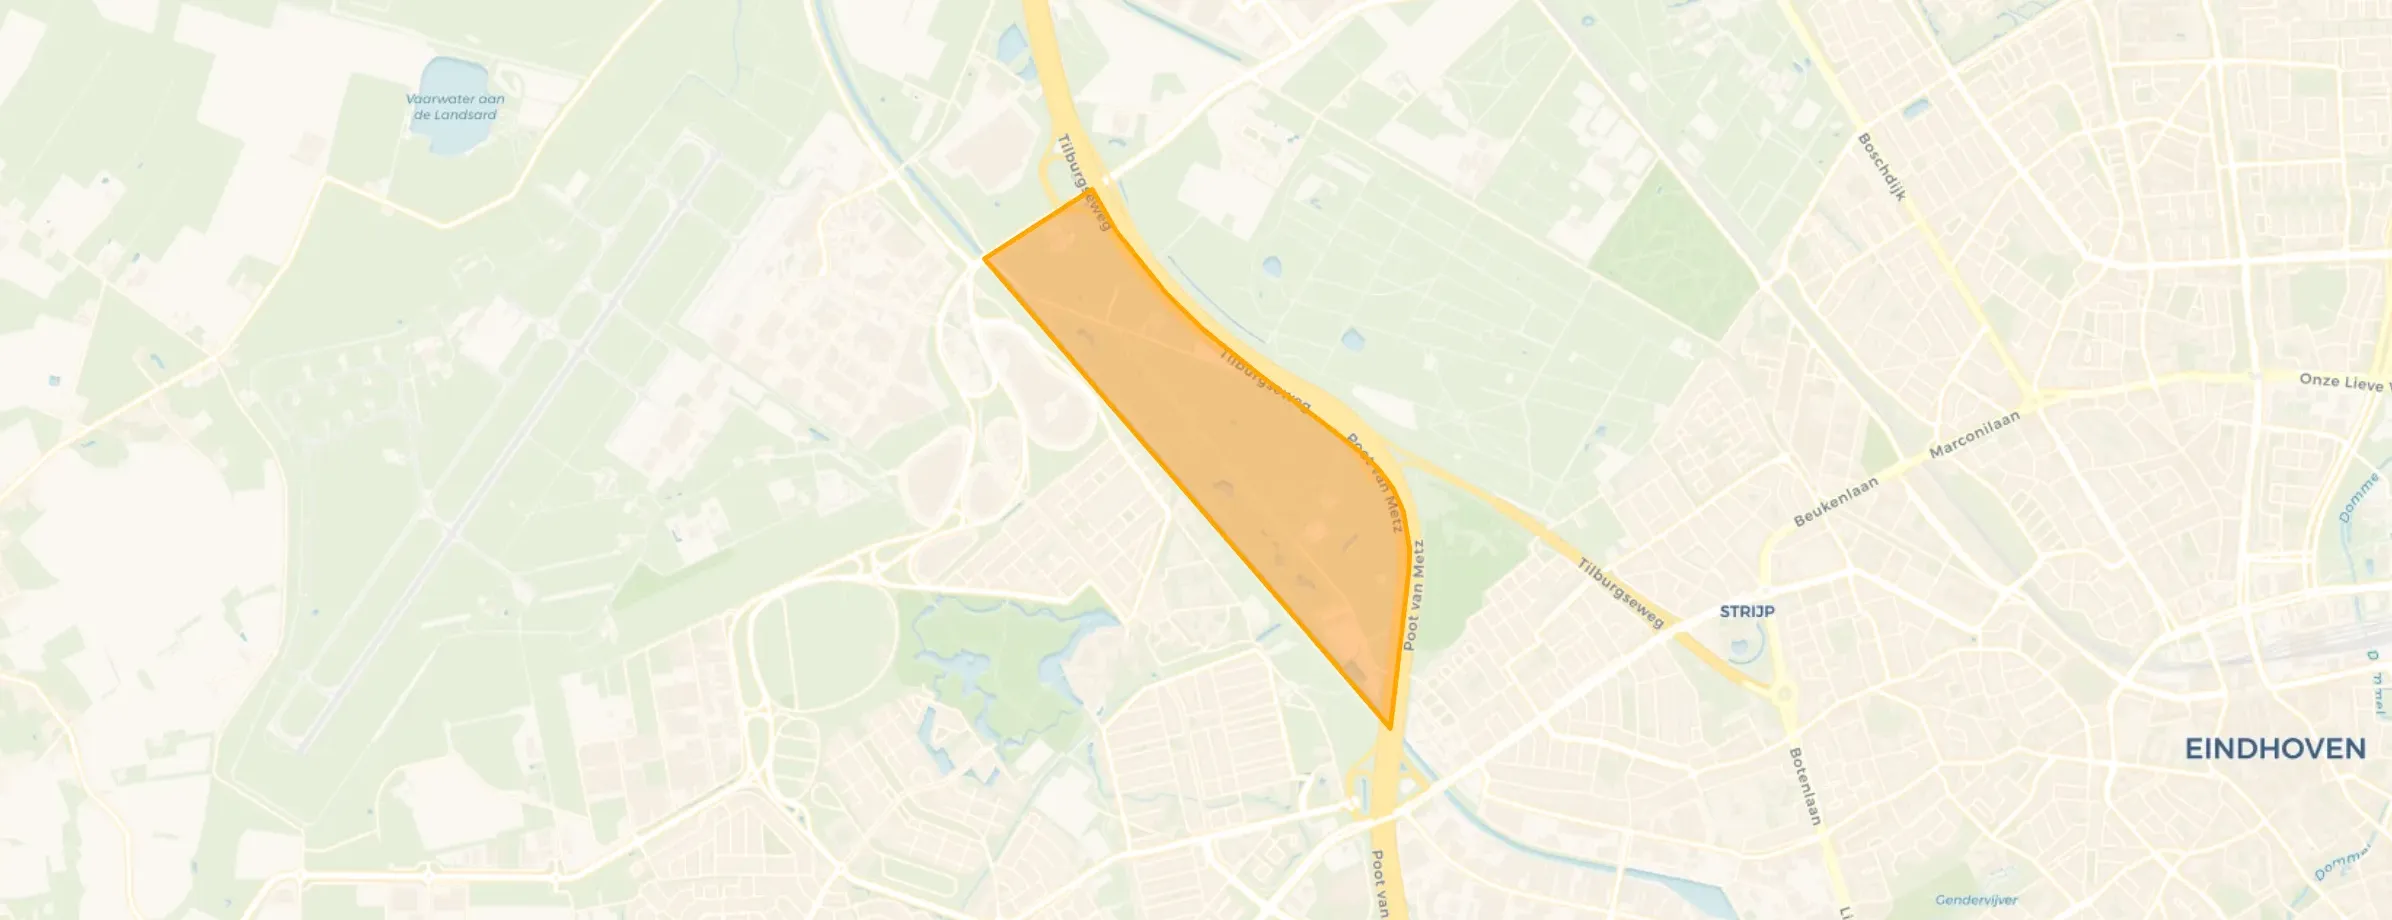
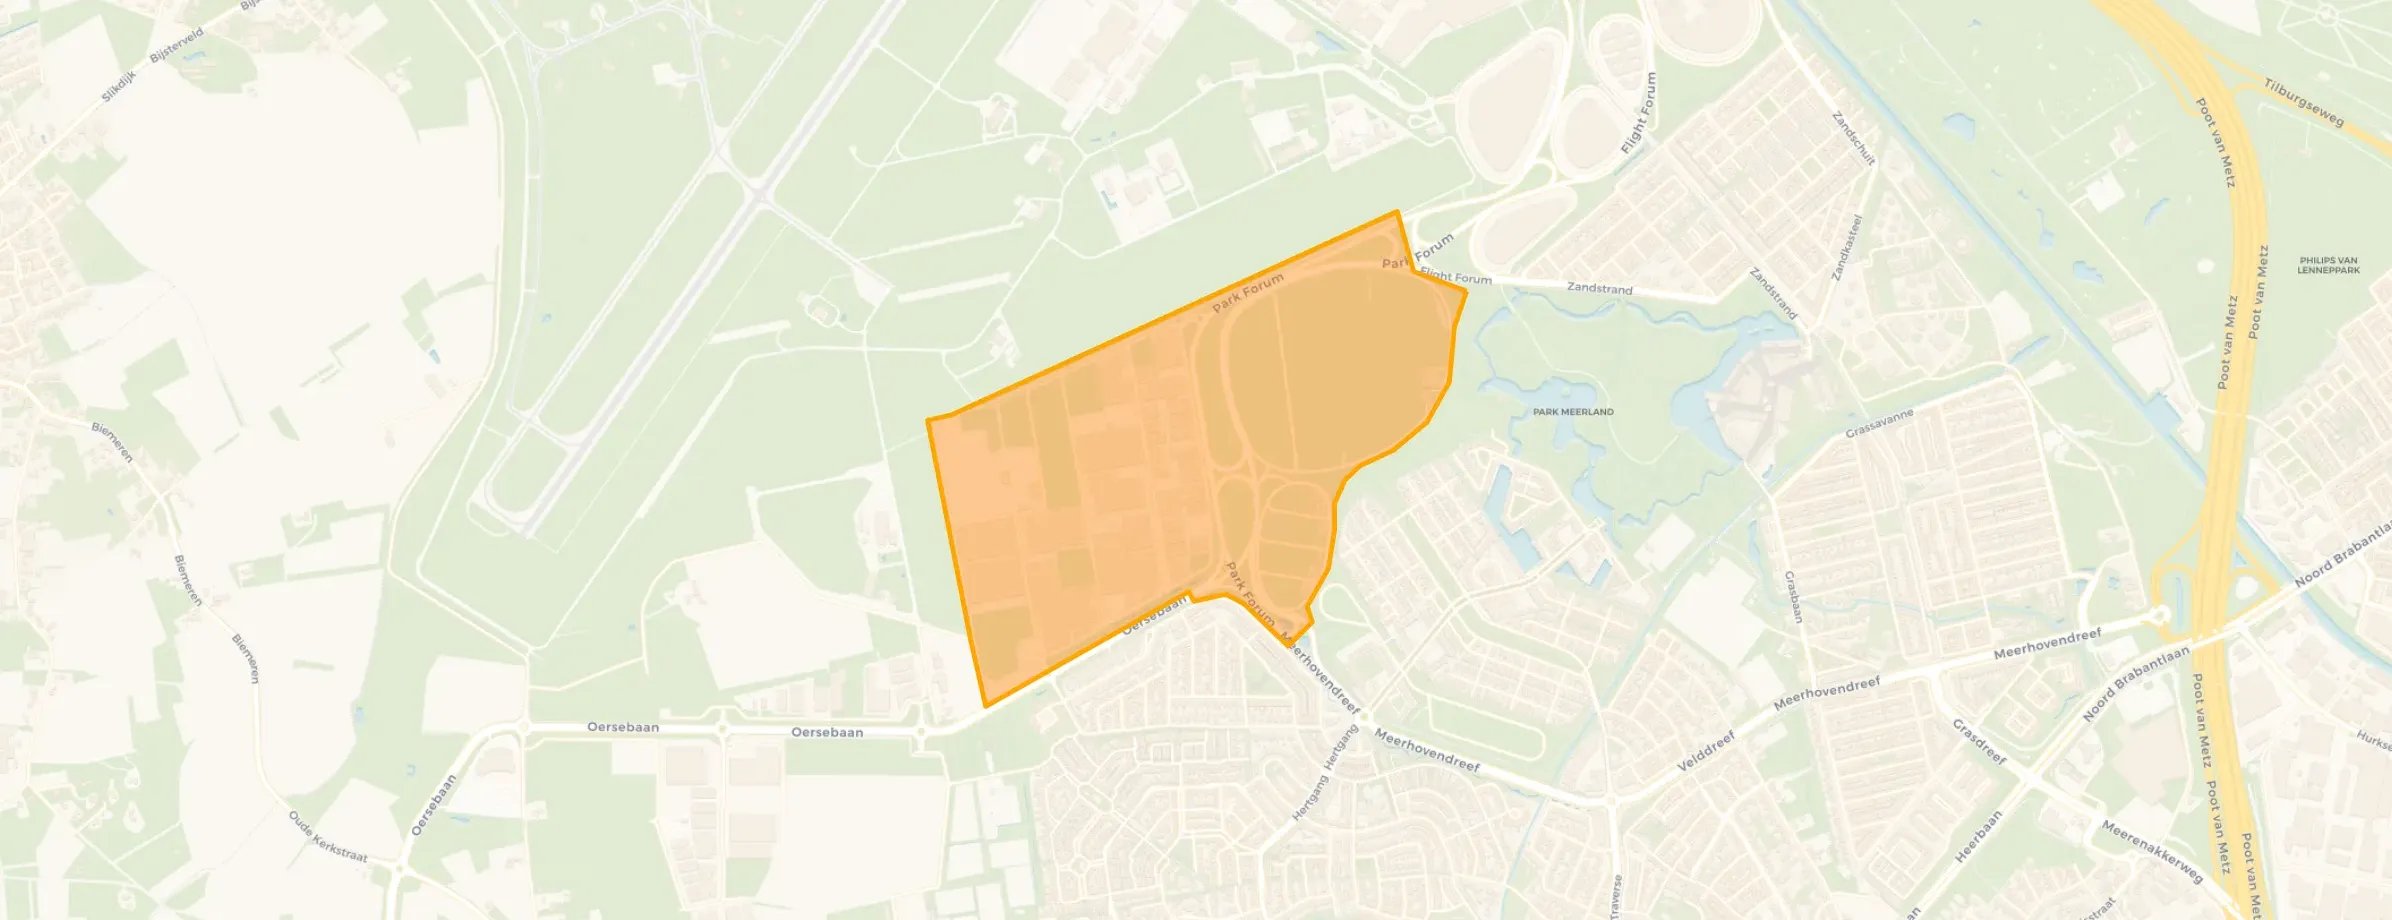
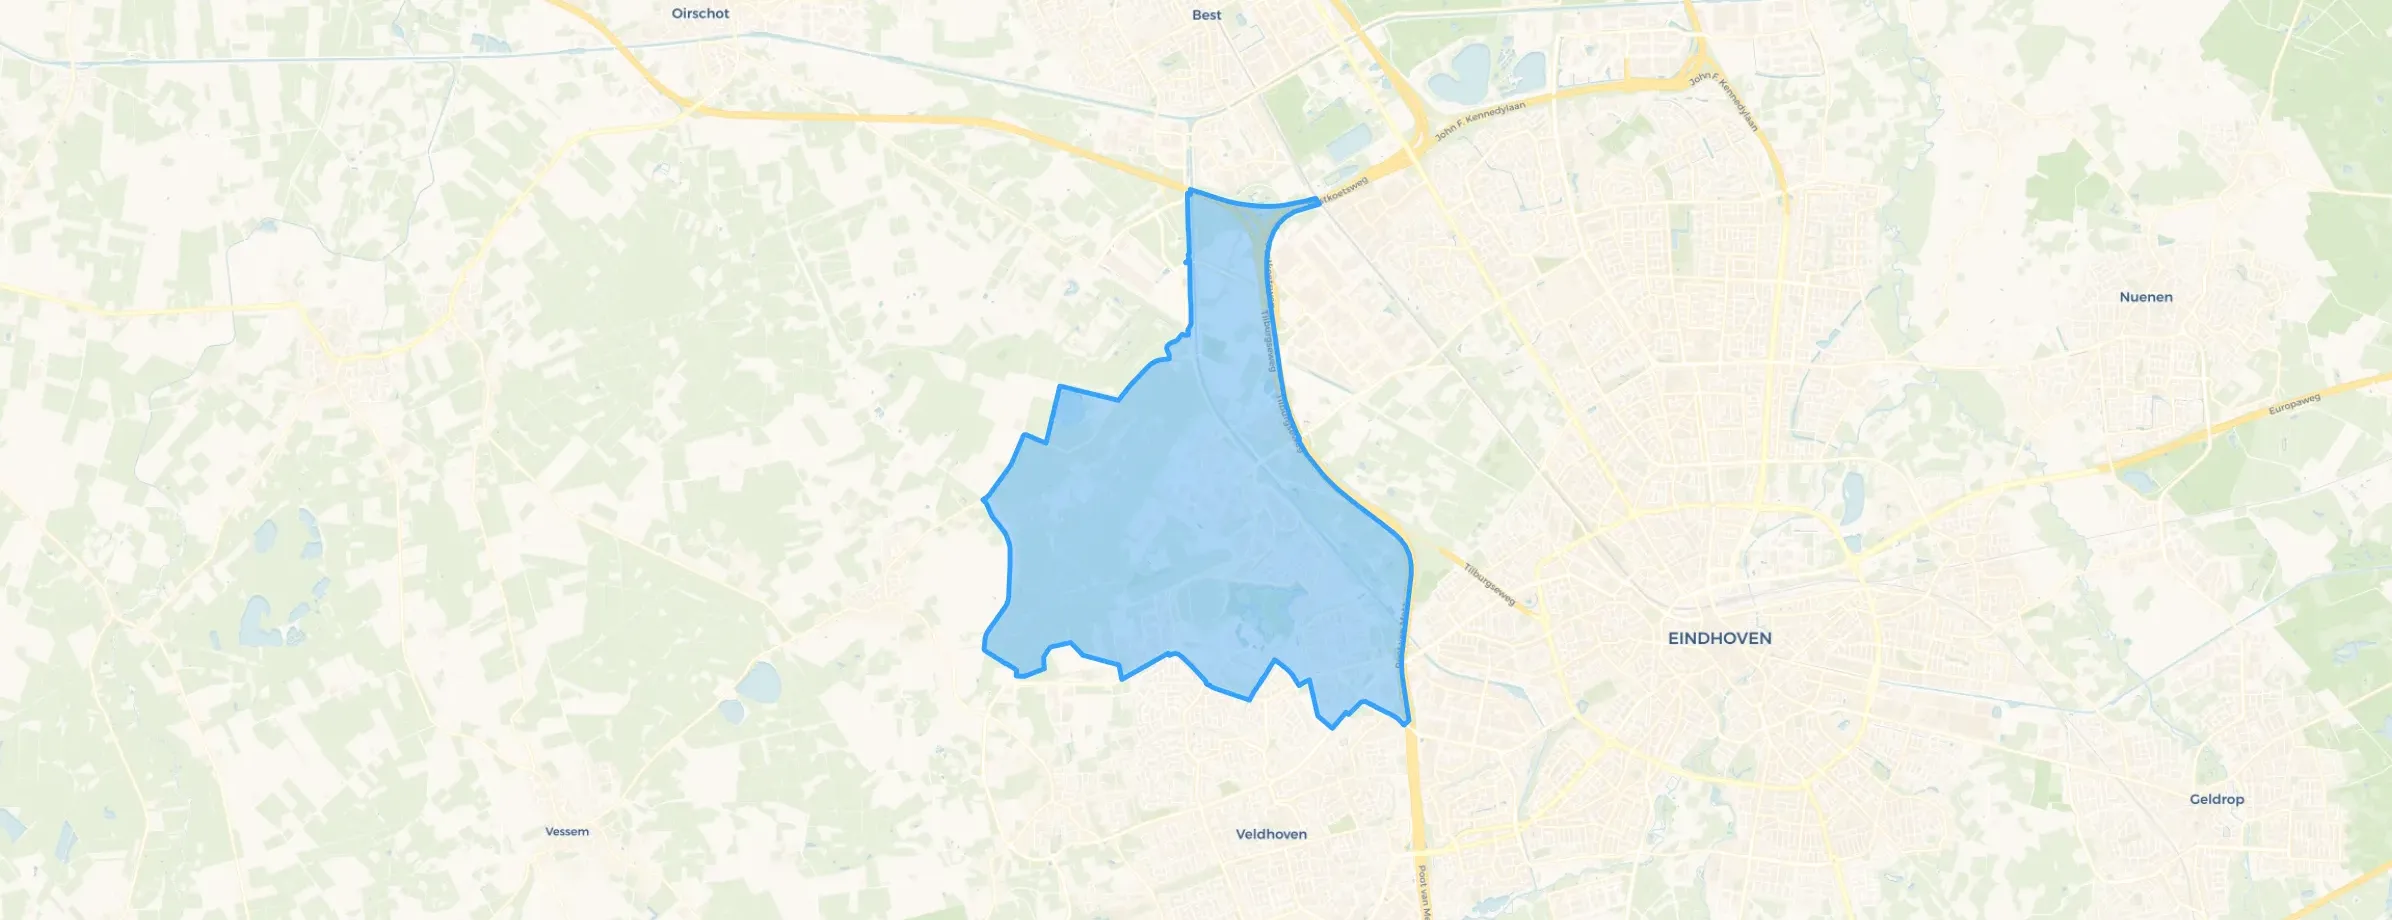
Meerhoven is located in the province of Noord-Brabant, in the municipality of Eindhoven The district has a total area of 1.587 hectares, of which 1.552 hectares are land and 34 hectares are water. The district is coded as WK077263. The postcode area is 5657AA-5658SR.
Meerhoven has 13.635 residents. Of these, 51,9% are men and 48,1% are women. Most residents are 25 to 45 years (31,4%). The other age groups are 26,0% for '45 to 65 years', 20,4% for '0 to 15 years', 11,7% for '15 to 25 years' and 10,7% for '65 years or older'. Of the residents, 49,0% is unmarried, 44,3% is married, 4,7% is divorced and 2,1% is widowed. 6.430 residents originate from the Netherlands, 1.780 come from Europe and 5.425 come from countries outside Europe.
There are 5.435 households in Meerhoven. 26,7% of these are single-person households, 27,6% households without children and 45,7% households with children. The average household size is 2,5 persons. The national average is 2,1 persons.
In Meerhoven there are 9.900 income recipients. The average income per income recipient is €58.900, which is €16.700 (40%) higher than the national average of €42.200. Per resident, the average income is €44.600, which is €9.700 (28%) higher than the national average of €34.900. Most residents of Meerhoven are highly educated. 51,7% have a university or higher professional education (HBO/WO), 25,9% have an intermediate education (HAVO, VWO or MBO 2-4) and 22,4% have a lower education (VMBO or MBO 1).
Of the 13.635 residents, around 78% are in paid employment, which amounts to 10.635 people. This is 6% higher than the national average of 72%. The majority of workers are in salaried employment (89%), while 11% are self-employed. In Meerhoven, 13% of residents receive a benefit. The largest group is those receiving a state pension (AOW). 1.290 people receive this benefit.
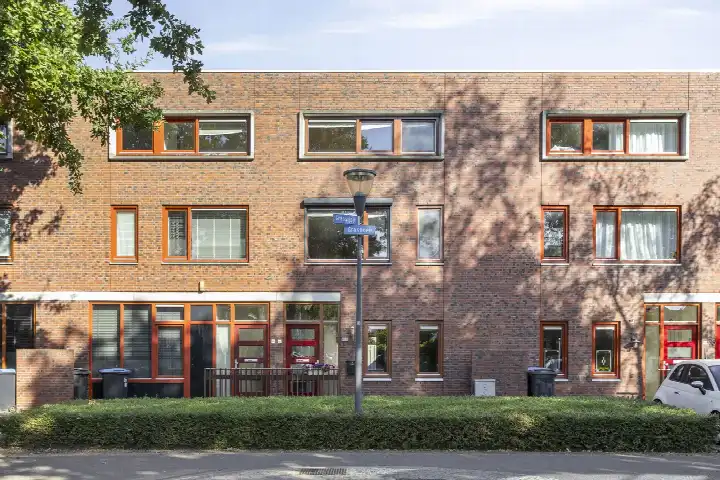
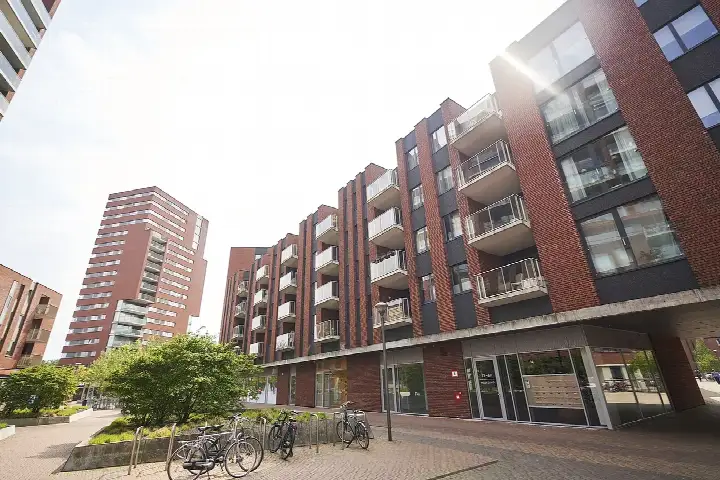
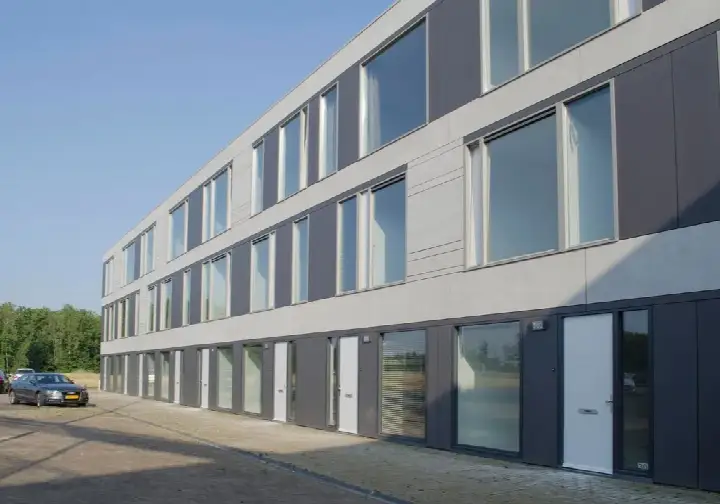
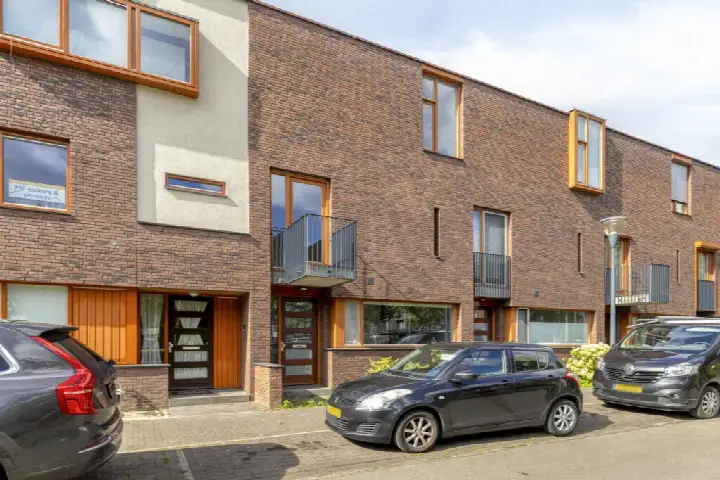
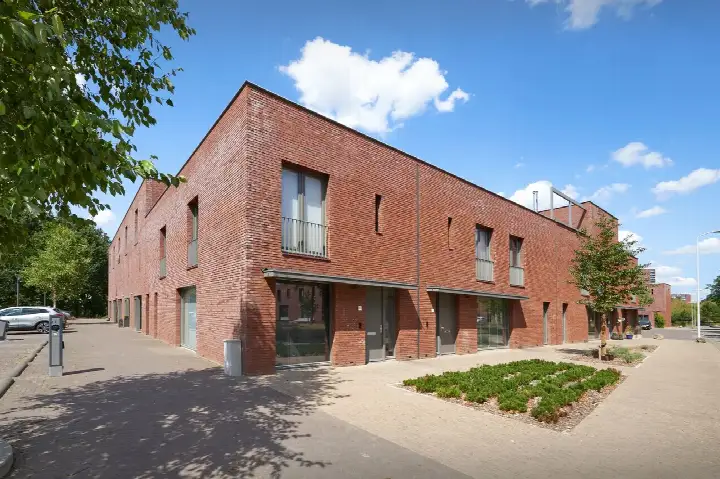
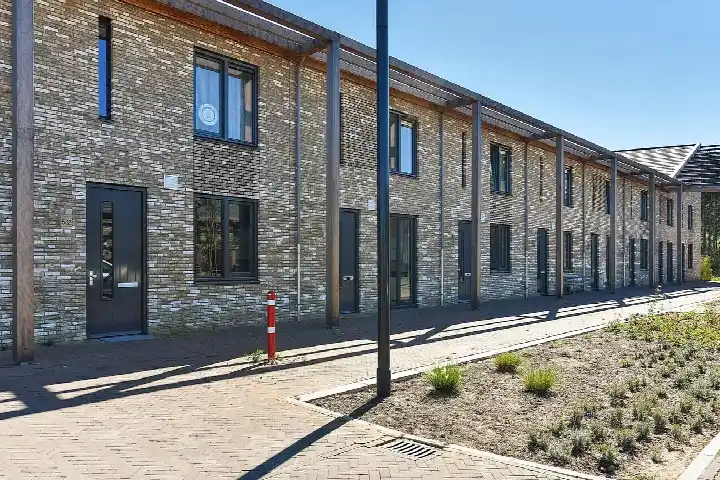
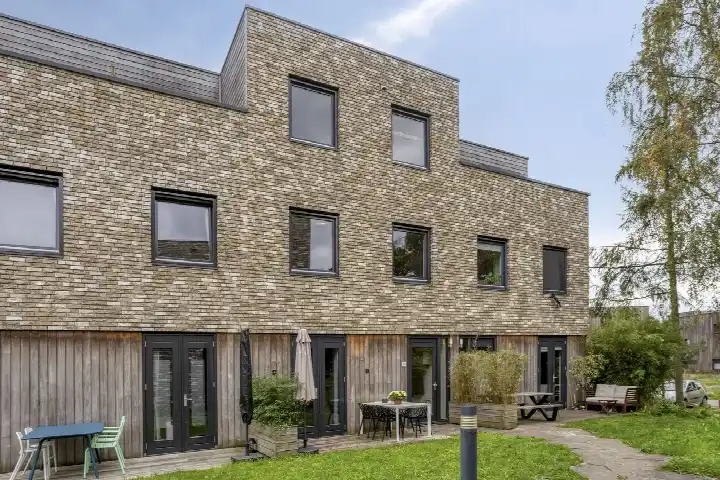
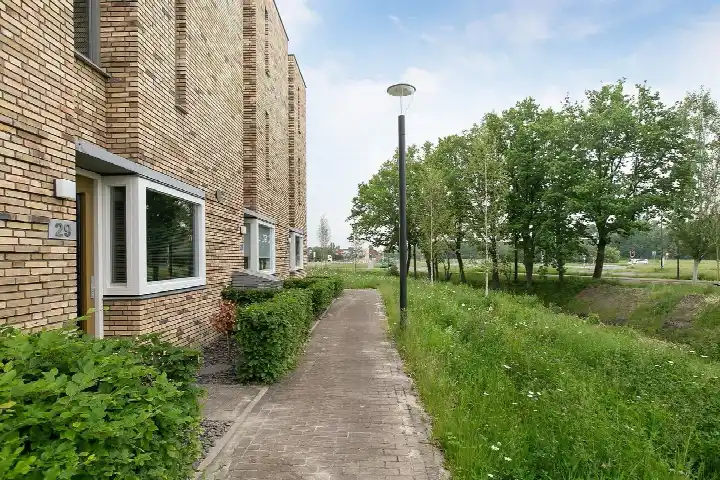
In Meerhoven there are 5.325 homes with an average assessed value (WOZ) of €533.000. Of these, around 97% are occupied and 3% unoccupied. Most homes are owner-occupied. This amounts to 28% rental homes and 72% owner-occupied homes. Of the homes, 73% privately owned, 14% owned by housing associations and 13% owned by other landlords. The most common construction periods in Meerhoven are 2000-2010 (57%) and 2010-2020 (25%).
There are currently no homes for sale in Meerhoven. The most recently listed home is Grashoen 82 by Zicht Op Wonen op Funda. No homes were sold in Meerhoven over the past year.
There are currently no homes for rent in Meerhoven. The most recent home is Meerzand 57, offered by vb&t Verhuurmakelaars. No homes were let in Meerhoven over the past year.
No recent rental data available for Meerhoven.
In Meerhoven there are 4.137 addresses with a registered energy label. The most common labels are A (70%), A+ (12%) and A++ (8%). On average, an address in Meerhoven uses 2.920 kWh of electricity per year. This is 15% above the national average of 2.550 kWh. With an annual consumption of 120 m³ per address, natural gas consumption is 85% below the national average of 800 m³.
It's a beautiful, quiet, clean and spacious neighbourhood. I experience the area as safe and child-friendly. In terms of noise, it's pleasantly quiet: you hardly hear any planes, at most occasionally a military helicopter during the day. There are good schools and the neighbourhood is very international, with a nice mix of locals and knowledge migrants. This is also due to its favourable location relative to the High Tech Campus, the ASML campus and ISE. Accessibility is good, with several bus lines (401, 402, 403 and 20) and fast arterial roads towards the centre and Best. In the centre of Meerhoven there are three supermarkets (Lidl, Albert Heijn and Jumbo), a GP, dentists and childcare. By bike you can reach Strijp-S in about 10 minutes and the centre of Eindhoven in 15 to 20 minutes. In addition, there is a lot of greenery, with beautiful walking routes along the golf course and through Park Meerland. A downside is that it's not very lively: there are few activities and hardly any catering facilities. All in all, I think it's one of the better neighbourhoods in Eindhoven. The centre is easily accessible by bike and it's a good choice if you want to live quietly, without being too far from the city. If you're looking for a cosy, lively neighbourhood with lots of nightlife, Meerhoven is probably less suitable.
Auto-translated to English by AII have lived here myself for 16 years and have never had any trouble with anyone. You live in a quiet area with friendly people and a fair amount of greenery around you. It is also ideal for children because of all the playgrounds and parks in the area. All amenities such as shops, hairdressers and restaurants are within walking distance, which makes Zandrijk the ideal neighbourhood to live in.
Auto-translated to English by AIA pleasant, friendly and fun neighbourhood to live in, lots of space and greenery. Everything within reach, shops, schools, park, terraces and cycling distance from the city.
Auto-translated to English by AIA nice neighbourhood, friendly people, neighbourhood with many children. Multicultural neighbourhood, little nuisance.
Auto-translated to English by AILuckily I look out onto the water and live on a nice street with attentive neighbours, we help each other. People could however maintain their street better and put bikes in the shed instead of by the door.
Auto-translated to English by AIZandrijk is a modern neighbourhood with a lot of what you could want... it is a safe environment for the elderly, families and children alike. There are plenty of dining, travel & other amenities for people. Nearby you have a shopping centre and 2 bus stops that go directly to the city centre and the airport.
Auto-translated to English by AIThe neighbourhood has been going downhill for a few years. Things are being stolen and property vandalised. The Voorstraat is not being maintained well or at all.
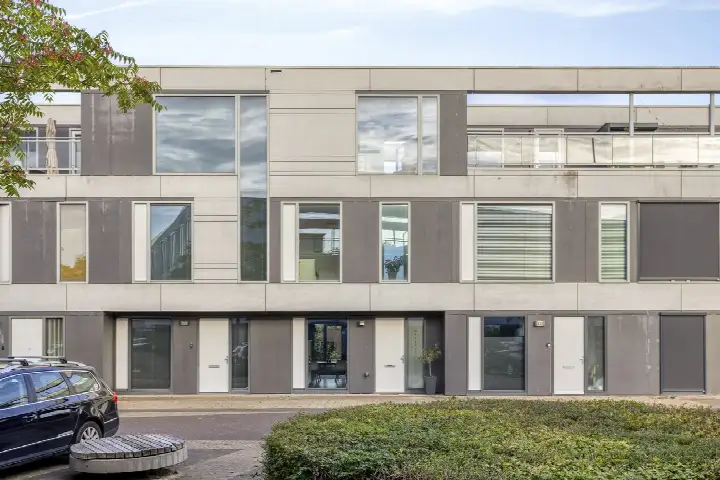
Auto-translated to English by AIThe housing stock is relatively young — 100% dates from after 1990. In addition, the most common type is terraced houses (44%).
Over the past year a home for sale in Meerhoven was listed for an average of €640,343 (€4,546 per m²). That is 22% above the Dutch national average. Last quarter prices rose by 52%.
A rental home in Meerhoven cost an average of €1,785 per month (€19 per m²). That is 17% below the national average.
Residents give Meerhoven a 8.5 out of 10 based on 7 reviews. Especially education (9.6) scores well; housing (8.4) receives the lowest rating.
Wijk Meerhoven has 13,635 residents. The largest age group is 25 to 45 years (31%). Many families: 46% of the households have children.
The housing supply in Meerhoven is remarkably efficient: 100% has an A, A+ or B label. The average natural gas consumption per household is 120 m³ per year.
From Meerhoven you can on average reach a supermarket at 1.2 km, a GP at 1.4 km, a railway station at 5.3 km, a primary school at 1.1 km (as the crow flies, source: CBS).
Right now you will find 103 homes for sale and 35 homes for rent in Meerhoven.