District in Haarlem
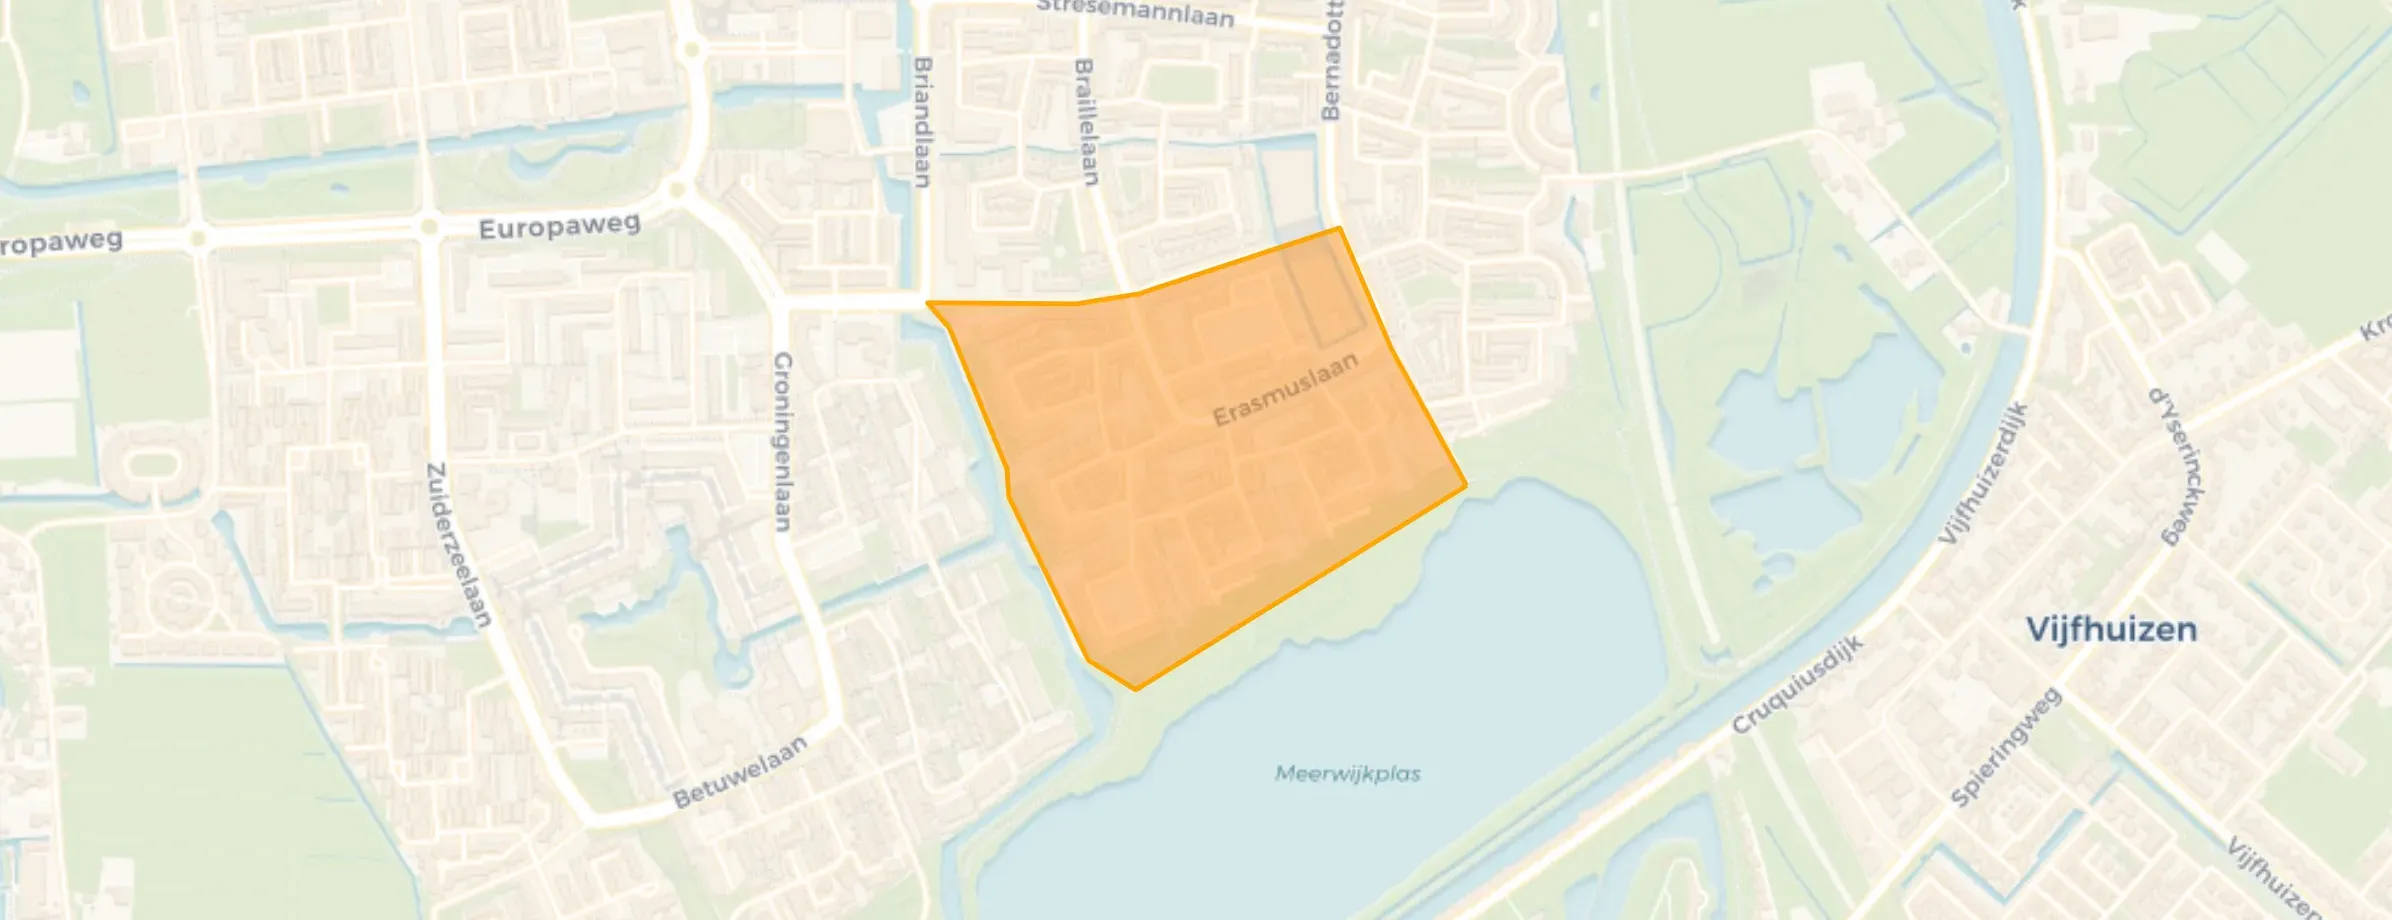
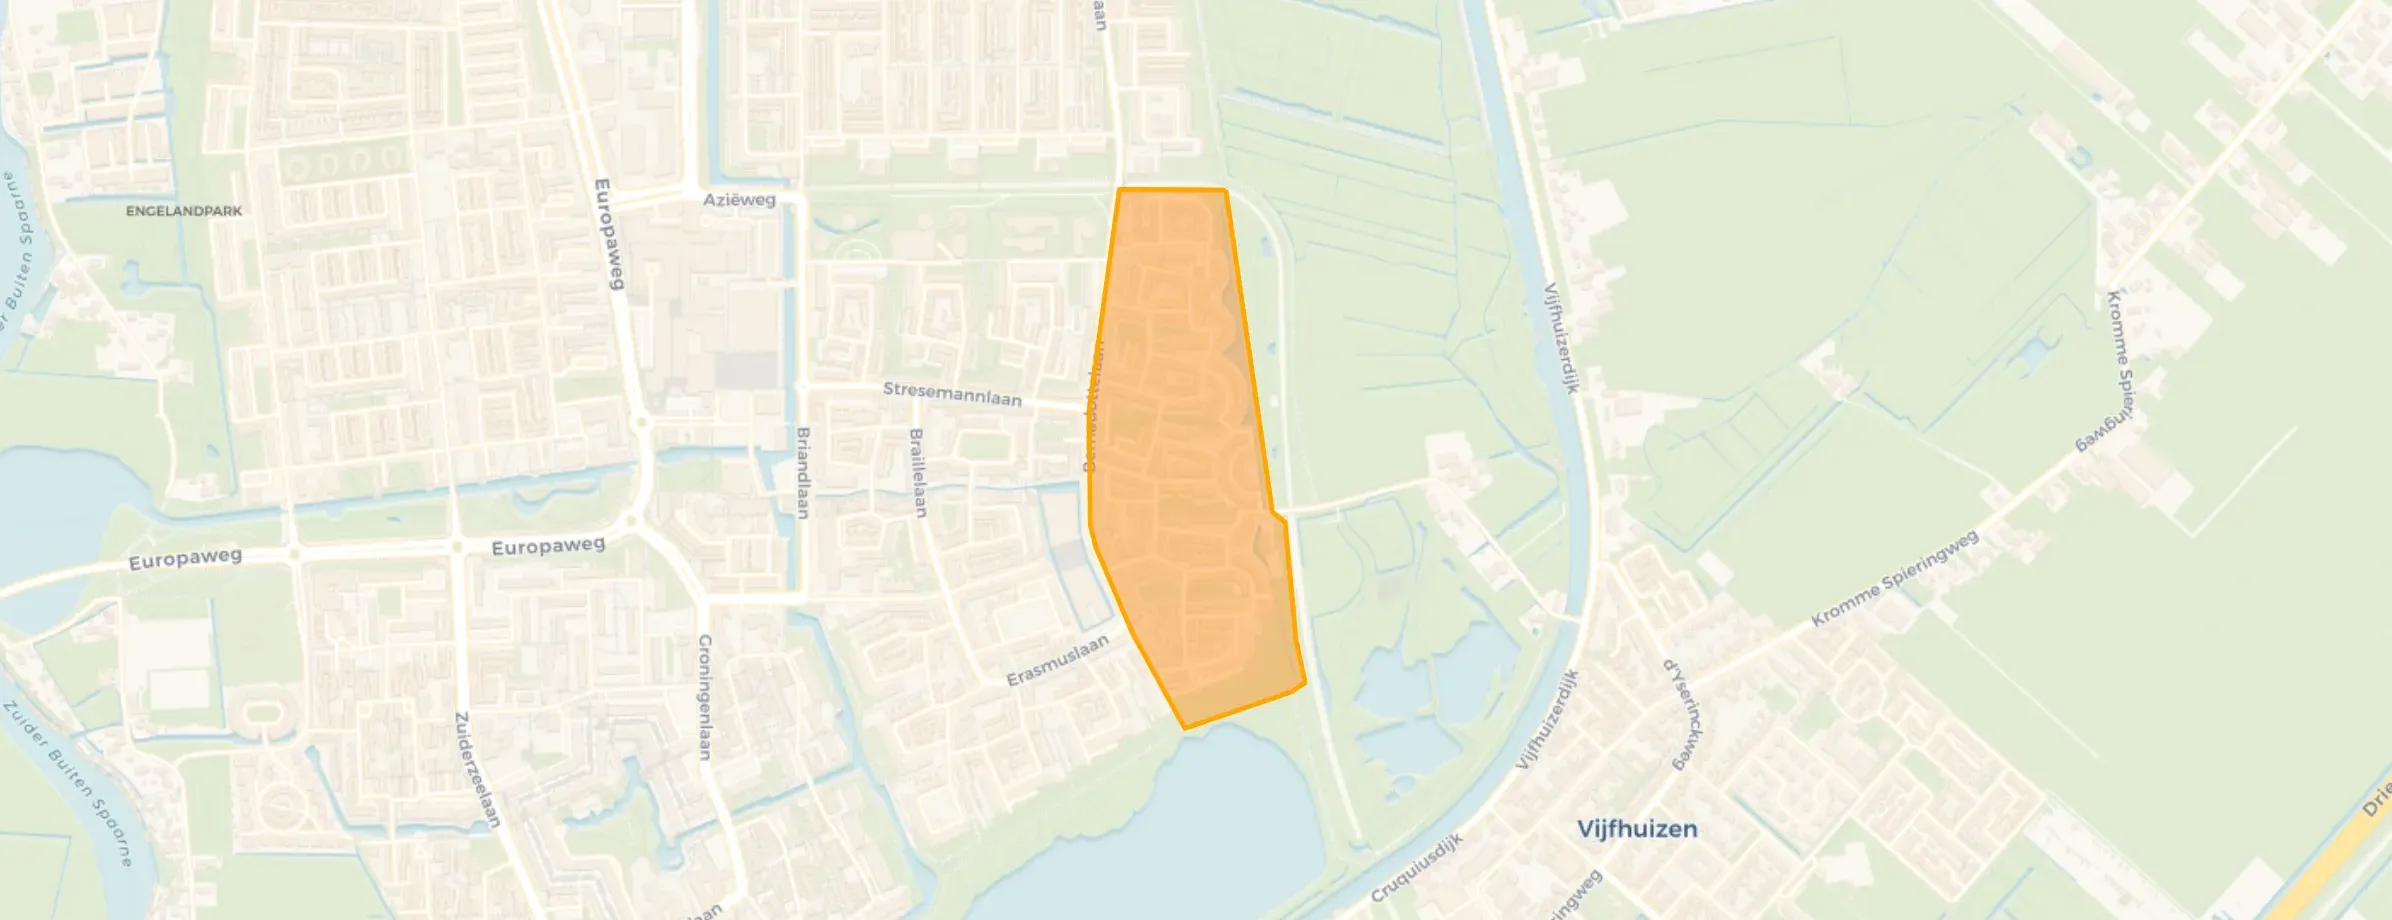
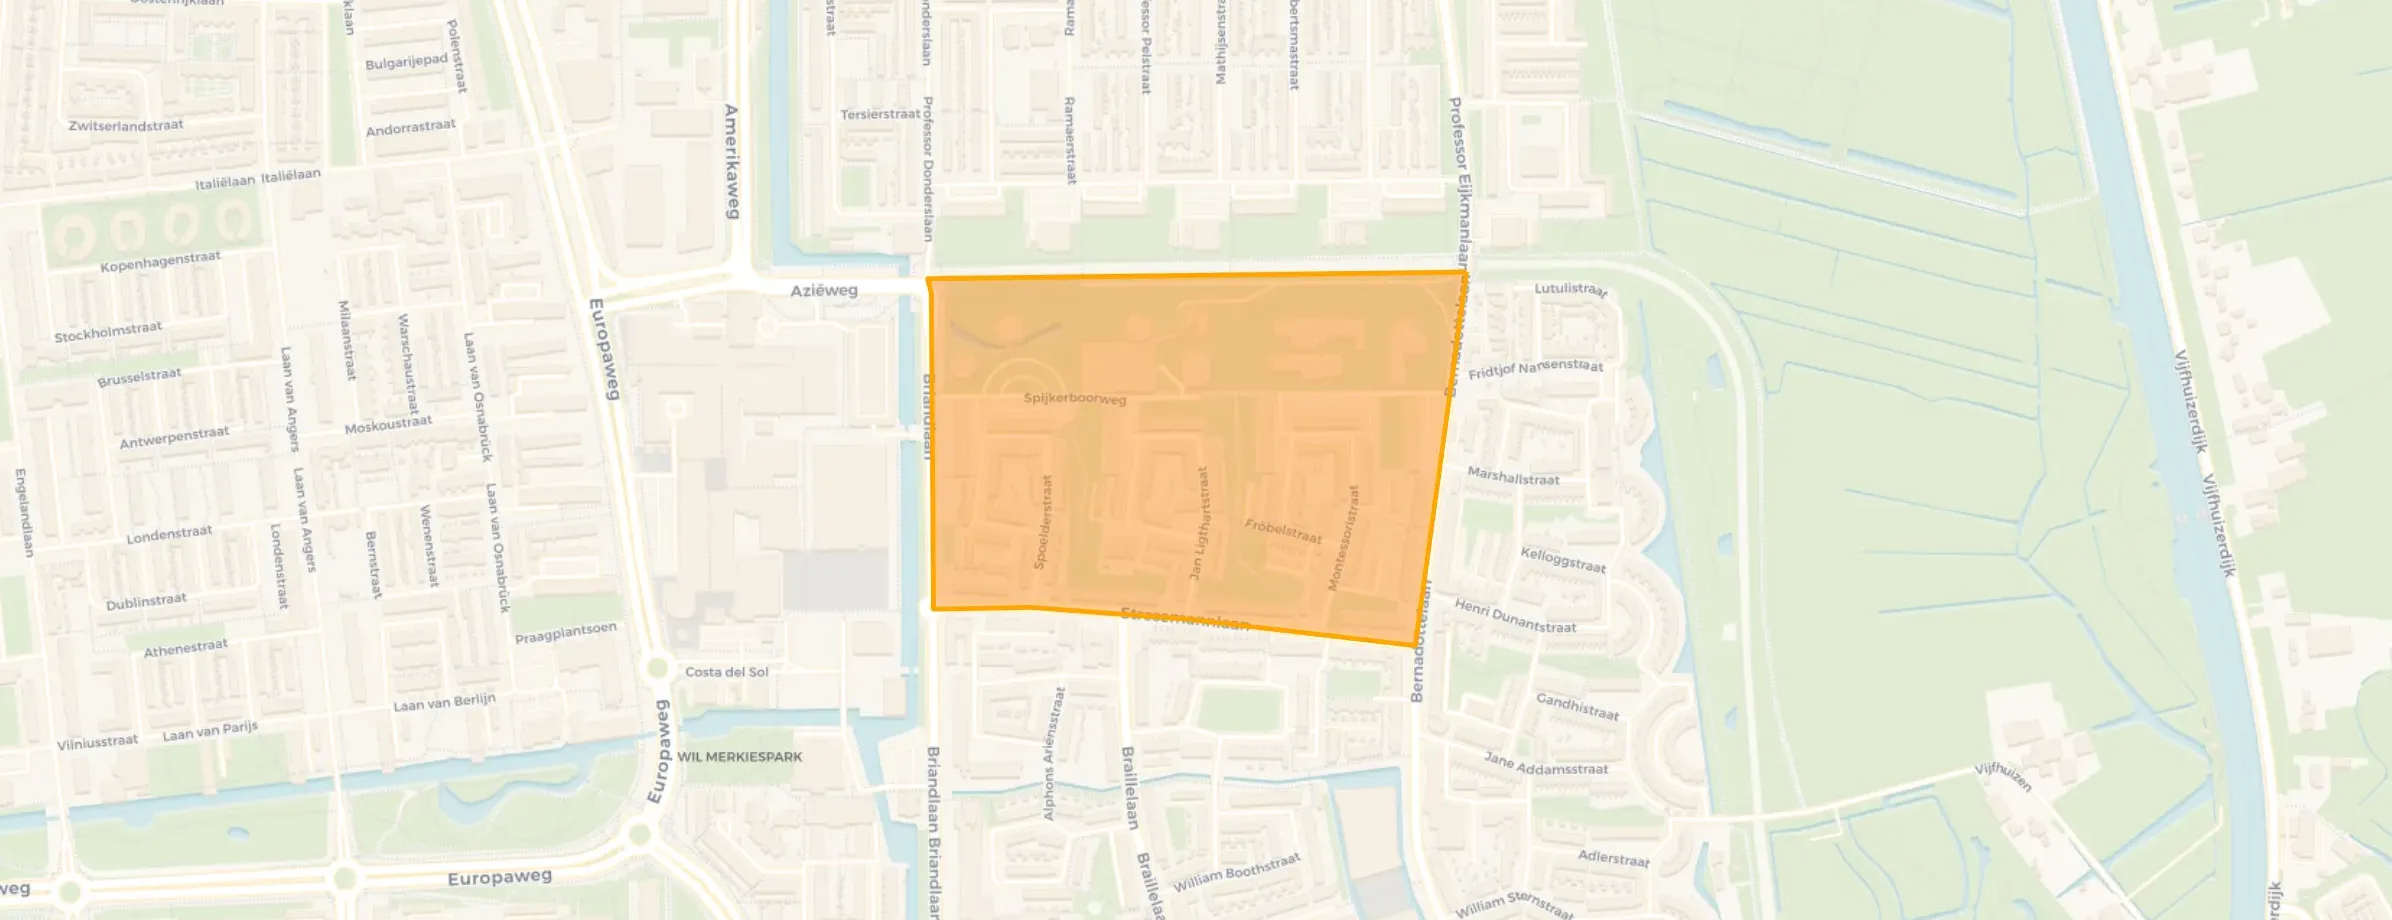
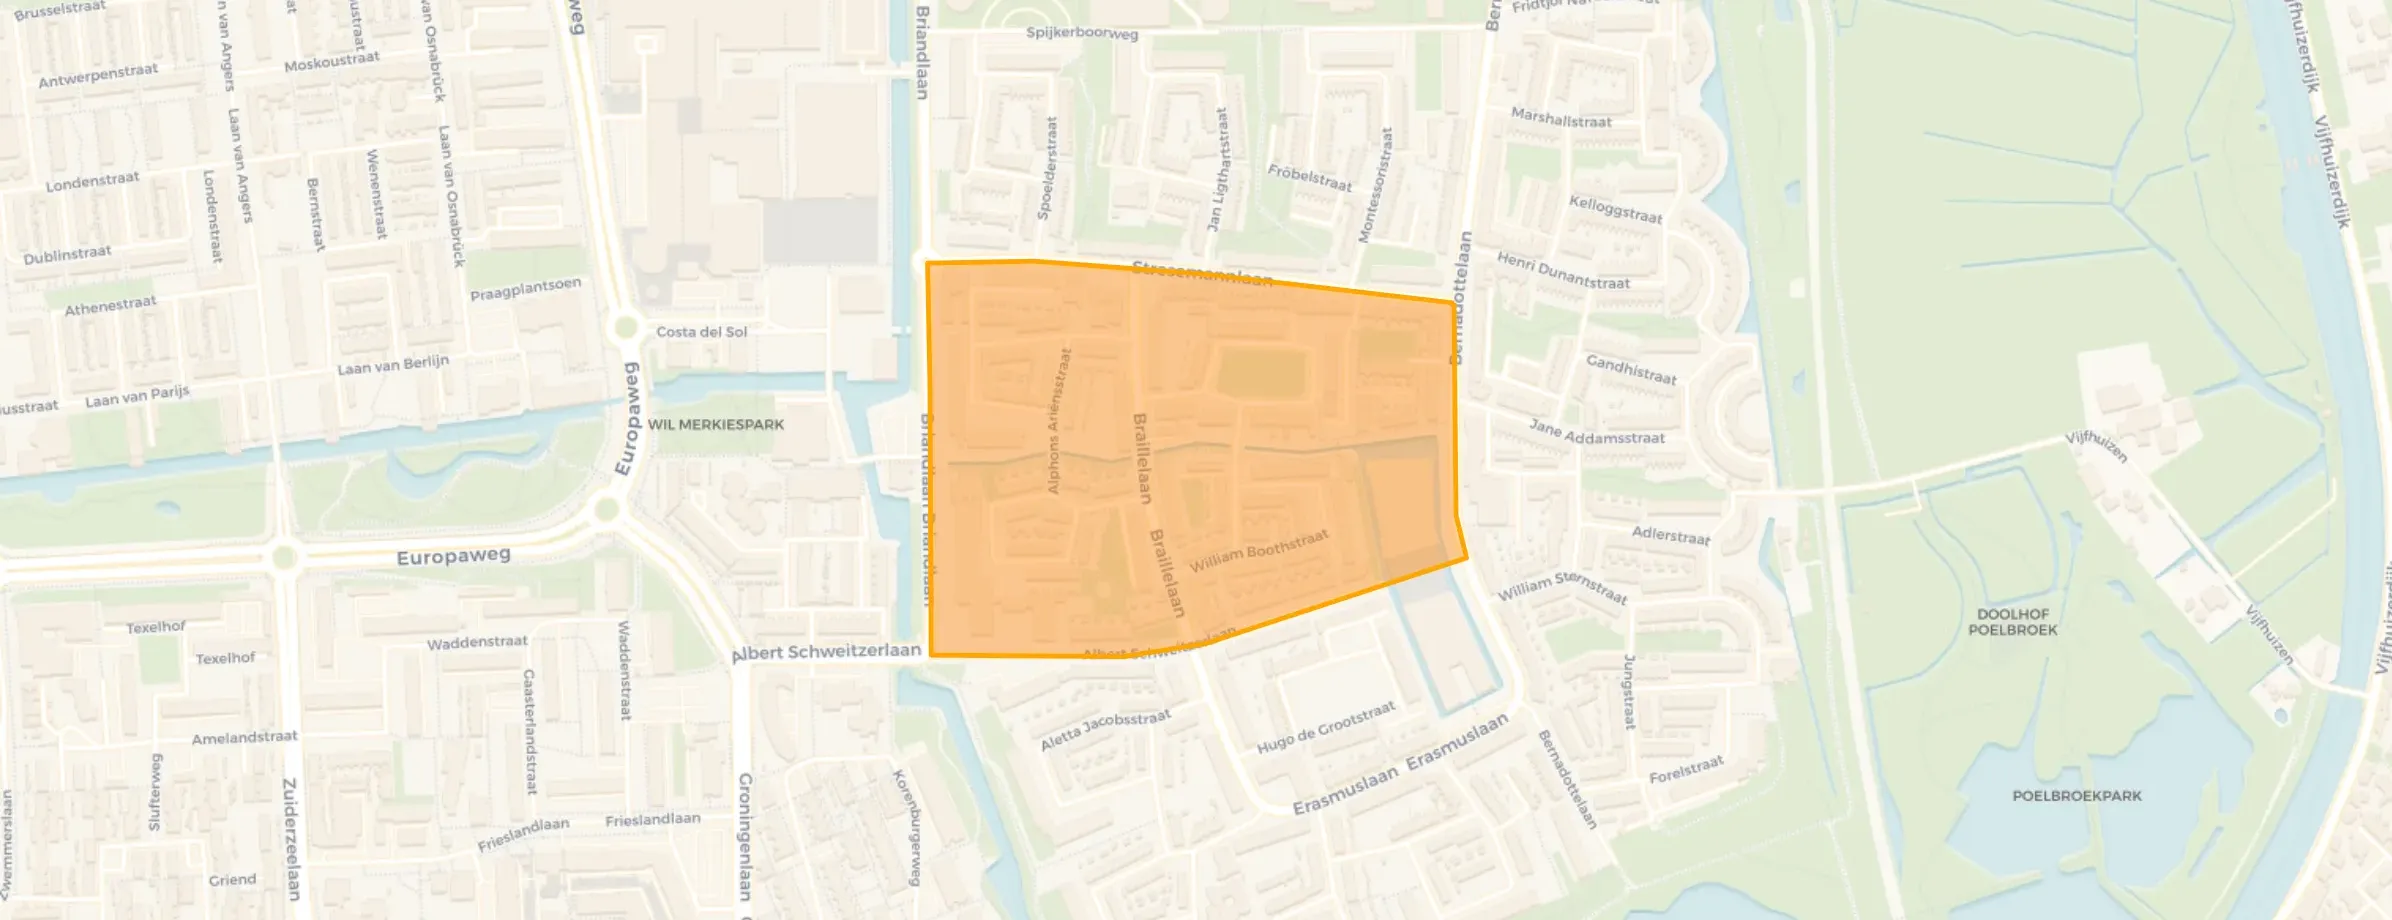
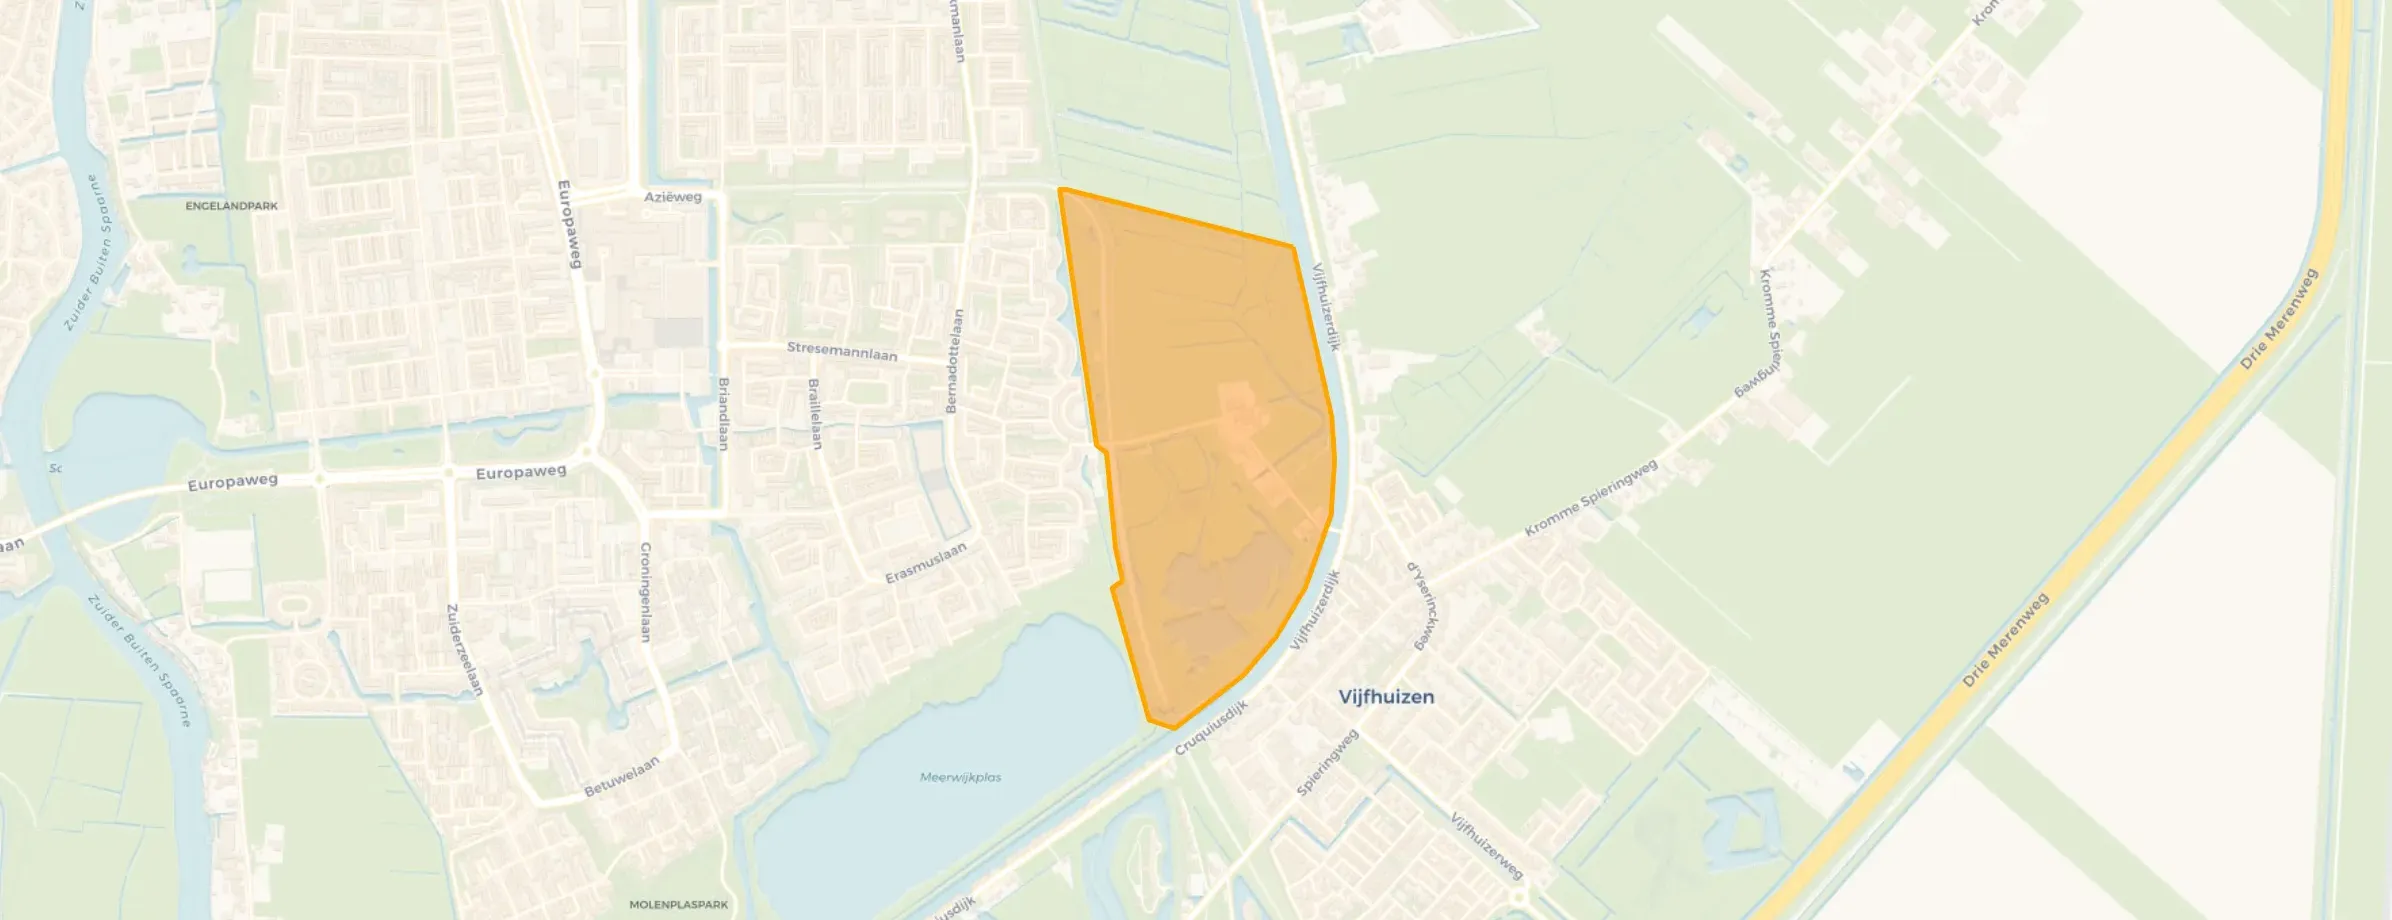
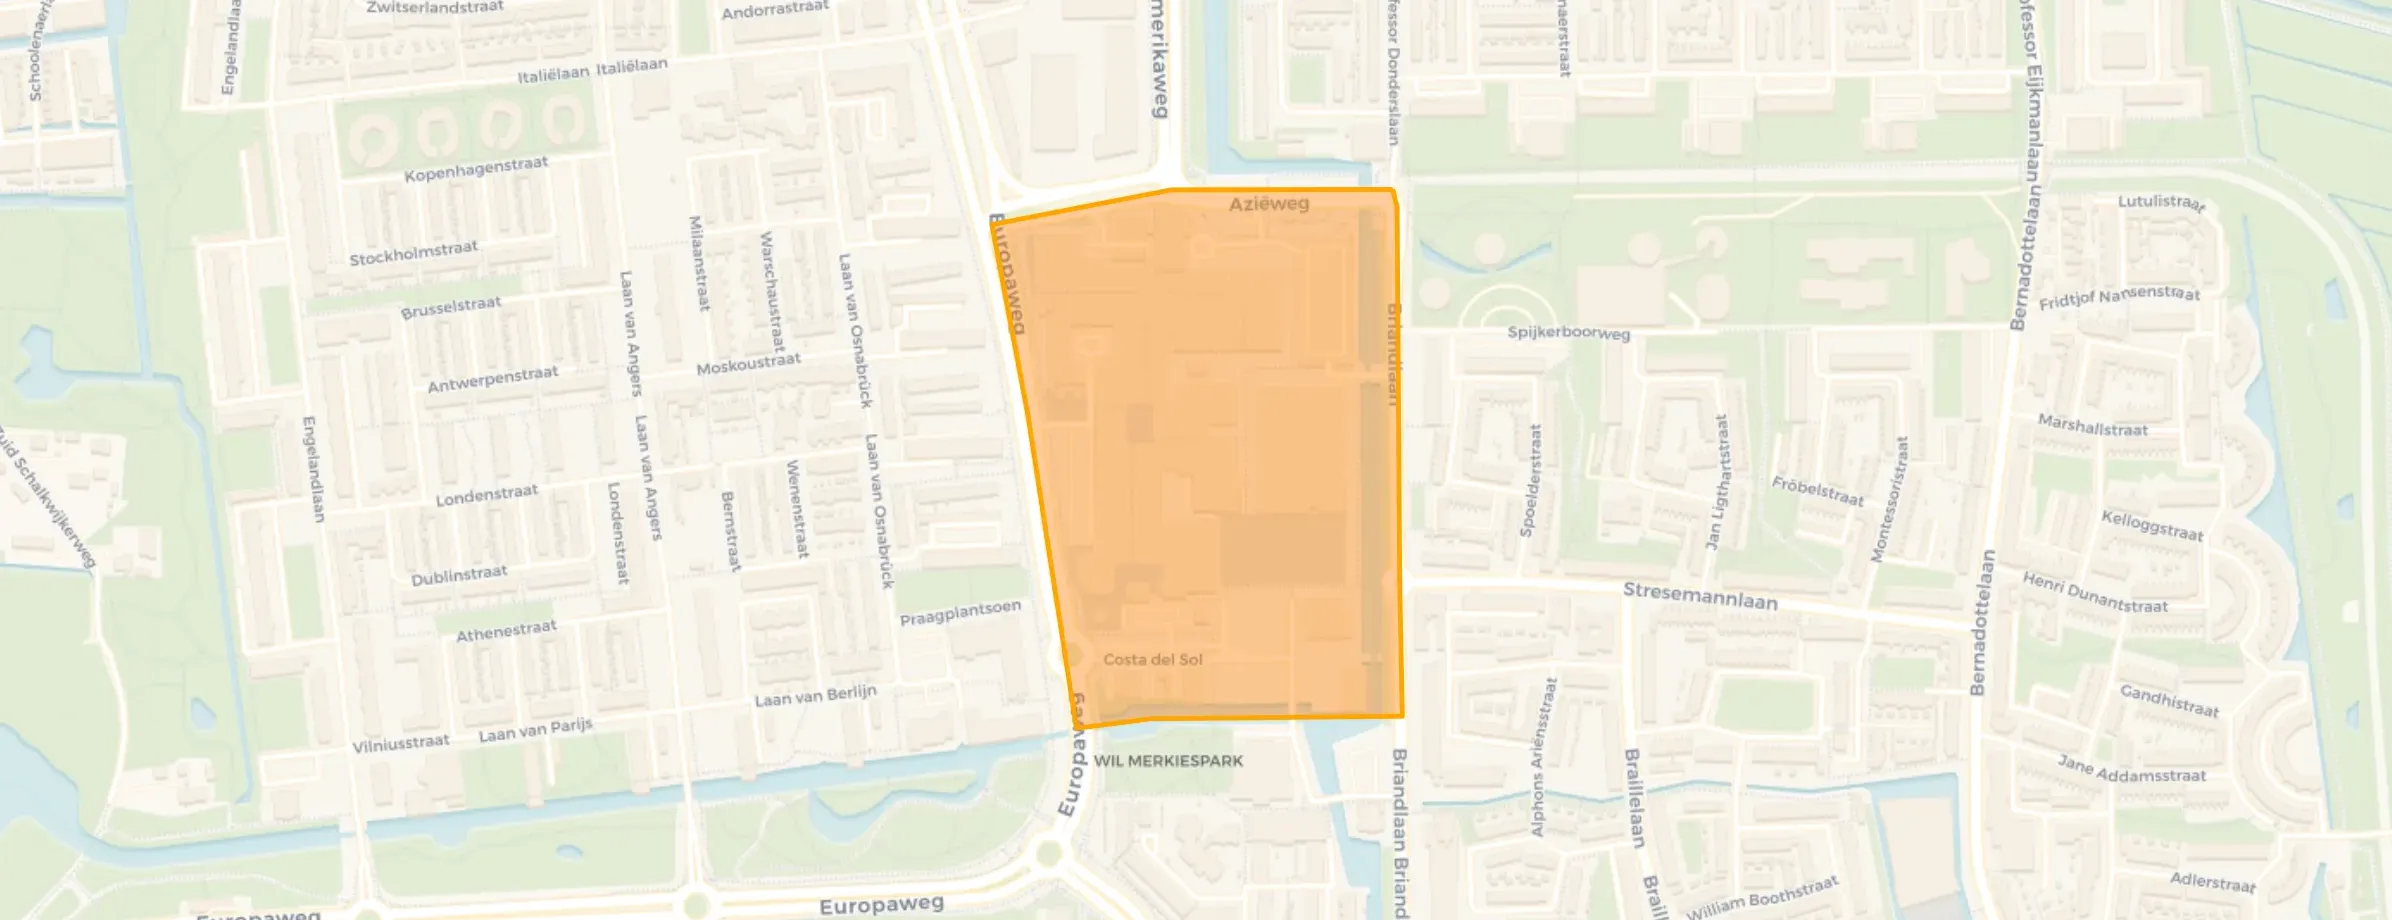
Meerwijk is located in the province of Noord-Holland, in the municipality of Haarlem The district has a total area of 175 hectares, of which 145 hectares are land and 31 hectares are water. The district is coded as WK039221. The postcode area is 2037AB-2037XZ.
Meerwijk has 9.570 residents. Of these, 48,9% are men and 51,1% are women. Most residents are 25 to 45 years (26,7%). The other age groups are 24,8% for '45 to 65 years', 18,9% for '65 years or older', 17,7% for '0 to 15 years' and 11,9% for '15 to 25 years'. Of the residents, 51,4% is unmarried, 34,0% is married, 9,8% is divorced and 4,7% is widowed. 3.680 residents originate from the Netherlands, 635 come from Europe and 5.250 come from countries outside Europe.
There are 4.305 households in Meerwijk. 42,6% of these are single-person households, 21,6% households without children and 35,8% households with children. The average household size is 2,2 persons. The national average is 2,1 persons.
In Meerwijk there are 7.100 income recipients. The average income per income recipient is €32.800, which is €9.400 (22%) lower than the national average of €42.200. Per resident, the average income is €25.900, which is €9.000 (26%) lower than the national average of €34.900. Most residents of Meerwijk are educated to an intermediate level. 40,5% have an intermediate education (HAVO, VWO or MBO 2-4), 39,2% have a lower education (VMBO or MBO 1) and 20,3% have a university or higher professional education (HBO/WO).
Of the 9.570 residents, around 60% are in paid employment, which amounts to 5.742 people. This is 12% lower than the national average of 72%. The majority of workers are in salaried employment (85%), while 15% are self-employed. In Meerwijk, 32% of residents receive a benefit. The largest group is those receiving a state pension (AOW). 1.650 people receive this benefit.
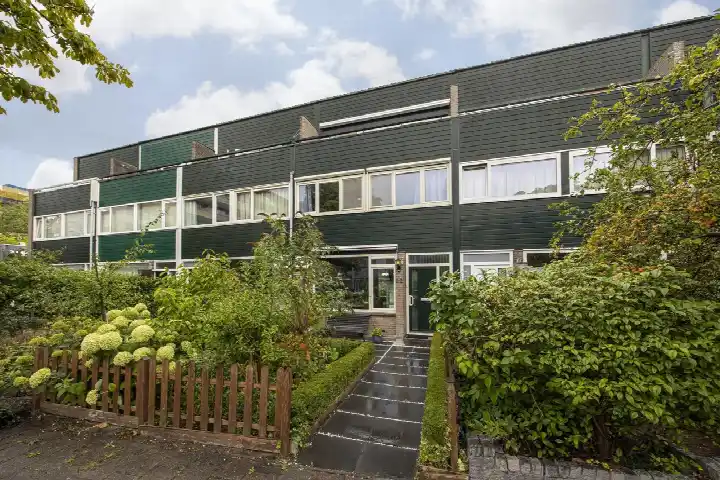
In Meerwijk there are 4.260 homes with an average assessed value (WOZ) of €359.000. Of these, around 98% are occupied and 2% unoccupied. Most homes are rental properties. This amounts to 78% rental homes and 22% owner-occupied homes. Of the homes, 22% privately owned, 67% owned by housing associations and 11% owned by other landlords. The most common construction periods in Meerwijk are 1970-1980 (41%) and 1950-1970 (38%).
There are currently no homes for sale in Meerwijk. The most recently listed home is Jan van Zutphenstraat 22 by Overspaern Makelaardij op Funda. No homes were sold in Meerwijk over the past year.
There are currently no homes for rent in Meerwijk. The most recent home is Aziëweg 318, offered by Holland2Stay op Funda. No homes were let in Meerwijk over the past year.
No recent rental data available for Meerwijk.
In Meerwijk there are 3.859 addresses with a registered energy label. The most common labels are A (32%), C (27%) and B (13%). On average, an address in Meerwijk uses 2.030 kWh of electricity per year. This is 20% below the national average of 2.550 kWh. With an annual consumption of 760 m³ per address, natural gas consumption is 5% below the national average of 800 m³.
I've lived here for almost 30 years. It used to be pleasant: clean, good contact with neighbours, etc. But due to the steady influx of Muslims, the neighbourhood is going downhill. Lots of litter lying around, misuse of rubbish bins (throwing all sorts next to them), not being open to contact, their children breaking things... in short: they have no connection with the neighbourhood and its residents. It creates an unpleasant atmosphere..
Auto-translated to English by AINeighbours never say anything to others, it seems as if no one lives there and no one is cheerful, actually it seems as if they don't see the point in life at all or have problems in their family or household which they show, maybe also financial problems. There is a playground further down where no one sits anymore and there is a neighbourhood team and coffee afternoon in the area which is seriously unsafe because of the people who constantly gossip about each other, I hope the coffee afternoon stops immediately!
Auto-translated to English by AII think the neighbourhood is well laid out in terms of the (house/apartment) distribution. Additionally, I believe the neighbourhood has improved in terms of building different types of homes on the same land. Finally, the amount of street lighting is pleasant when it's dark for a good and safe overview.
Auto-translated to English by AINeighbourhood is going downhill. Little maintenance of the old houses and the surrounding area. Lots of traffic on the street, police drive by every now and then. Little contact with neighbours, living past each other. Will be glad when I'm out of here.
Auto-translated to English by AINice neighbourhood with friendly neighbours and lots of green water in the area, safe to live
Auto-translated to English by AIIt's nice when you make plans with children and so on outside.
Auto-translated to English by AILots of shops, parking, plenty of greenery, nice people.
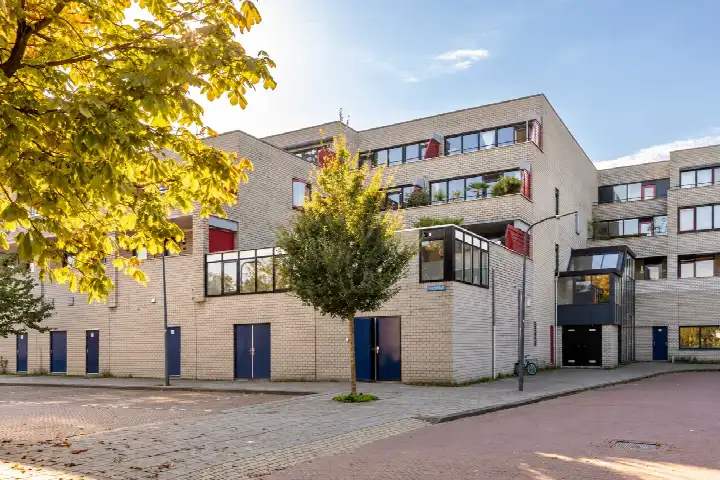
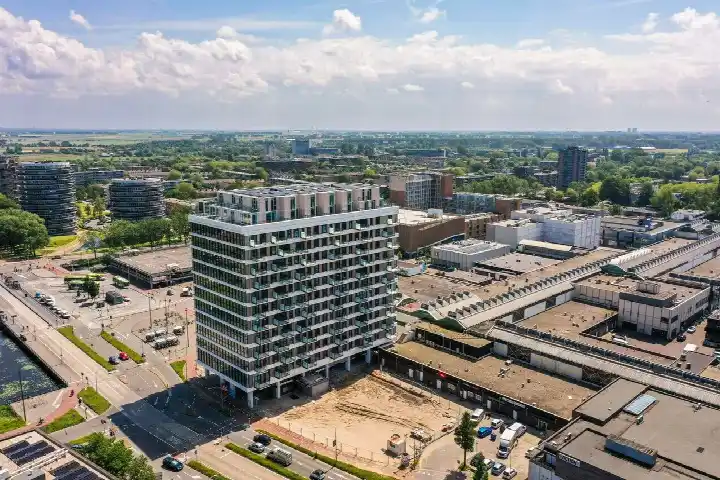
Auto-translated to English by AIThe housing stock is relatively young — 59% dates from after 1990. In addition, the most common type is flats (72%).
Over the past year a home for sale in Meerwijk was listed for an average of €512,148 (€5,207 per m²). Last quarter prices rose by 5%.
A rental home in Meerwijk cost an average of €1,672 per month (€20 per m²). That is 23% below the national average.
Residents give Meerwijk a 6.9 out of 10 based on 7 reviews. Amenities stands out with a 7.7; housing lags behind with a 5.6.
Wijk Meerwijk has 9,570 residents. Many families: 36% of the households have children.
The housing supply in Meerwijk is remarkably efficient: 79% has an A, A+ or B label. The average natural gas consumption per household is 760 m³ per year.
From Meerwijk you can on average reach a supermarket at 0.4 km, a GP at 0.7 km, a railway station at 4.7 km, a primary school at 0.5 km (as the crow flies, source: CBS).
Right now you will find 51 homes for sale and 7 homes for rent in Meerwijk.