
District in Westland
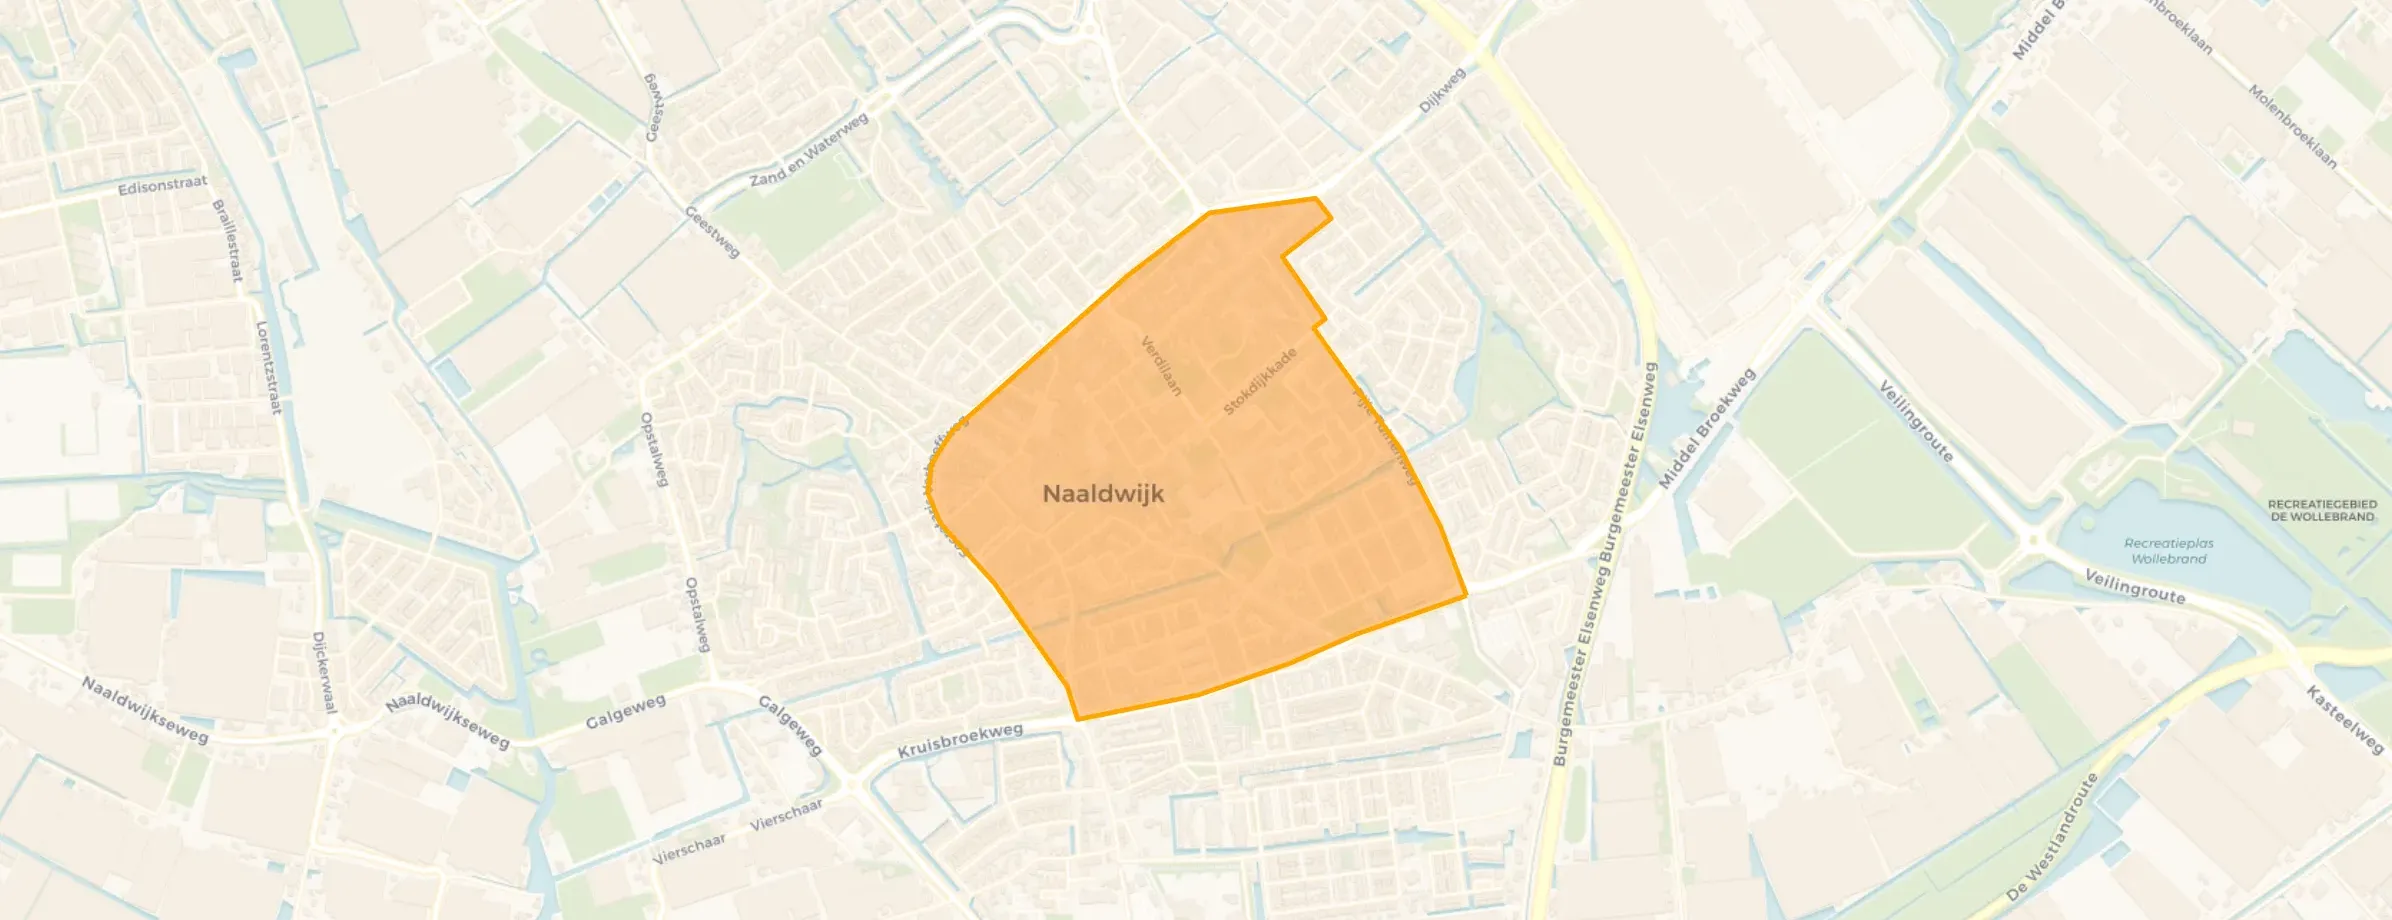
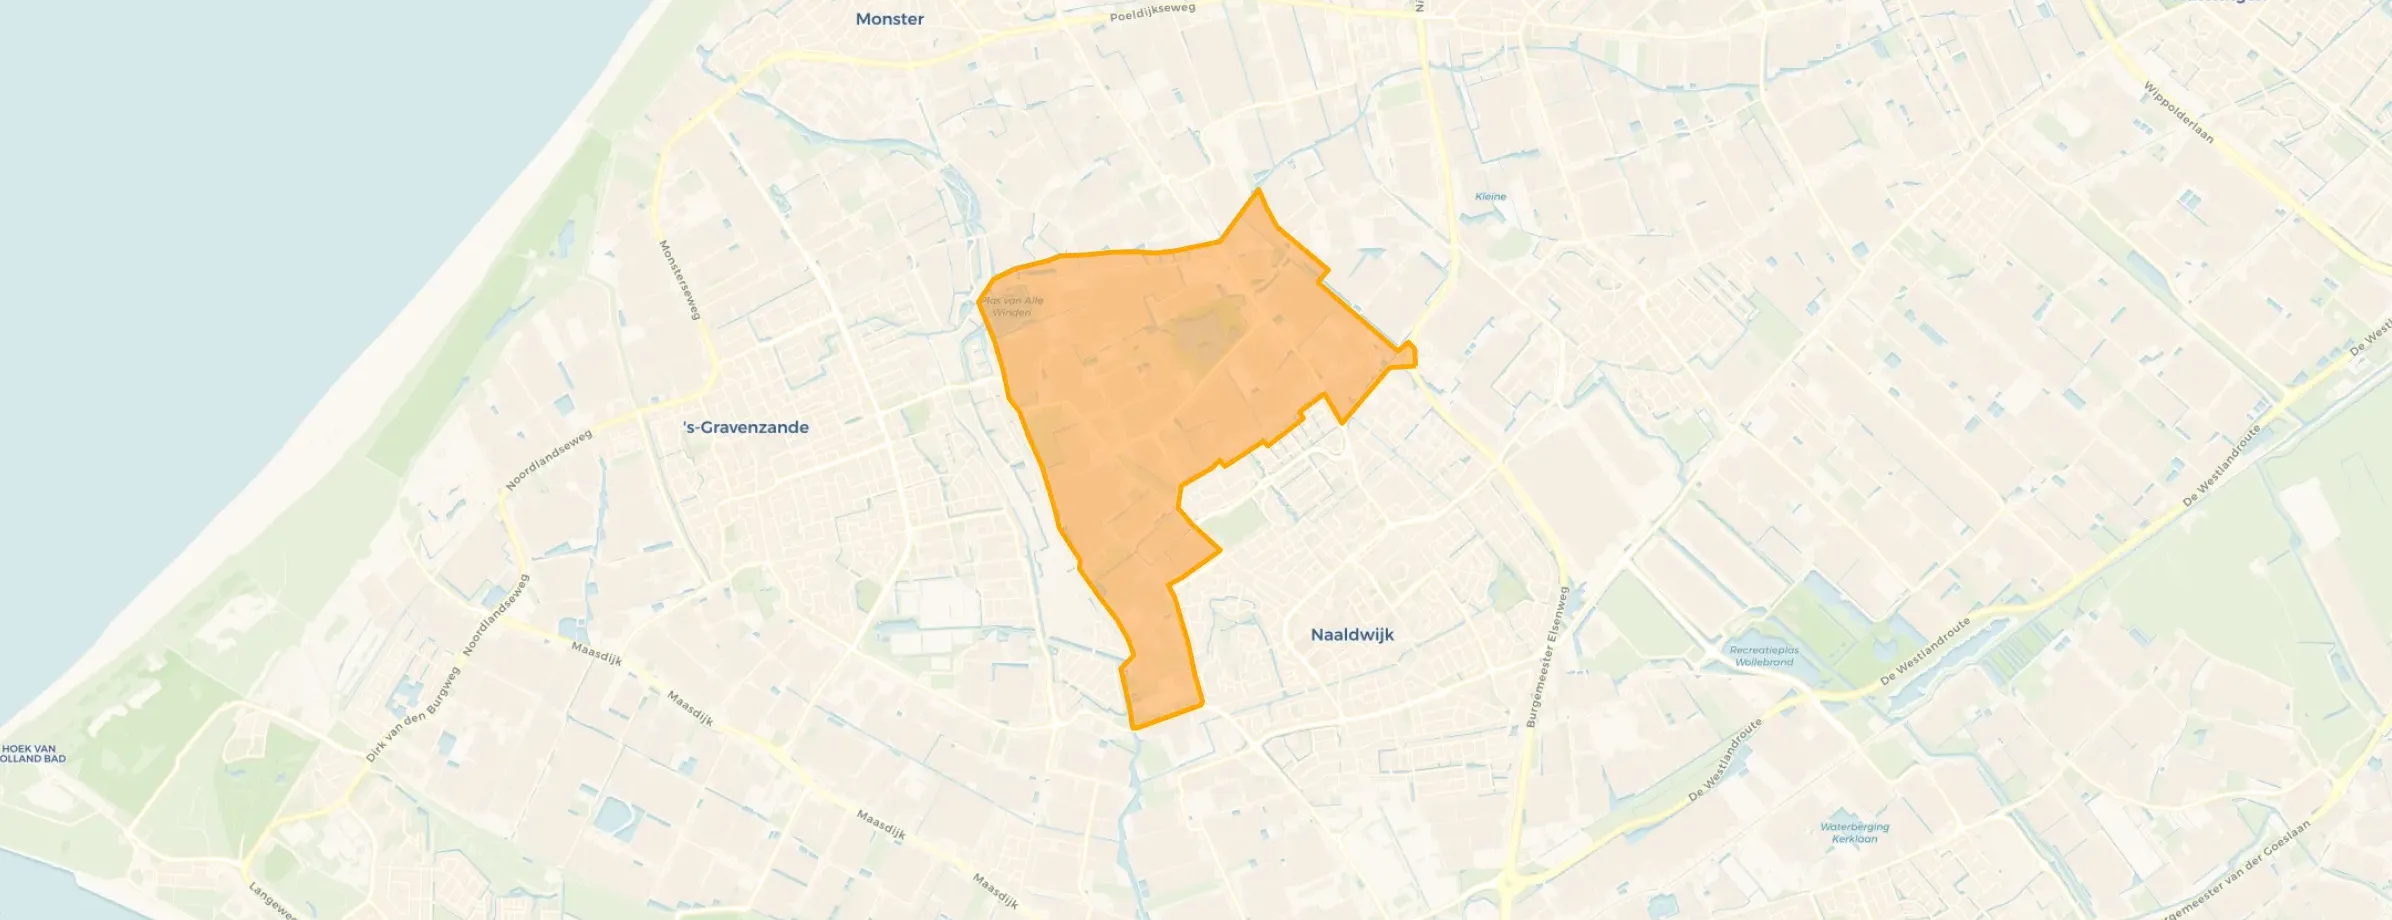
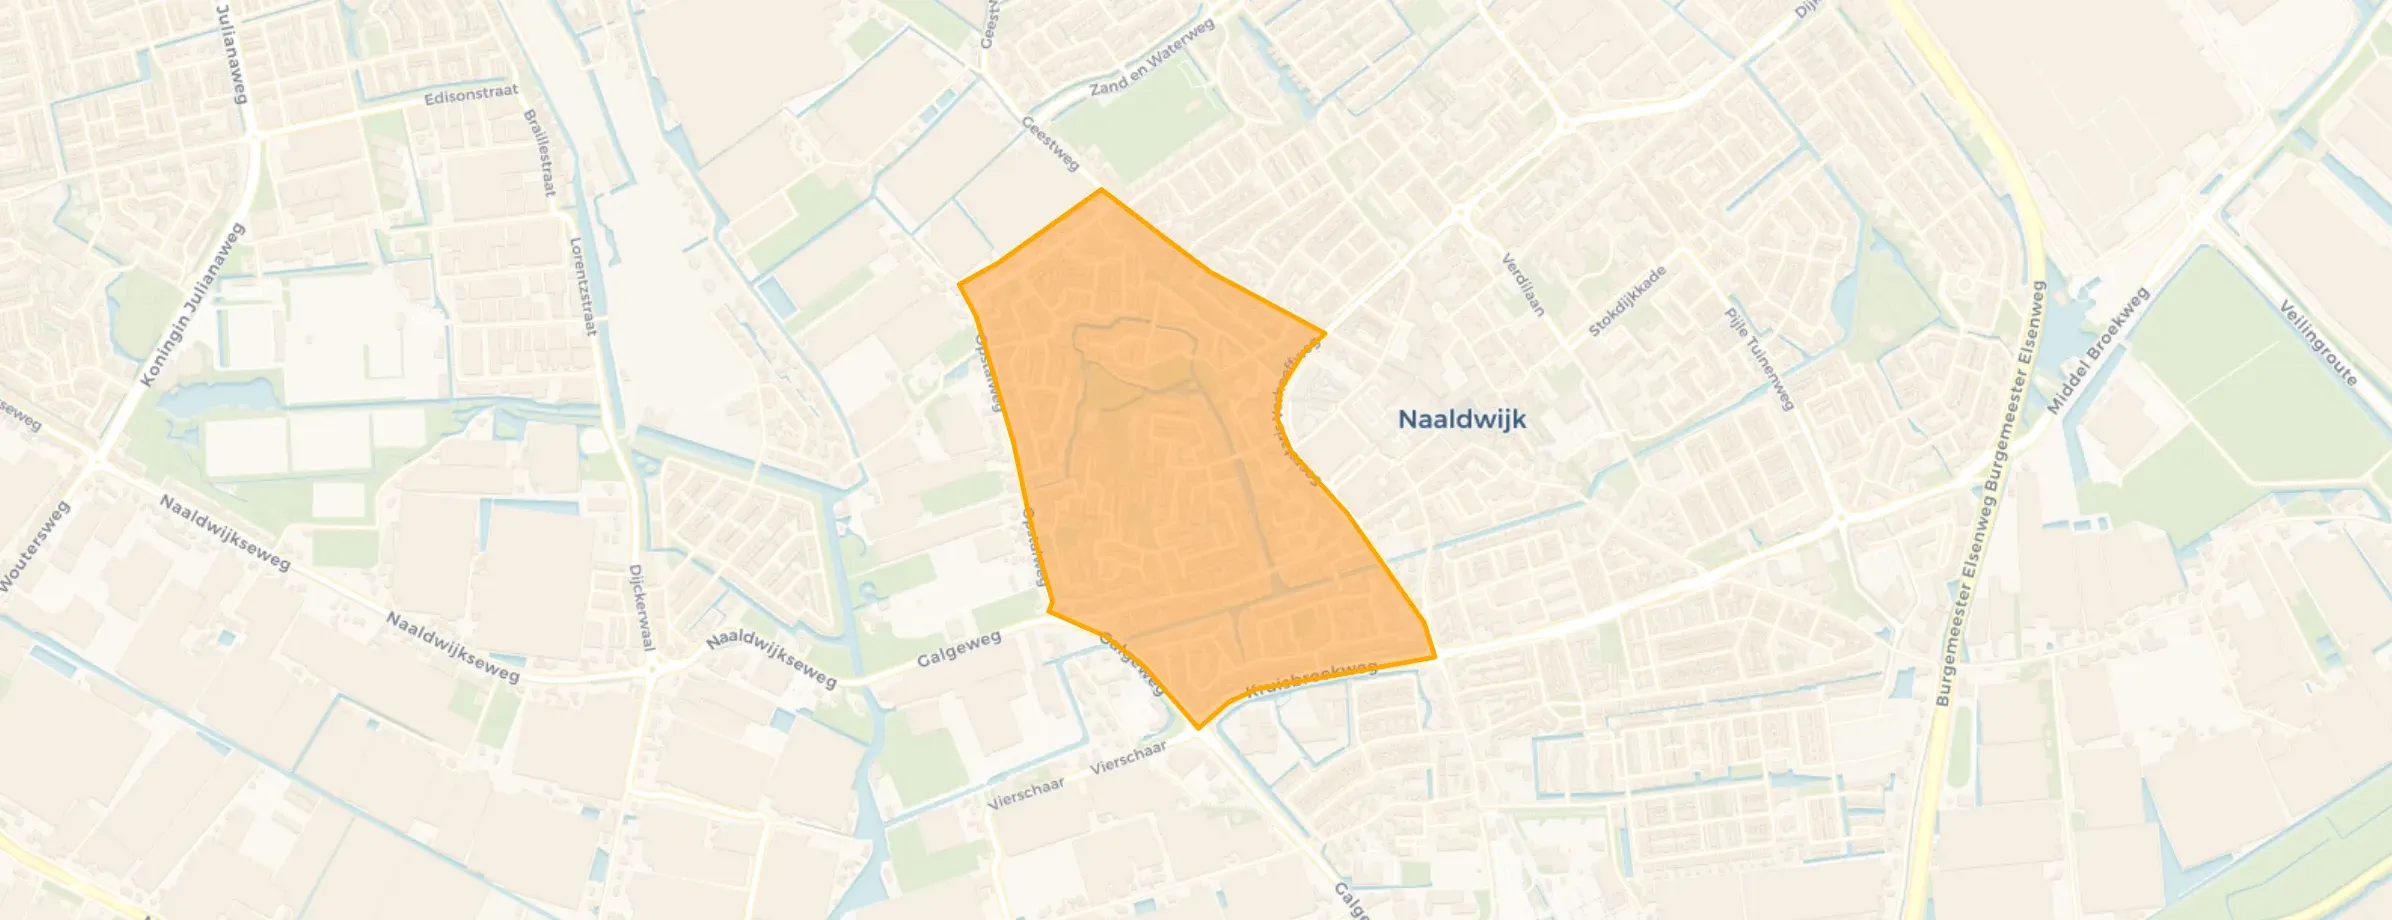
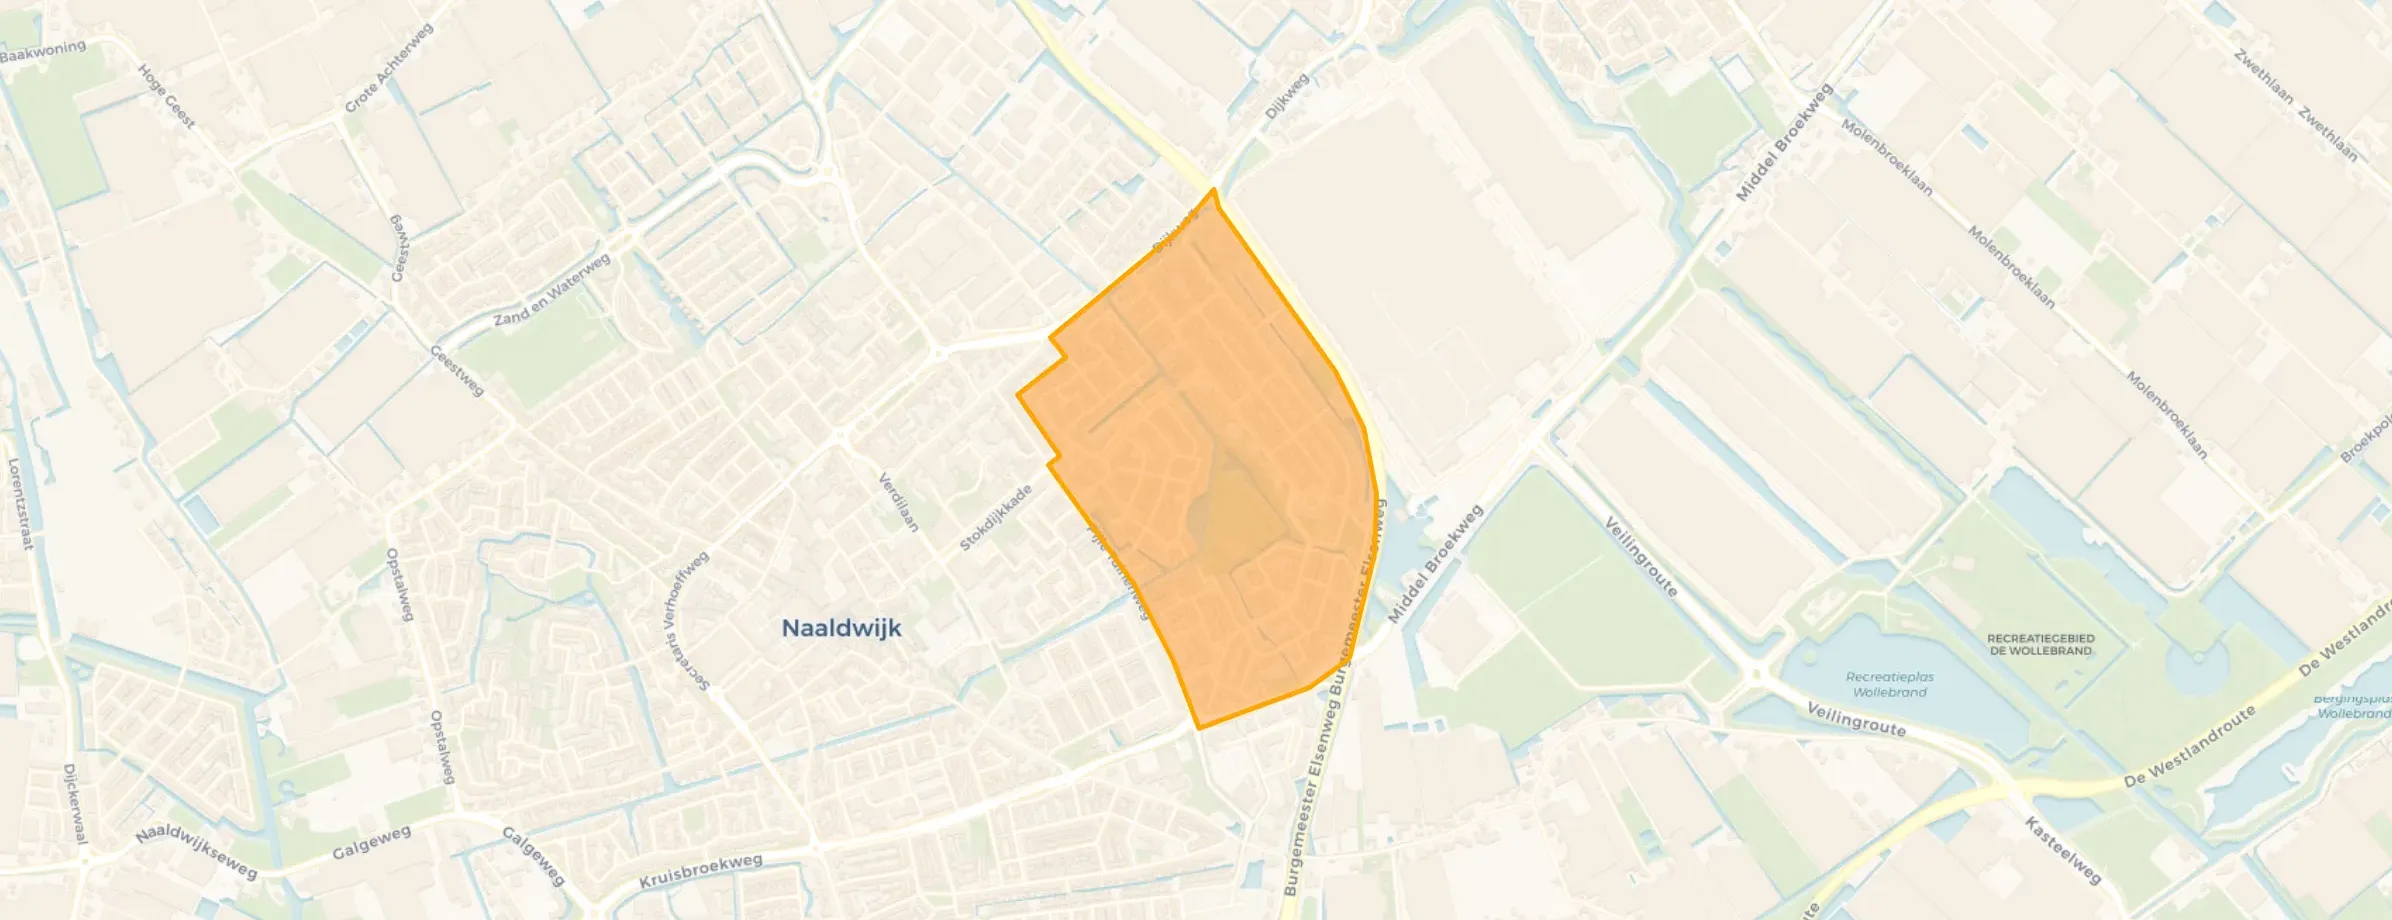
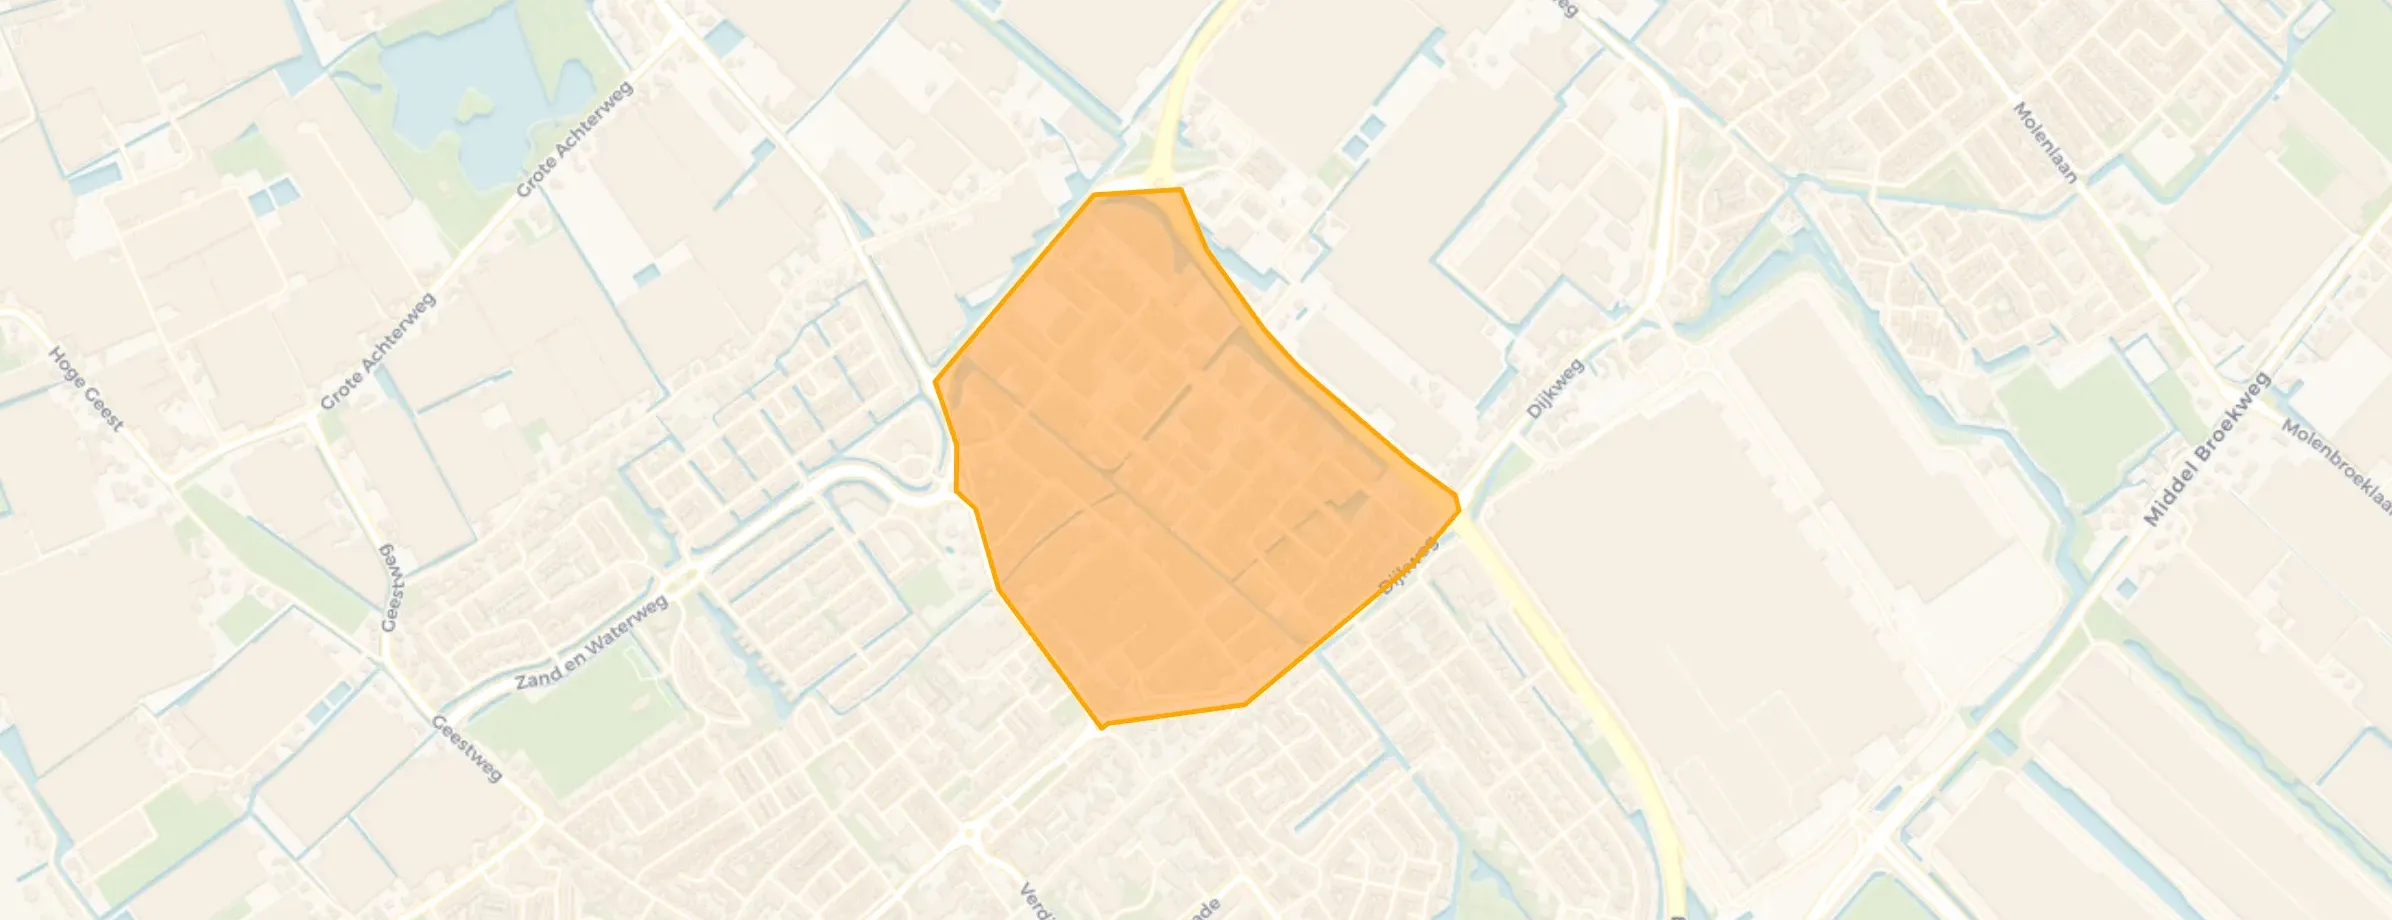
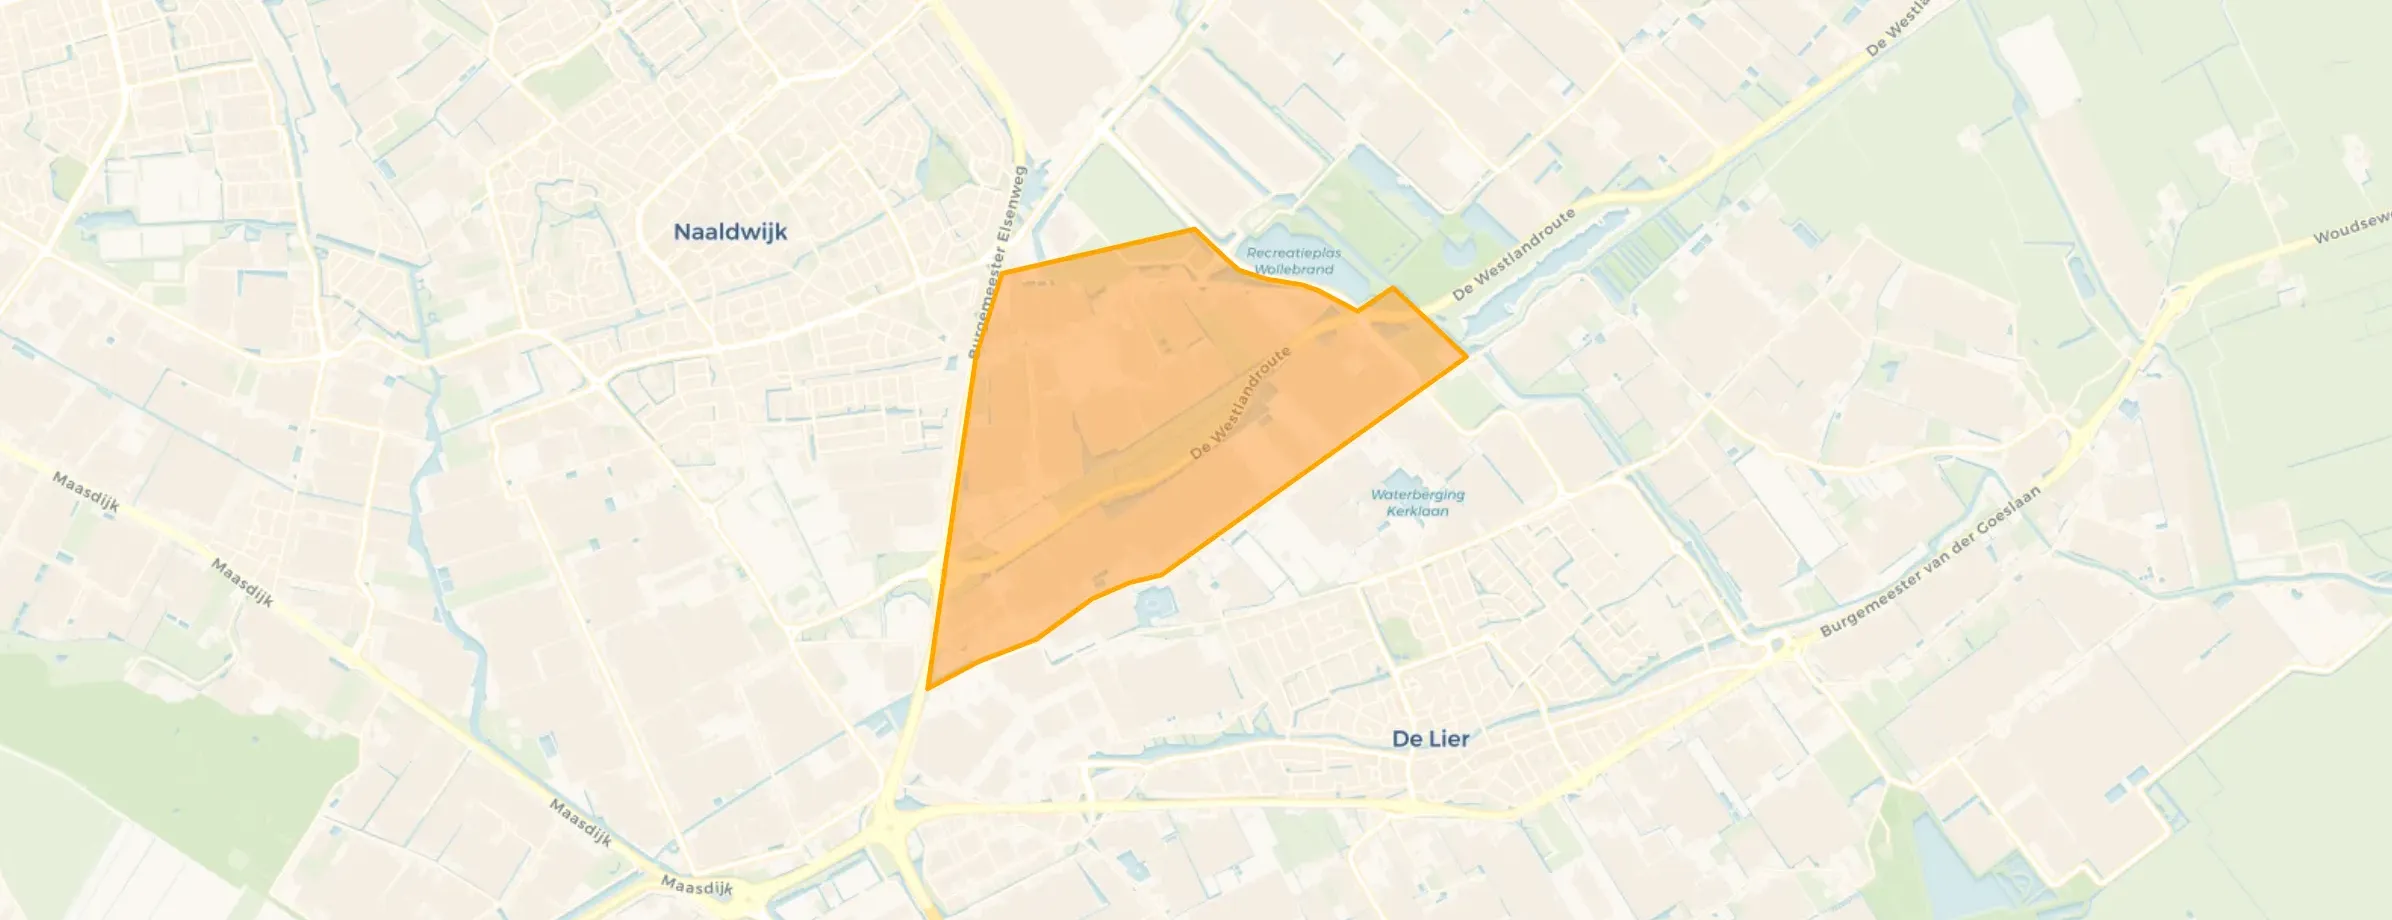
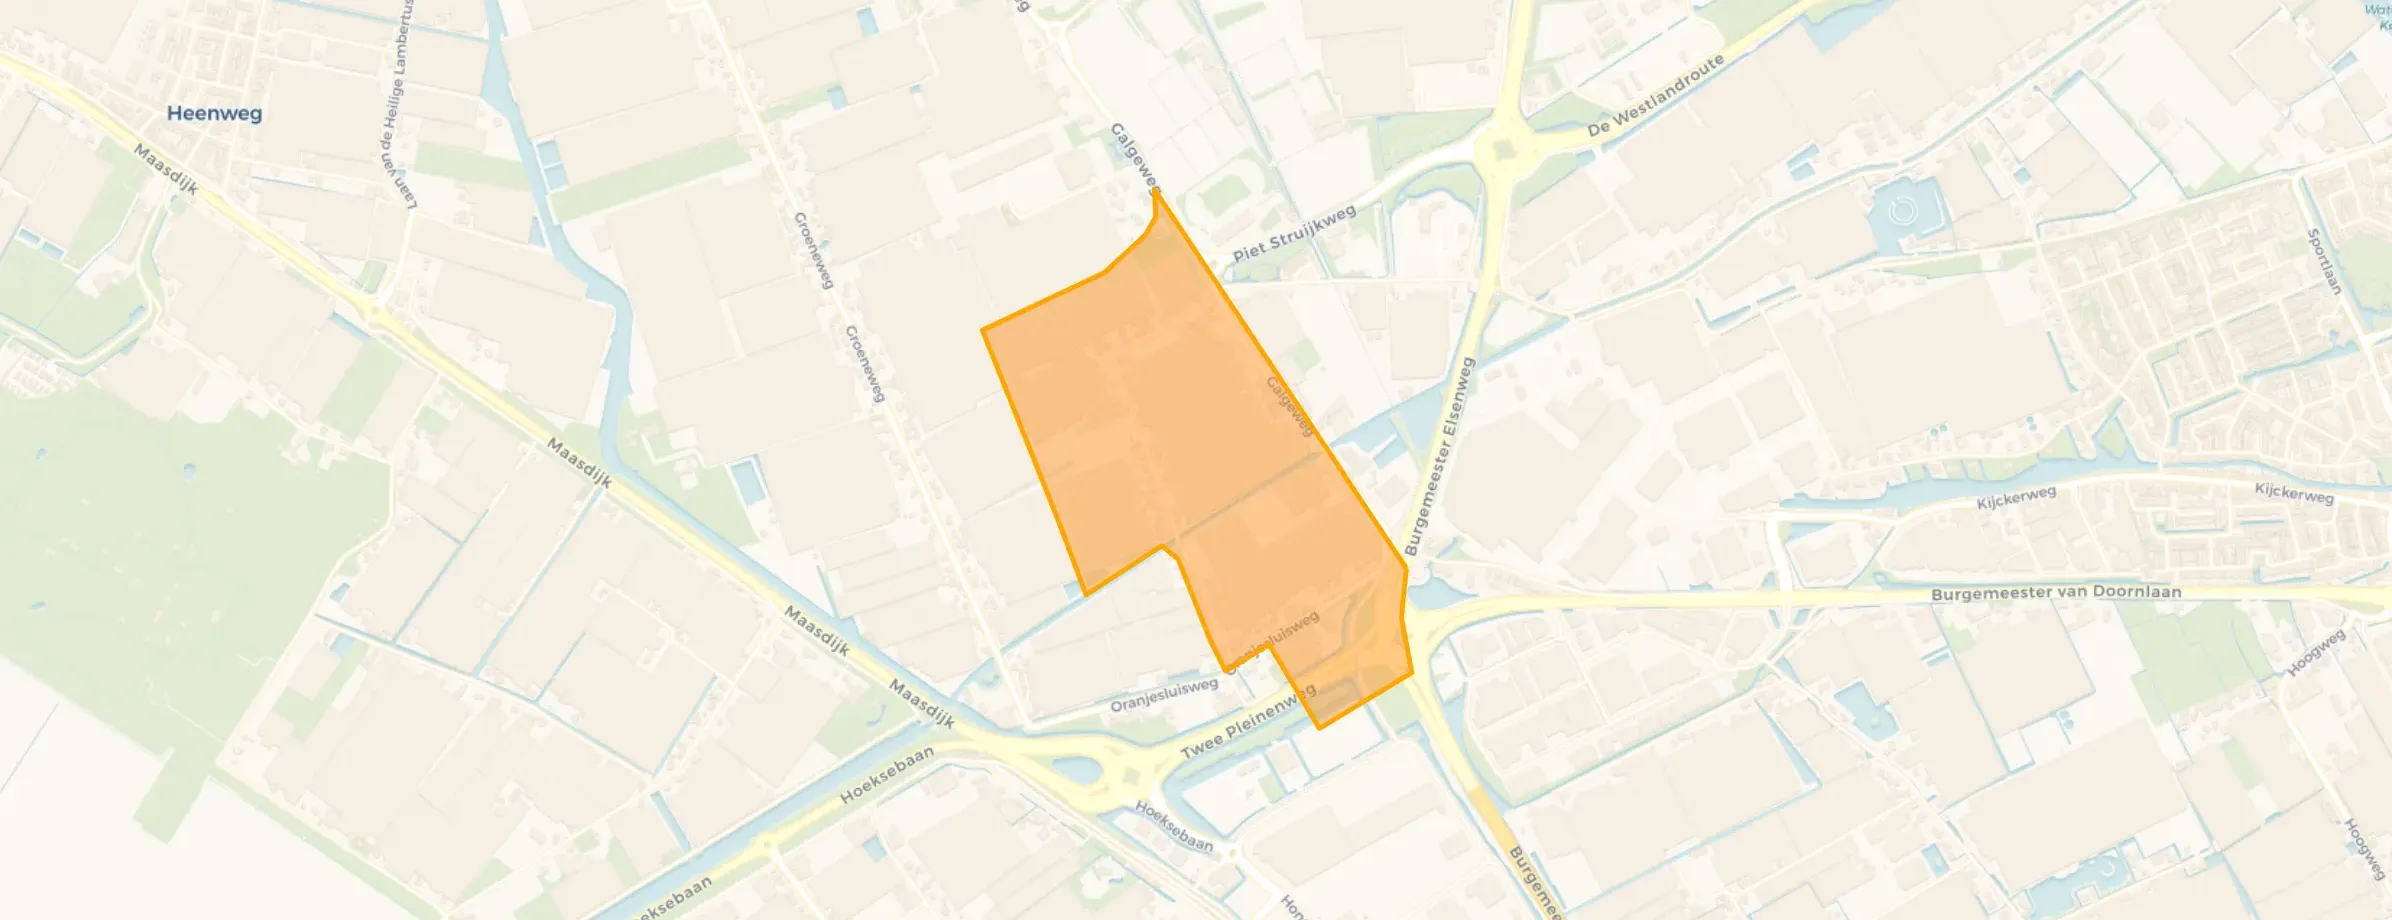
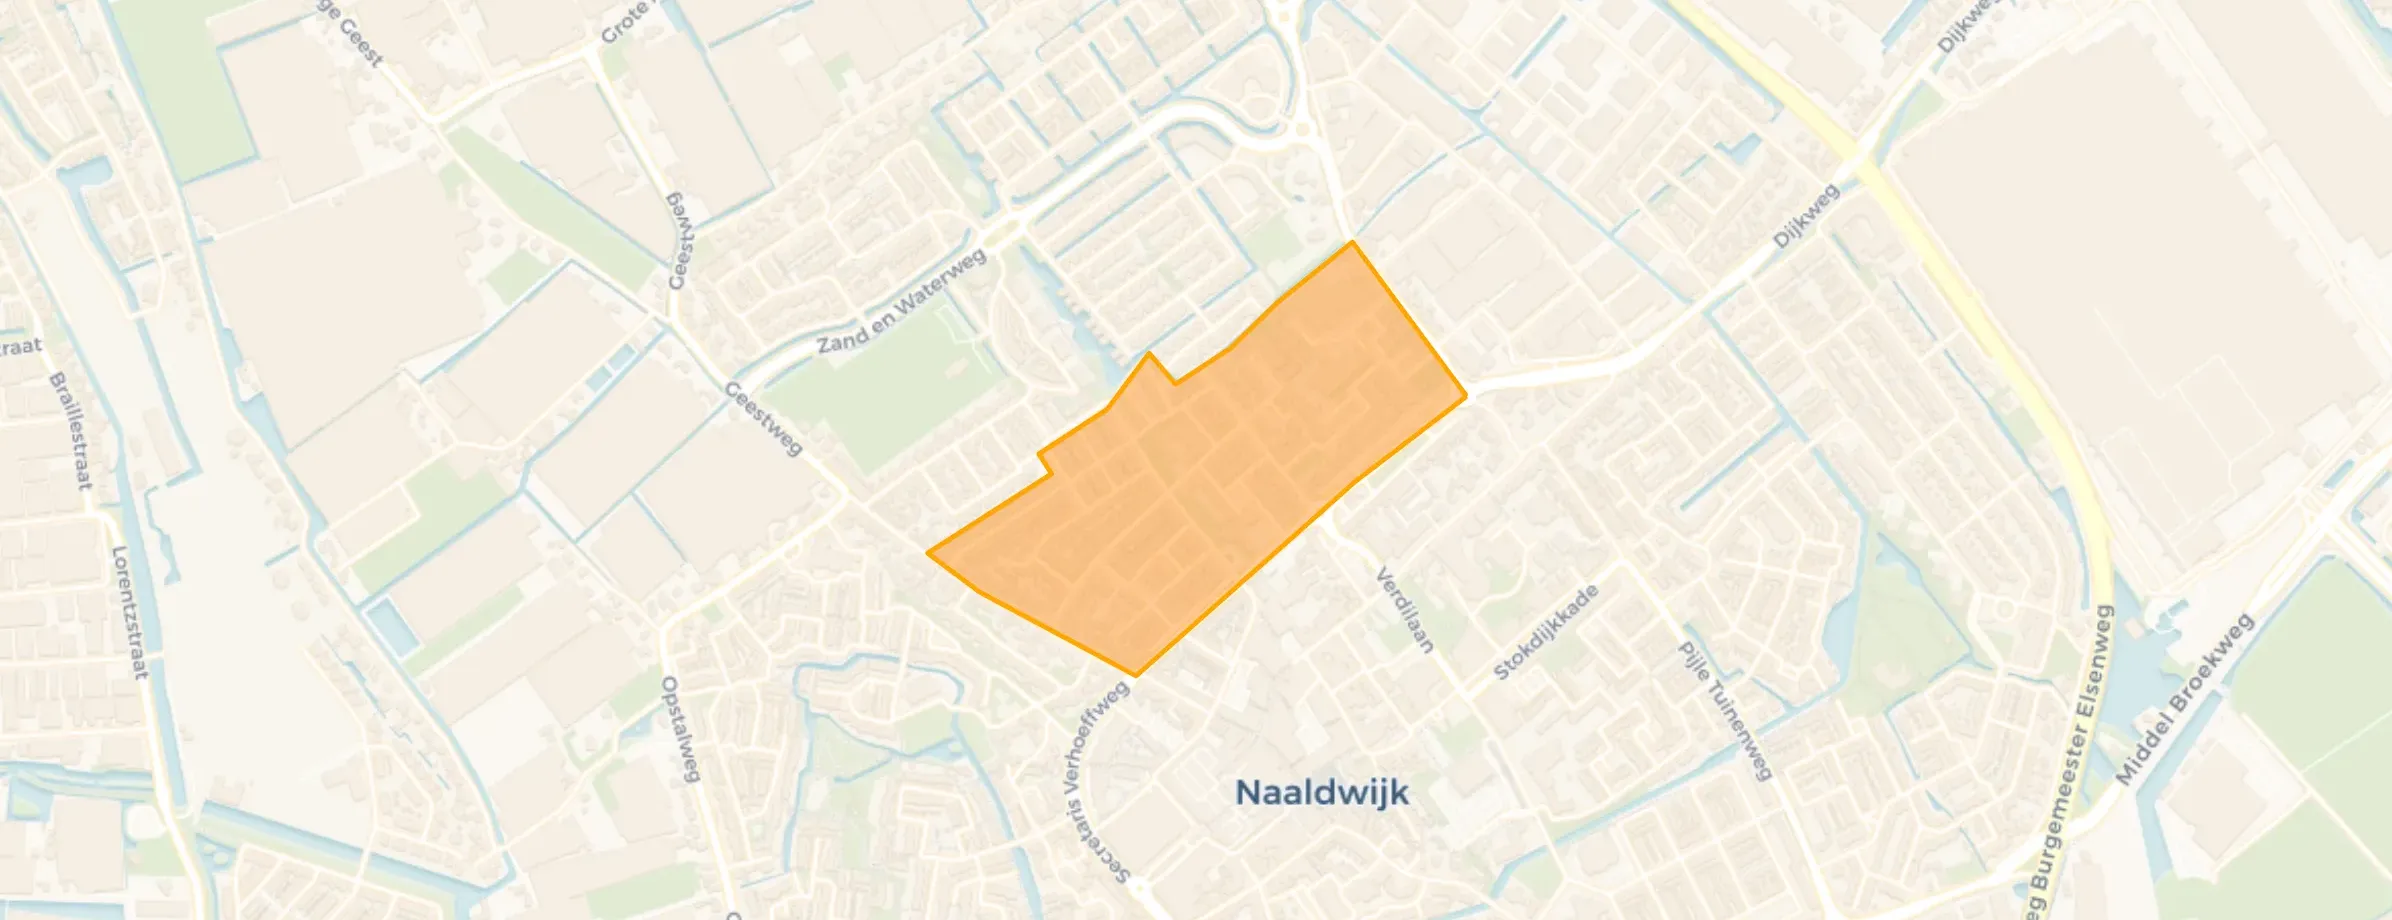
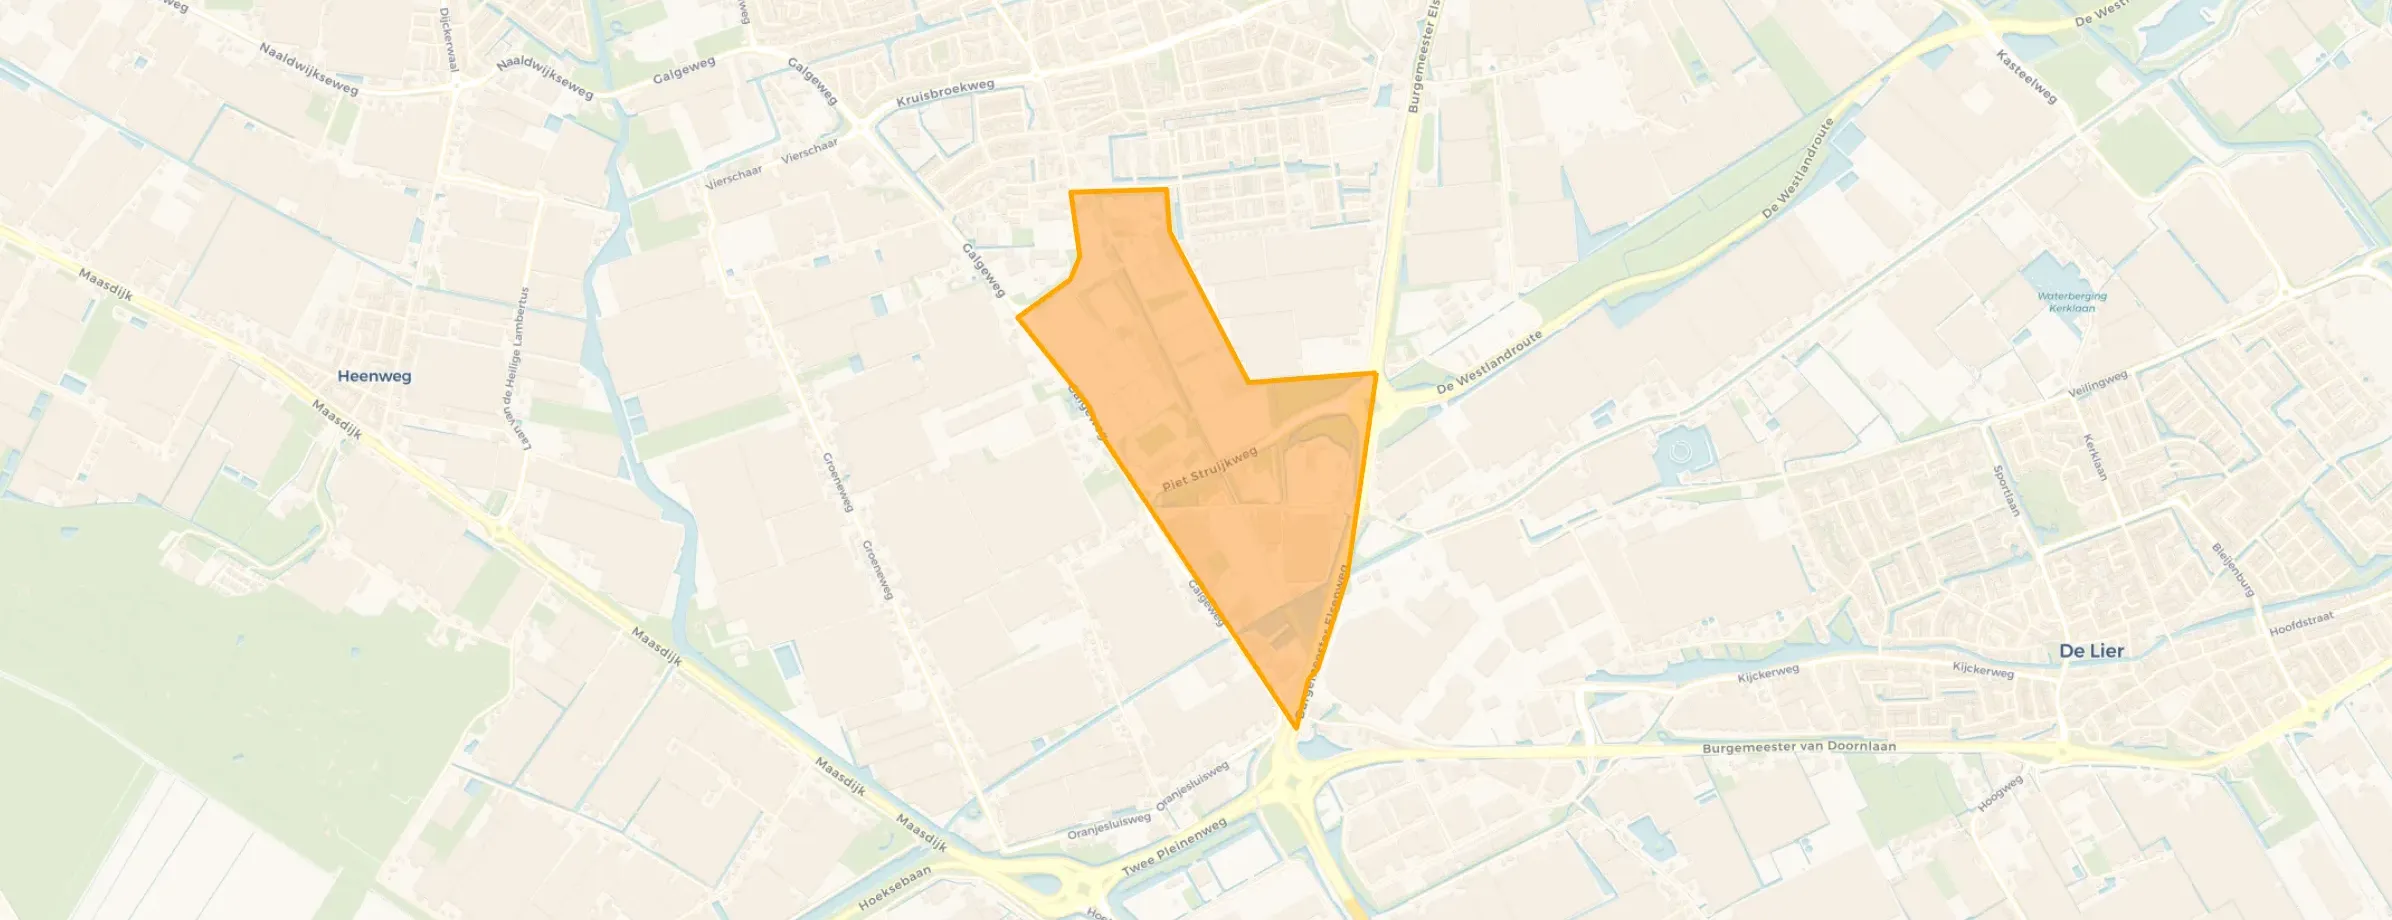
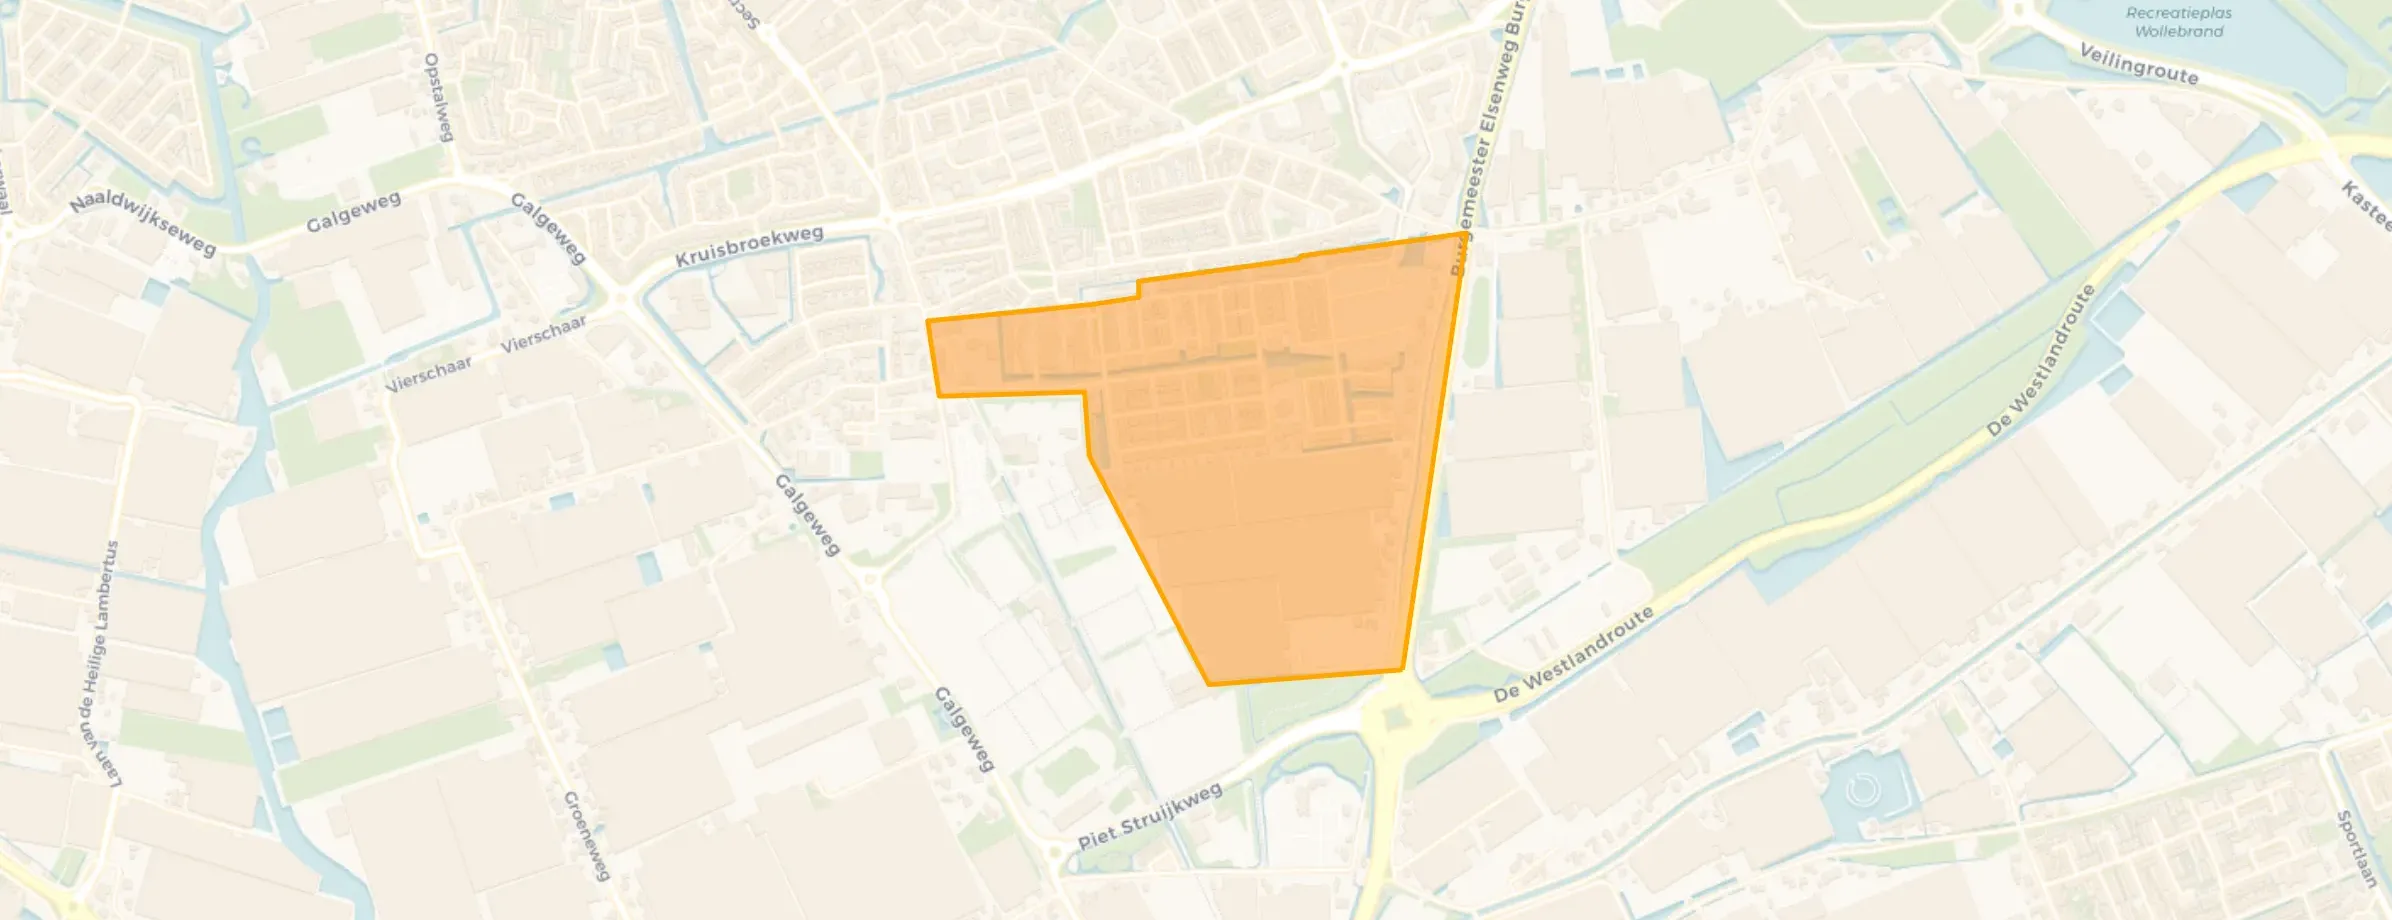
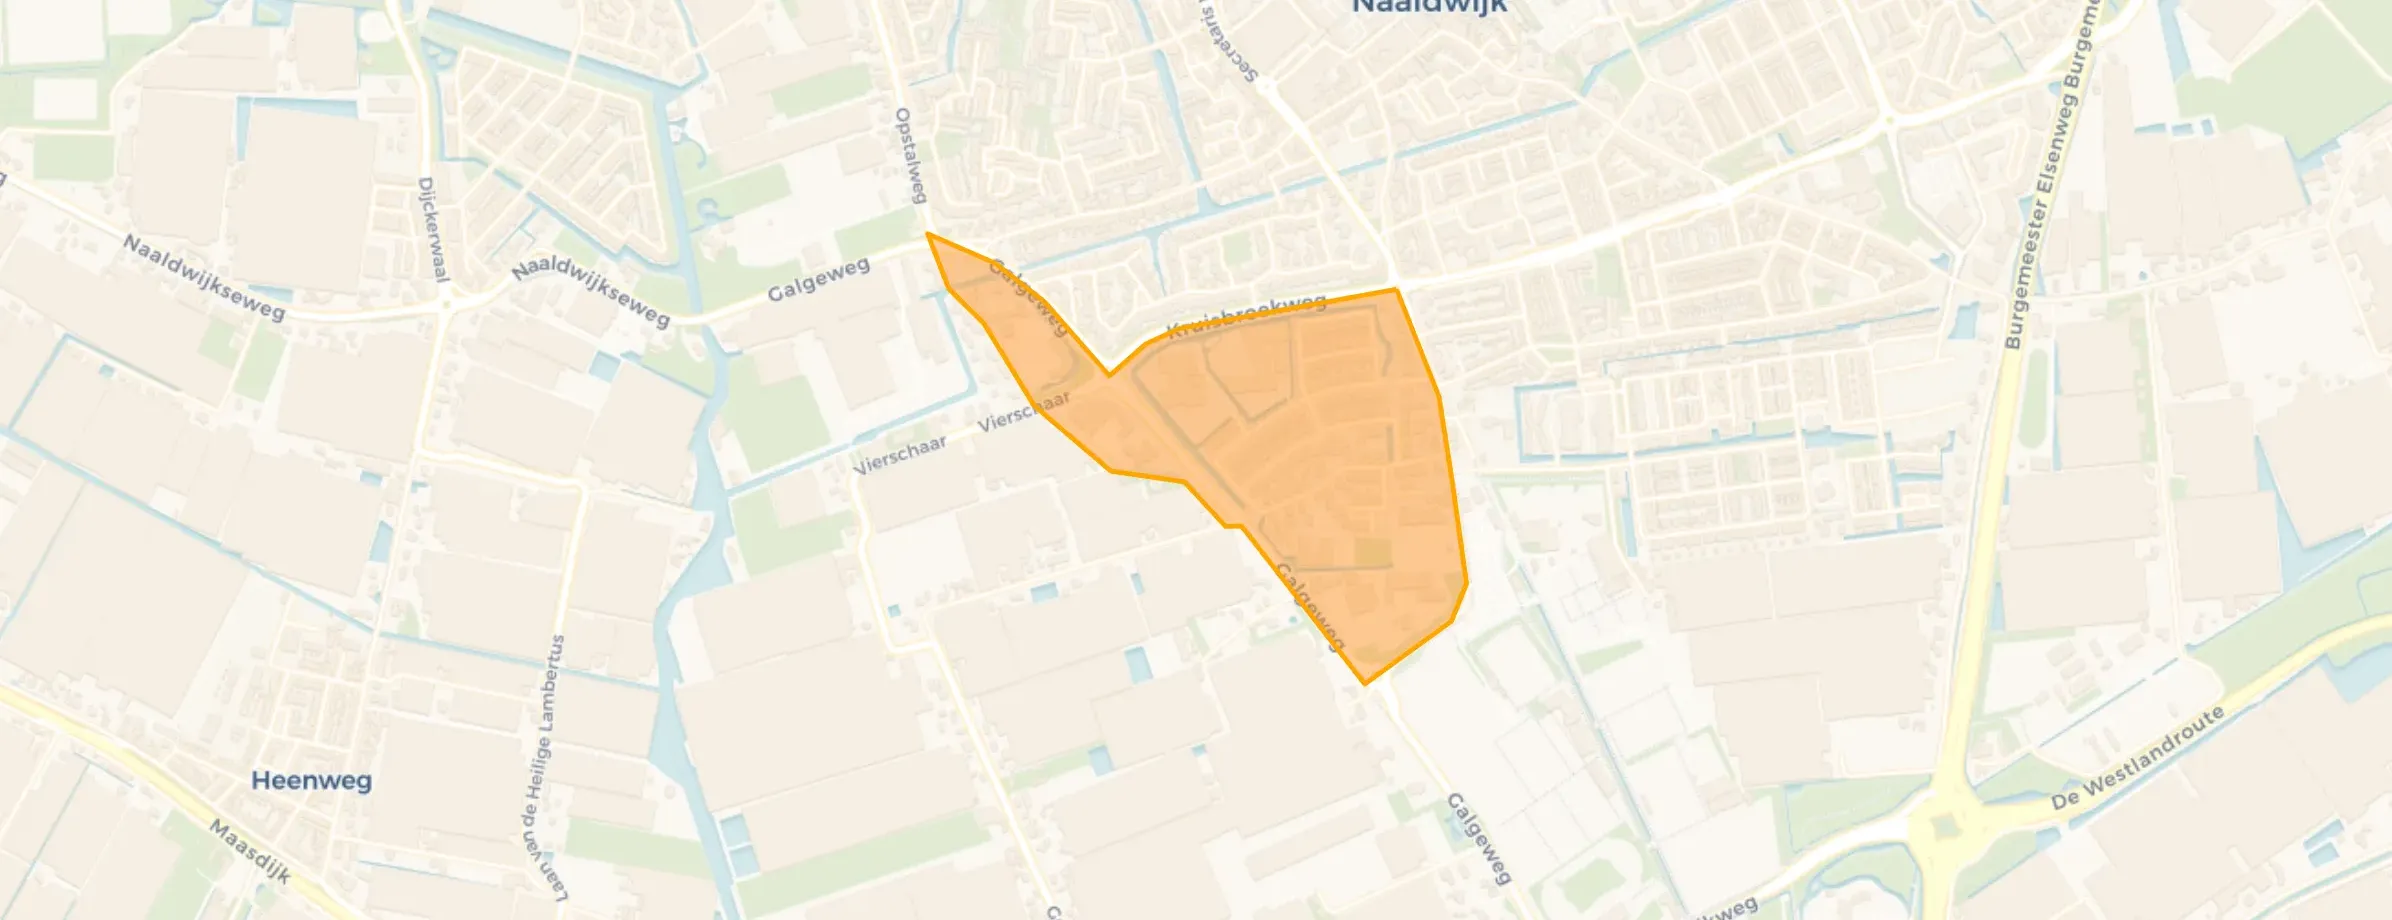
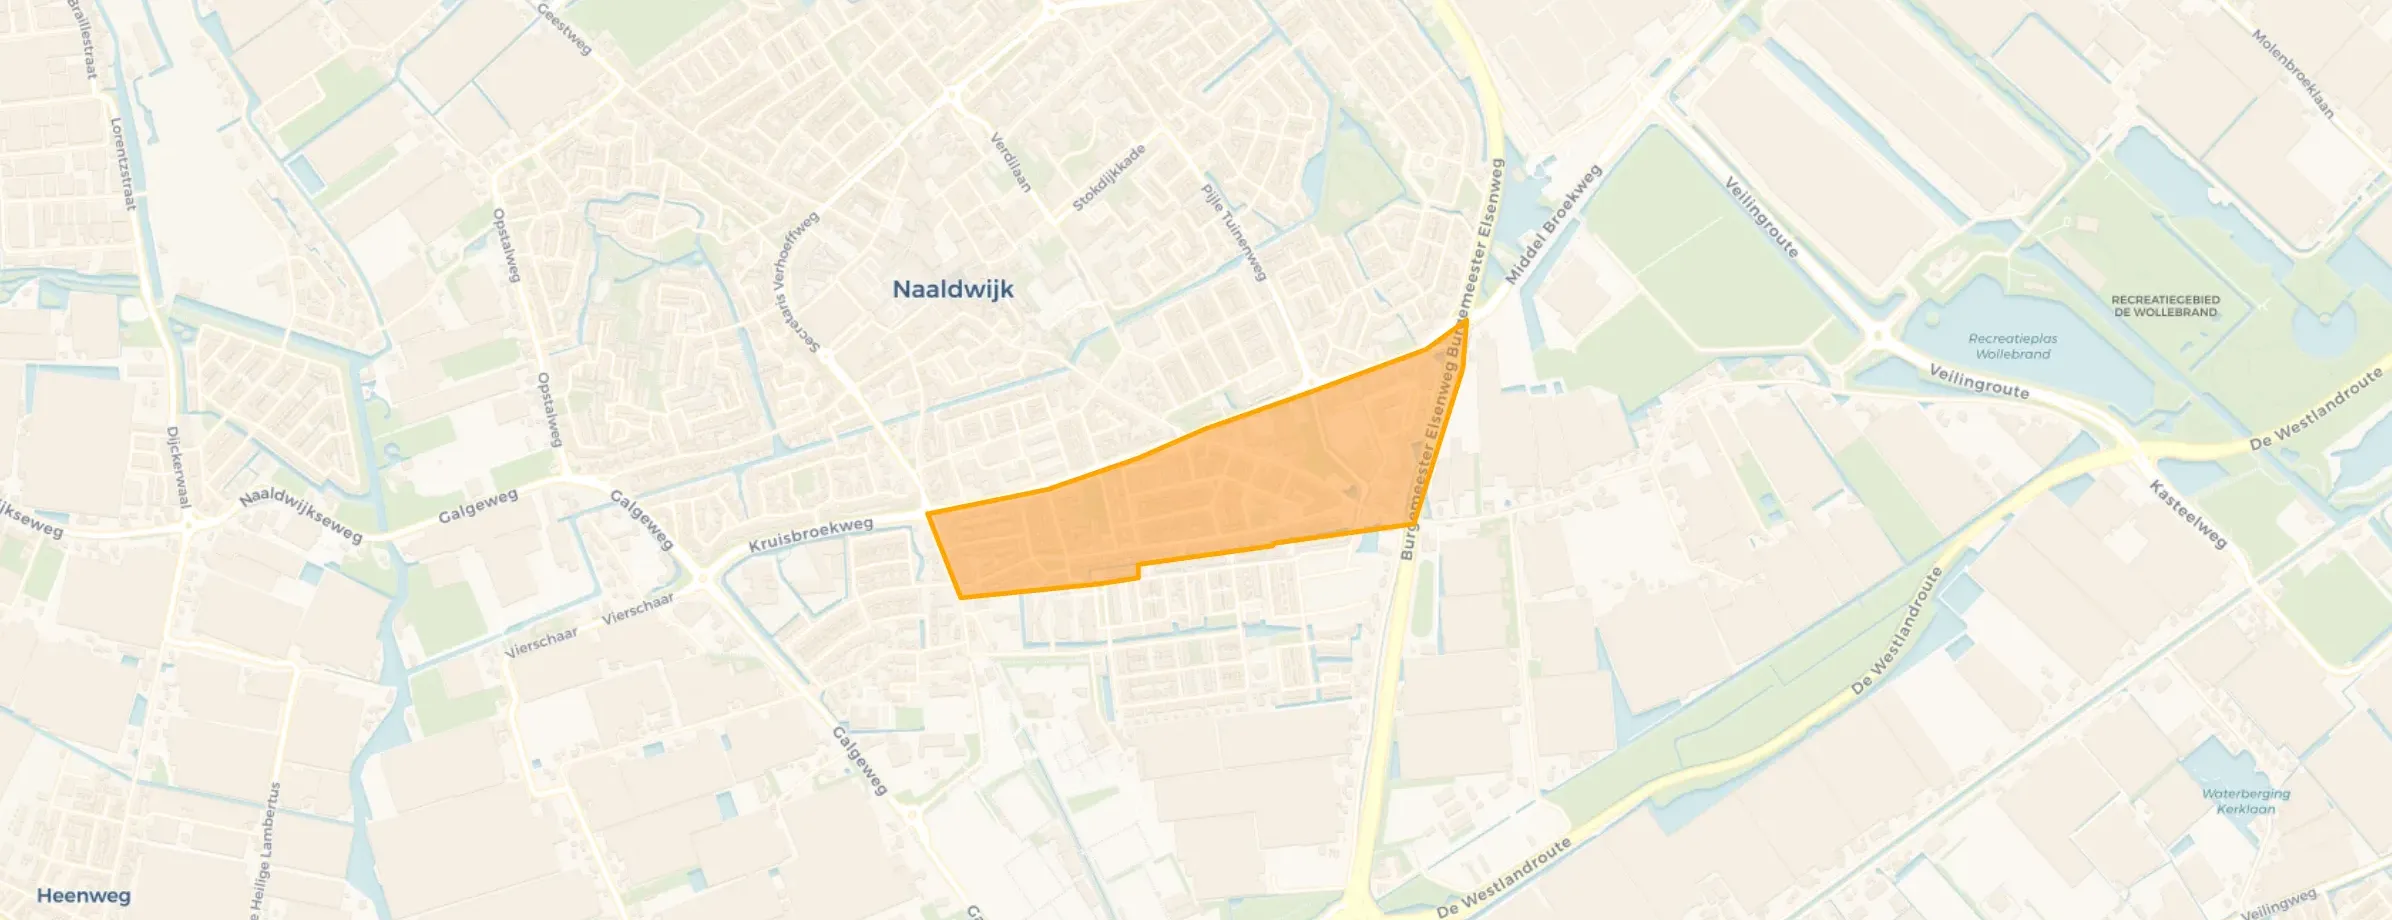
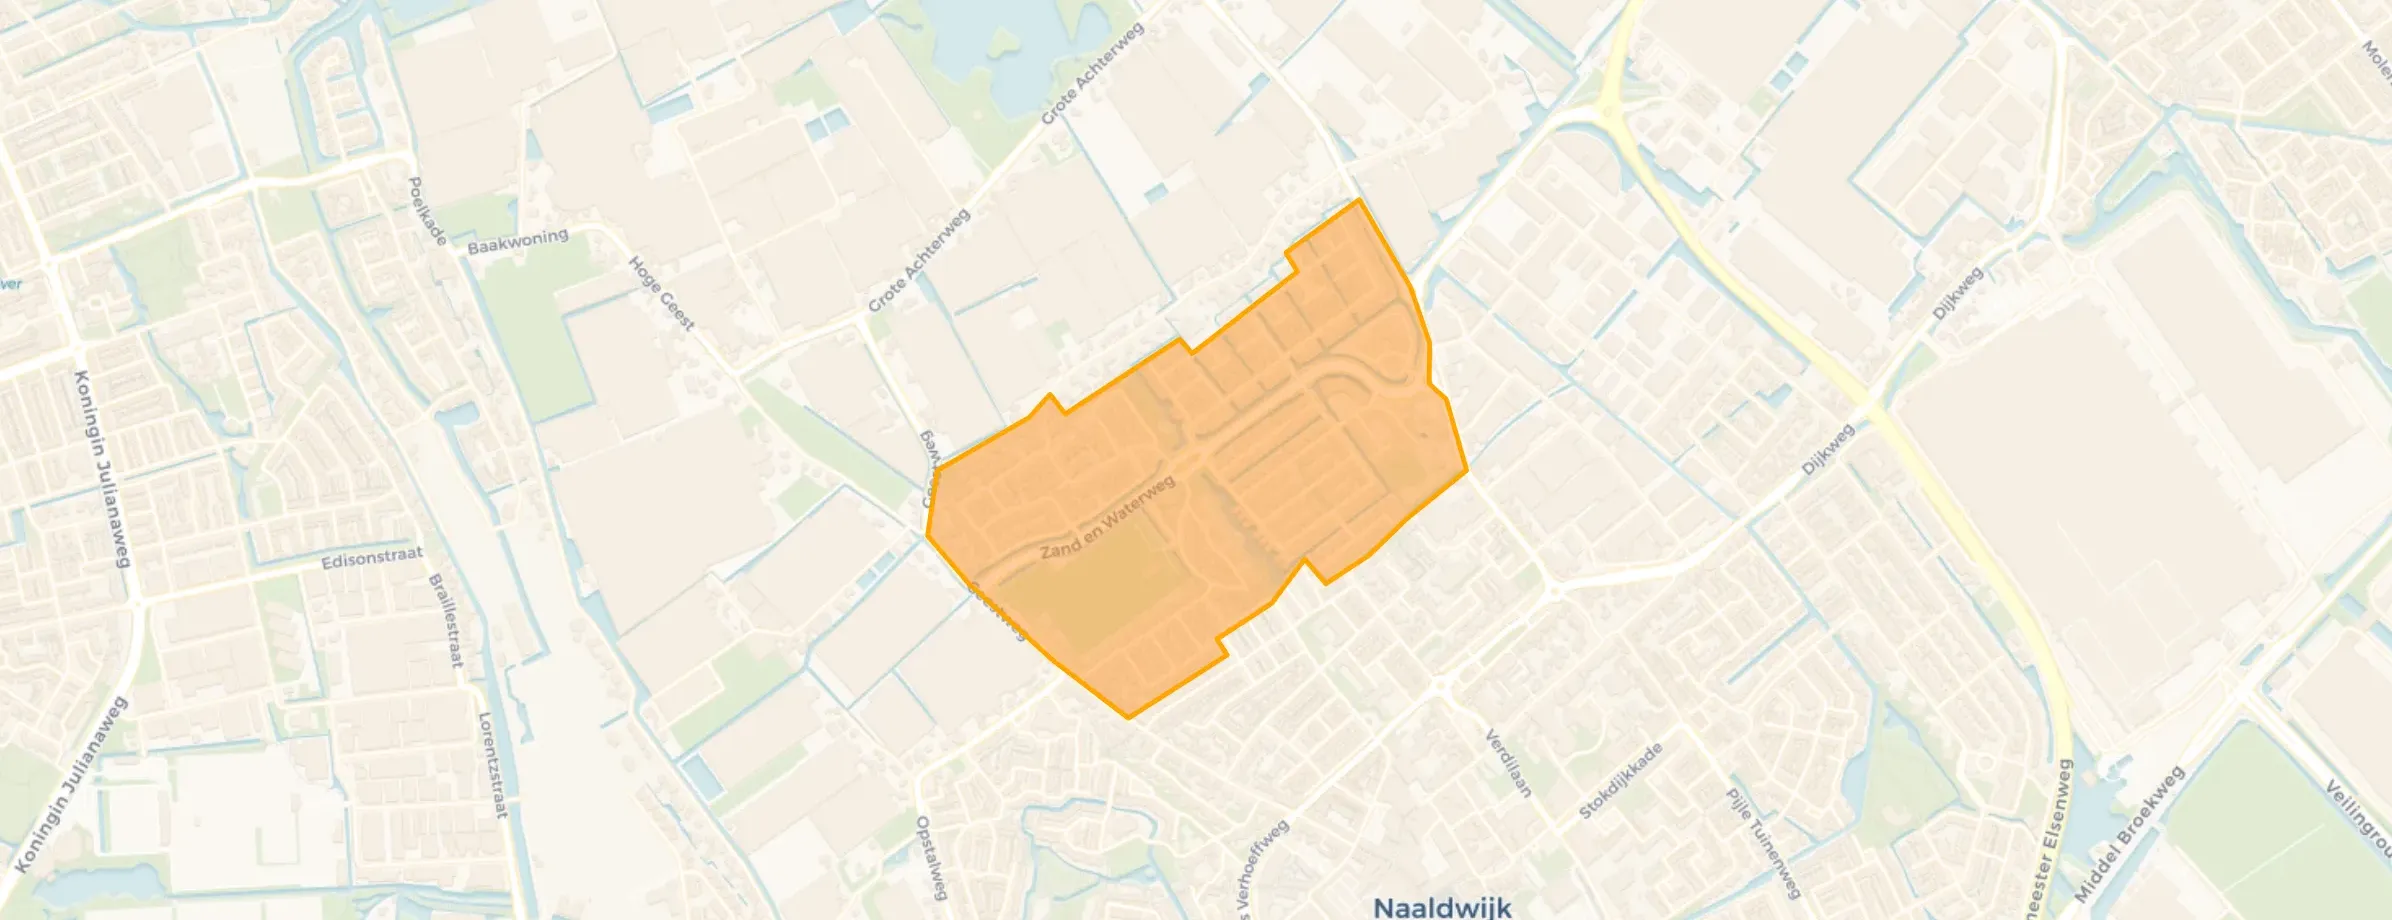
Naaldwijk is located in the province of Zuid-Holland, in the municipality of Westland The district has a total area of 949 hectares, of which 918 hectares are land and 31 hectares are water. The district is coded as WK178301. The postcode area is 2671AA-2673XA.
Naaldwijk has 22.945 residents. Of these, 49,8% are men and 50,2% are women. Most residents are 25 to 45 years (24,9%). The other age groups are 24,7% for '45 to 65 years', 23,1% for '65 years or older', 16,3% for '0 to 15 years' and 10,9% for '15 to 25 years'. Of the residents, 45,8% is unmarried, 42,5% is married, 6,6% is divorced and 5,1% is widowed. 18.710 residents originate from the Netherlands, 1.900 come from Europe and 2.335 come from countries outside Europe.
There are 10.015 households in Naaldwijk. 33,1% of these are single-person households, 31,5% households without children and 35,4% households with children. The average household size is 2,3 persons.
In Naaldwijk there are 18.300 income recipients. The average income per income recipient is €37.300, which is €1.500 (4%) higher than the national average of €35.800. Per resident, the average income is €31.100, which is €1.900 (7%) higher than the national average of €29.200. Most residents of Naaldwijk are educated to an intermediate level. 42,8% have an intermediate education (HAVO, VWO or MBO 2-4), 28,6% have a university or higher professional education (HBO/WO) and 28,6% have a lower education (VMBO or MBO 1).
Of the 22.945 residents, around 70% are in paid employment, which amounts to 16.062 people. This is 5% higher than the national average of 65%. The majority of workers are in salaried employment (82%), while 18% are self-employed. In Naaldwijk, 26% of residents receive a benefit. The largest group is those receiving a state pension (AOW). 4.790 people receive this benefit.
In Naaldwijk there are 9.663 homes with an average assessed value (WOZ) of €445.000. Of these, around 97% are occupied and 3% unoccupied. Most homes are owner-occupied. This amounts to 33% rental homes and 67% owner-occupied homes. Of the homes, 67% privately owned, 25% owned by housing associations and 8% owned by other landlords. The most common construction periods in Naaldwijk are 2010-2020 (17%) and 1950-1970 (16%).
There are currently no homes for sale in Naaldwijk. The most recently listed home is Corbulolaan 62 by Van den Akker NVM Makelaars op Funda. No homes were sold in Naaldwijk over the past year.
There are currently no homes for rent in Naaldwijk. The most recent home is Europa 293, offered by www.woonnet-haaglanden.nl. No homes were let in Naaldwijk over the past year.
No recent rental data available for Naaldwijk.
In Naaldwijk there are 10.301 addresses with a registered energy label. The most common labels are A (30%), C (29%) and B (15%). On average, an address in Naaldwijk uses 2.810 kWh of electricity per year. This is in line with the national average. With an annual consumption of 880 m³ per address, natural gas consumption is 31% below the national average of 1.280 m³.
Few problems here. Only parking on the street is difficult.
Auto-translated to English by AIFew problems here. Last armed robbery at the Chinese takeaway was about 10 years ago, I think. And the boss of the kebab shop on the corner of the street was arrested for drug trafficking, also years ago. They are doing a major renovation on a building two houses down from me. I'm curious what will go in there.
Auto-translated to English by AIDecent neighbourhood with nice playgrounds. Parks are poorly maintained and very monotonous in terms of planting. There is quite a lot of litter in the area and apart from two primary schools, there are hardly any facilities nearby.
Auto-translated to English by AINice neighbours Nice place A park in the neighbourhood A school A barber and a snack bar Nice environment People help each other
Auto-translated to English by AIplus: nice living close to beach and forest, park leads to beach good accessibility shops nearby minus: public transport
Auto-translated to English by AIYes, I think it's a messy neighbourhood, a lot of nuisance
Auto-translated to English by AIOver the past year a home for sale in Naaldwijk was listed for an average of €621,750 (€4,904 per m²). Last quarter prices rose by 8%.
A rental home in Naaldwijk cost an average of €1,791 per month (€17 per m²).
Residents give Naaldwijk a 7.4 out of 10 based on 6 reviews. The strongest score is for housing (8.1), the weakest for amenities (6.6).
Wijk Naaldwijk has 22,945 residents. Many families: 35% of the households have children.
The housing supply in Naaldwijk is remarkably efficient: 63% has an A, A+ or B label. The average natural gas consumption per household is 880 m³ per year.
From Naaldwijk you can on average reach a supermarket at 0.9 km, a GP at 0.9 km, a railway station at 11.3 km, a primary school at 0.7 km (as the crow flies, source: CBS).
Right now you will find 82 homes for sale and 7 homes for rent in Naaldwijk.
