District in Rheden
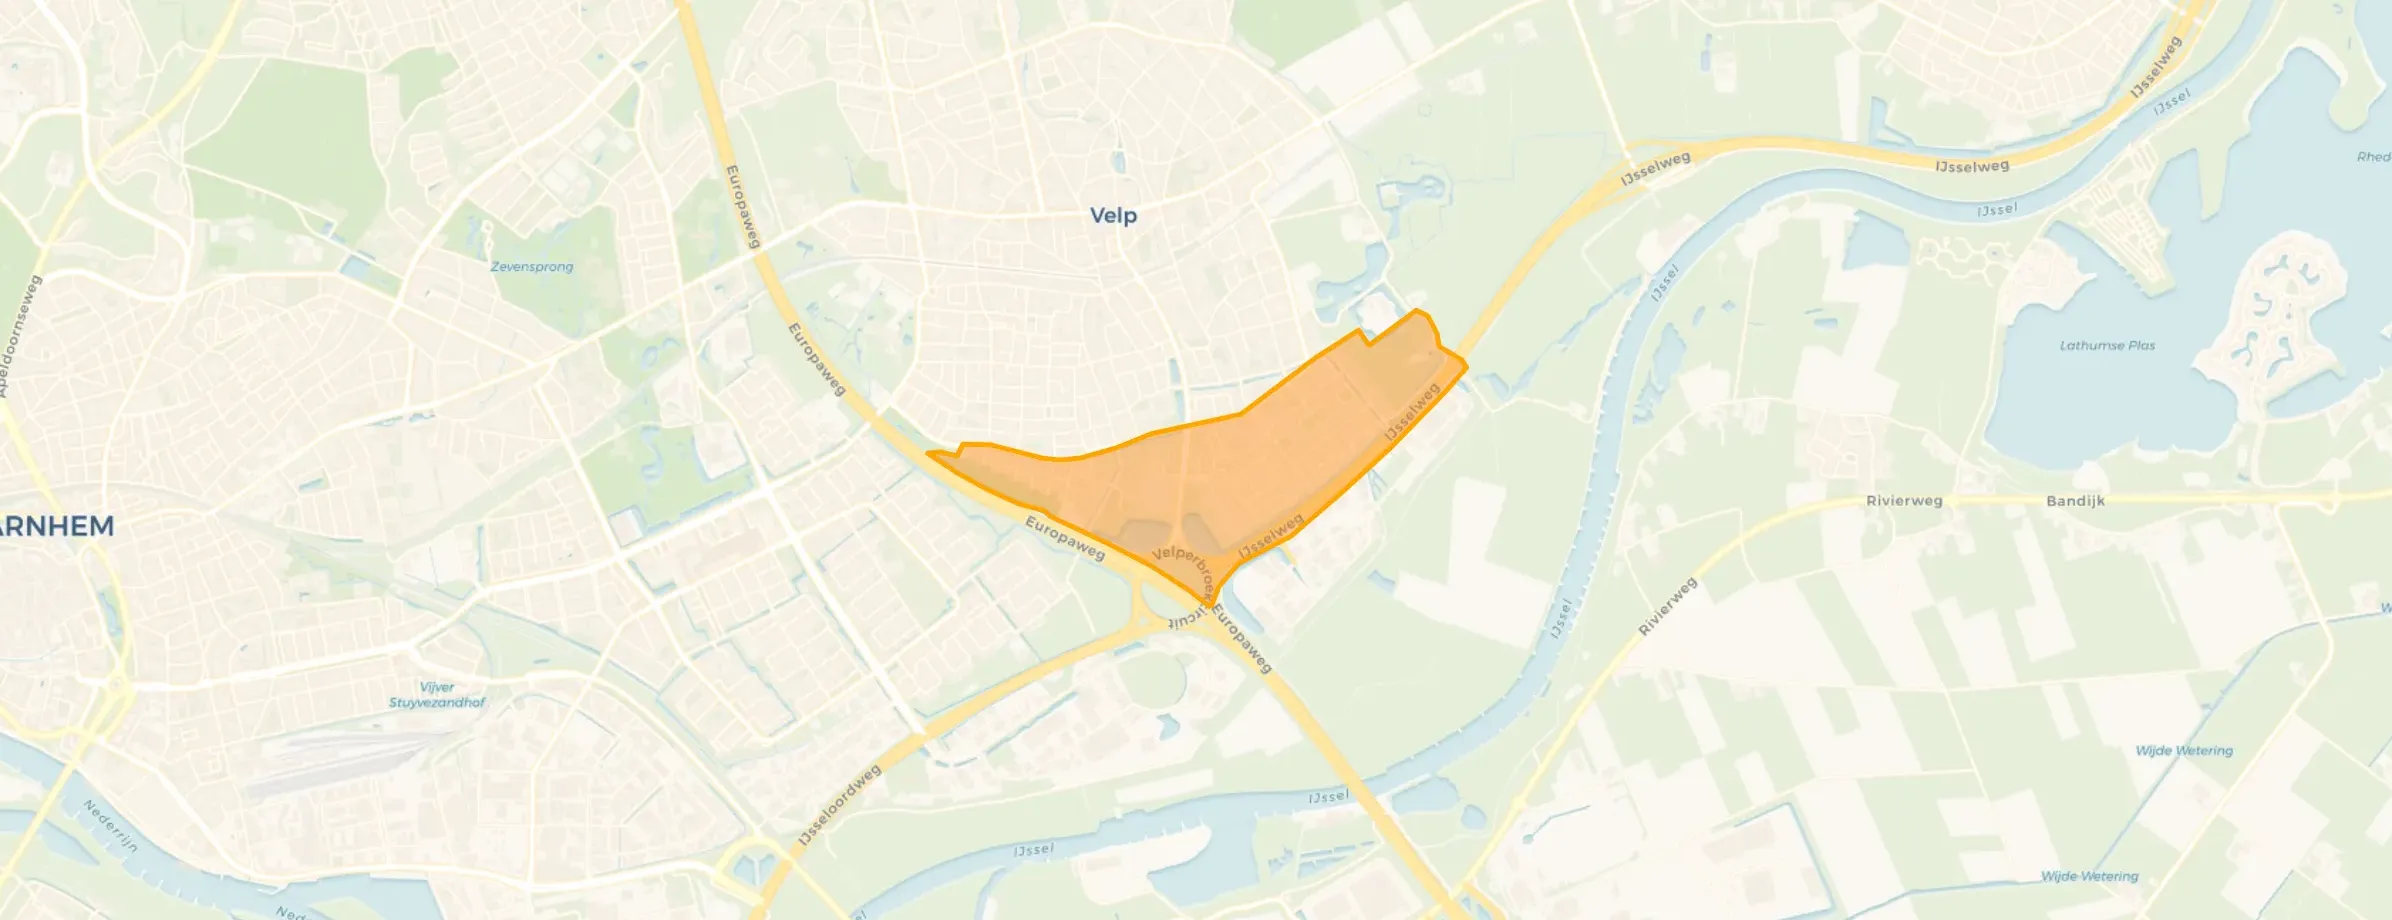
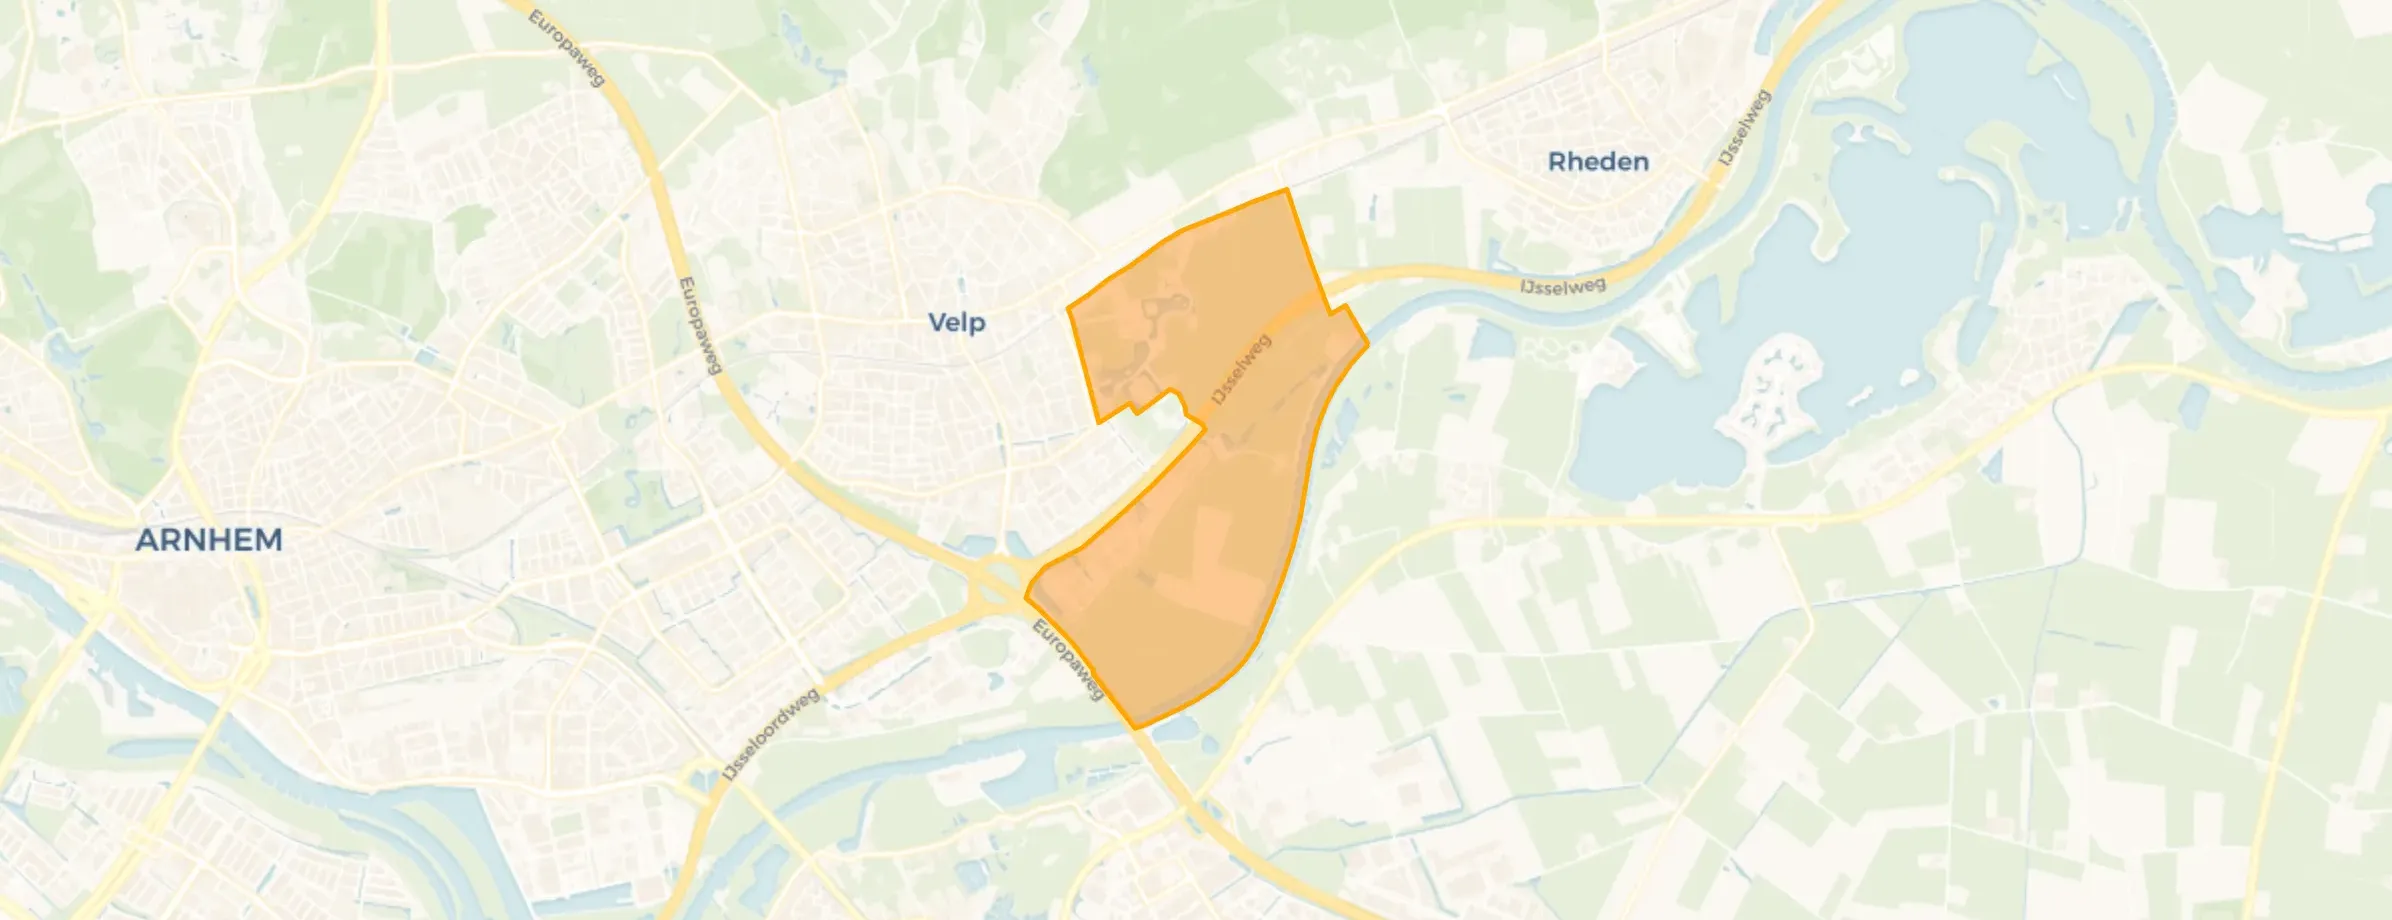
Velp is located in the province of Gelderland, in the municipality of Rheden The district has a total area of 1.102 hectares, of which 1.069 hectares are land and 33 hectares are water. The district is coded as WK027502. The postcode area is 6881AA-6883KA.
Velp has 18.455 residents. Of these, 48,7% are men and 51,3% are women. Most residents are 65 years or older (27,4%). The other age groups are 25,5% for '45 to 65 years', 22,1% for '25 to 45 years', 13,2% for '0 to 15 years' and 11,8% for '15 to 25 years'. Of the residents, 48,9% is unmarried, 34,5% is married, 9,2% is divorced and 7,5% is widowed. 14.220 residents originate from the Netherlands, 1.490 come from Europe and 2.745 come from countries outside Europe.
There are 9.485 households in Velp. 48,6% of these are single-person households, 26,4% households without children and 25,0% households with children. The average household size is 1,9 persons. The national average is 2,1 persons.
In Velp there are 14.900 income recipients. The average income per income recipient is €41.900, which is €300 (1%) lower than the national average of €42.200. Per resident, the average income is €35.500, which is €600 (2%) higher than the national average of €34.900. Most residents of Velp are highly educated. 39,0% have a university or higher professional education (HBO/WO), 36,4% have an intermediate education (HAVO, VWO or MBO 2-4) and 24,6% have a lower education (VMBO or MBO 1).
Of the 18.455 residents, around 68% are in paid employment, which amounts to 12.549 people. This is 4% lower than the national average of 72%. The majority of workers are in salaried employment (81%), while 19% are self-employed. In Velp, 34% of residents receive a benefit. The largest group is those receiving a state pension (AOW). 4.600 people receive this benefit.
In Velp there are 9.155 homes with an average assessed value (WOZ) of €401.000. Of these, around 95% are occupied and 5% unoccupied. In Velp there are roughly as many rental as owner-occupied homes. This amounts to 48% rental homes and 52% owner-occupied homes. Of the homes, 52% privately owned, 26% owned by housing associations and 22% owned by other landlords. The most common construction periods in Velp are 1950-1970 (30%) and 1970-1980 (23%).
There are currently no homes for sale in Velp. The most recently listed home is Zuider Parallelweg 26A by Hans Janssen Makelaars. No homes were sold in Velp over the past year.
There are currently no homes for rent in Velp. The most recent home is Parkstraat 55-2B, offered by NMG Wonen kantoor Nijmegen op Funda. No homes were let in Velp over the past year.
No recent rental data available for Velp.
In Velp there are 5.513 addresses with a registered energy label. The most common labels are C (24%), A (22%) and B (13%). On average, an address in Velp uses 2.540 kWh of electricity per year. This is 0% below the national average of 2.550 kWh. Natural gas consumption, at 980 m³ per year, is 23% above the national average of 800 m³.
We've been living here for quite a while since 2003, the neighbourhood is being flattened
Auto-translated to English by AINot much privacy
Auto-translated to English by AIVelp Noord is a nice neighbourhood to grow up in. It's quiet, yet everything is close by. The playground is always busy with children, and the park is perfect for a bike ride or to hang out with friends. There are many green spaces, so it's nice for walking, especially in the summer. The people are generally friendly, though you don't know everyone. What I really like is that you can easily get to the city, but it's not too busy. You do notice that more and more new houses are being built, which changes the atmosphere a bit, but I think it's a good change.
Auto-translated to English by AIEver since I moved here, everything is right at hand. The people are nice, facilities are top-notch! And since I'm a student, having 4 supermarkets within cycling distance is ideal for bargain hunting! I'm completely satisfied and definitely don't want to go back home.
Auto-translated to English by AII think Velp is fine. Also to live in. But not much nature. You would have to cycle to Rheden for real forest. Clean in that respect. And safety is there too.
Auto-translated to English by AIQuiet neighbourhood, nice neighbours, quiet street with little traffic, shops within walking distance, good public transport, plenty of public green space
Auto-translated to English by AIGoing
Auto-translated to English by AIVery nice except for a few backfires that are very annoying.
Auto-translated to English by AIThe housing stock is mainly post-war — 52% was built between 1945 and 1990. In addition, the most common type is flats (40%).
Over the past year a home for sale in Velp was listed for an average of €508,594 (€4,224 per m²). Last quarter prices fell by 16%.
A rental home in Velp cost an average of €1,507 per month (€15 per m²).
Residents give Velp a 7.2 out of 10 based on 11 reviews. The strongest score is for education (8.0), the weakest for cleanliness (6.7).
From Velp you can on average reach a supermarket at 0.6 km, a GP at 1.3 km, a railway station at 1.2 km, a primary school at 0.6 km (as the crow flies, source: CBS).
Right now you will find 184 homes for sale and 25 homes for rent in Velp.