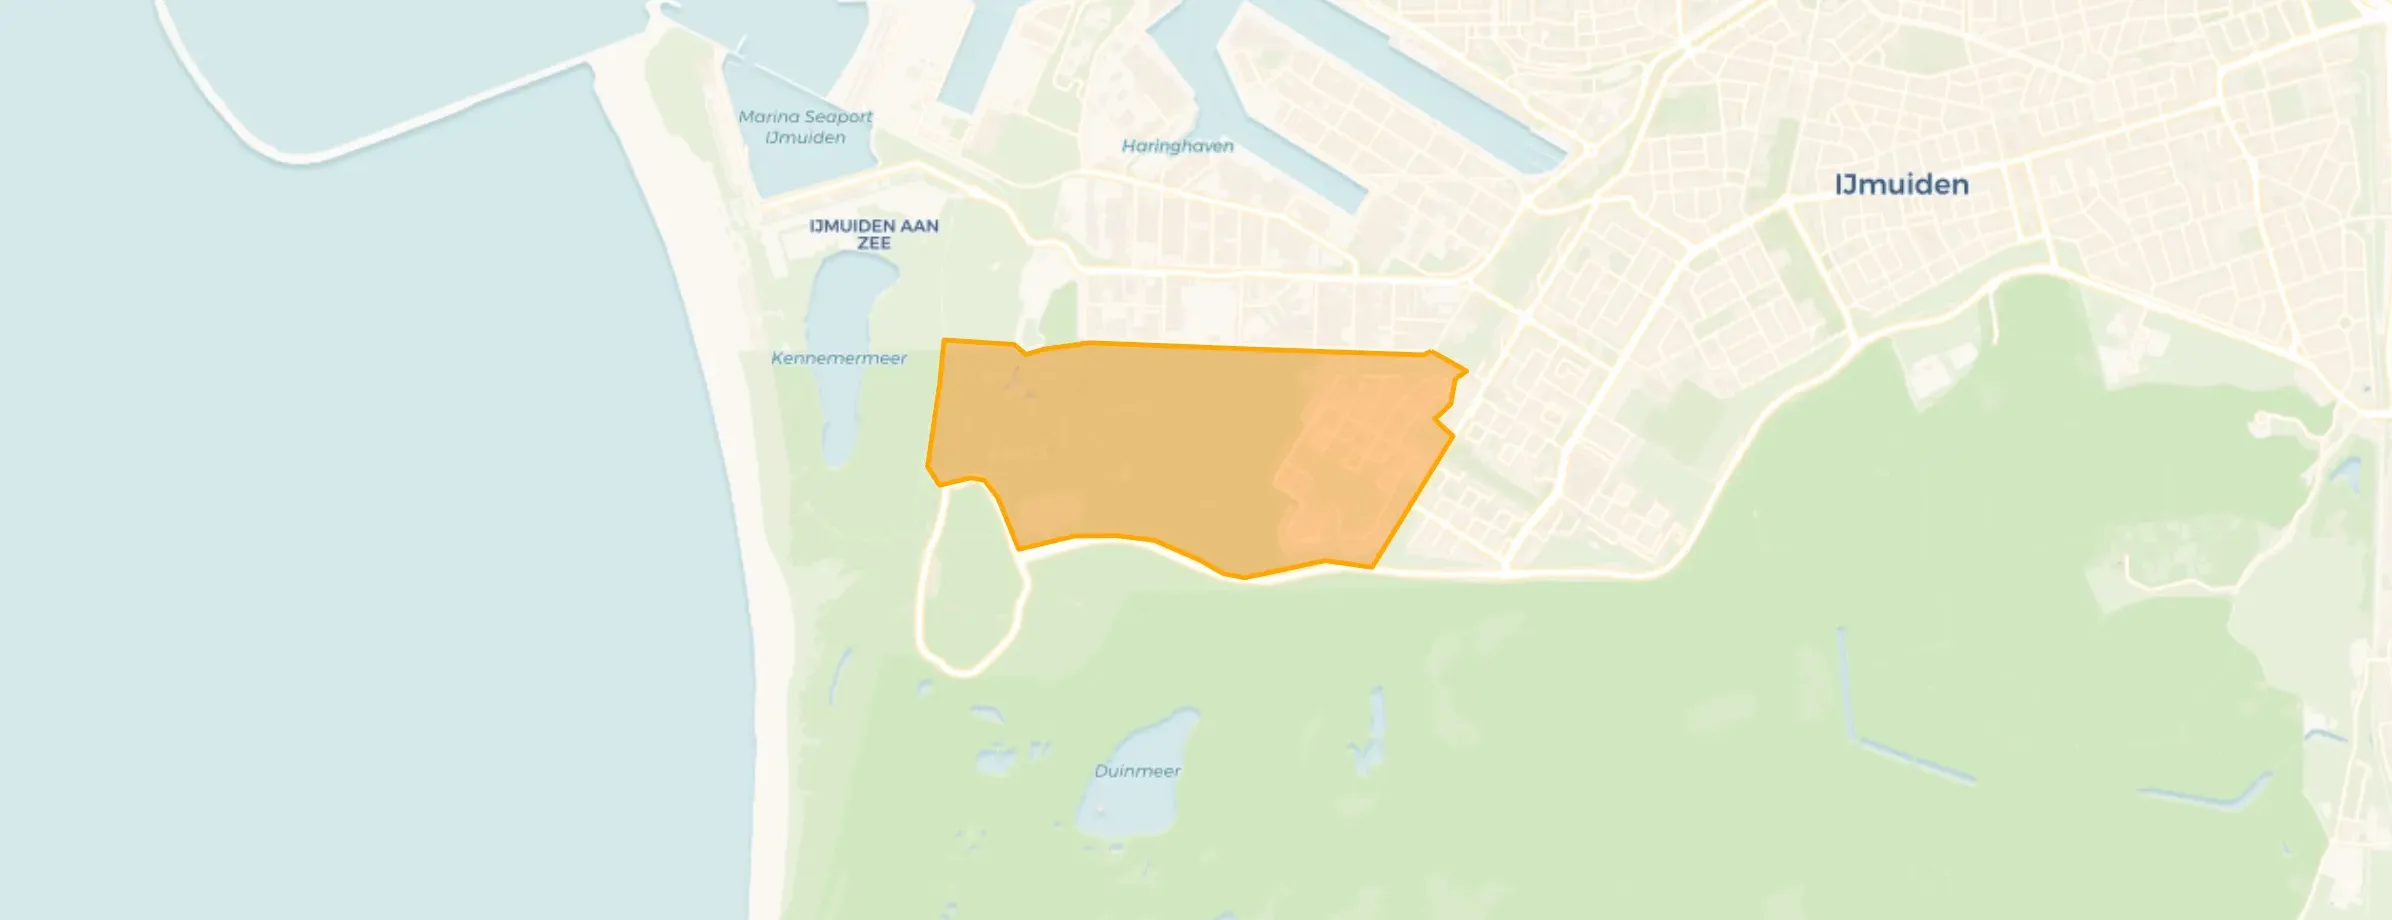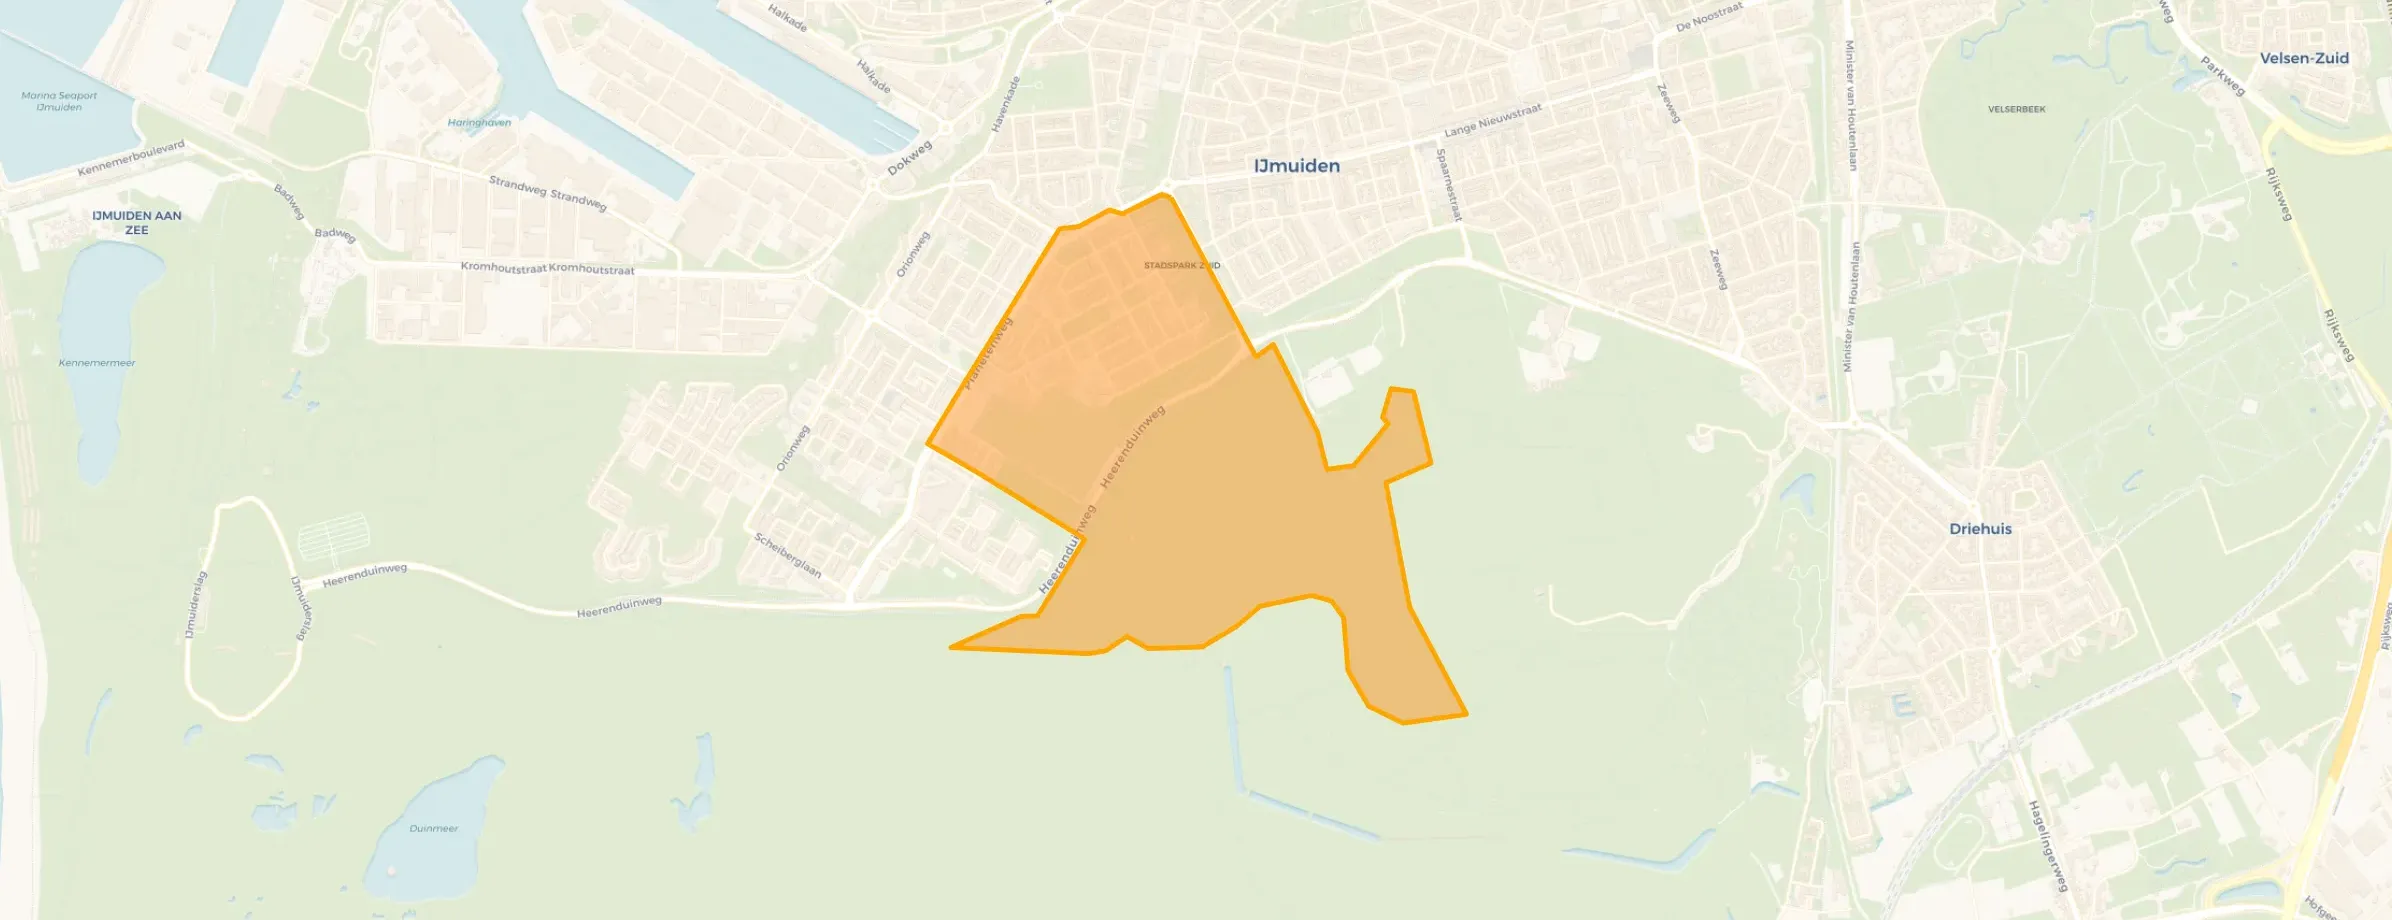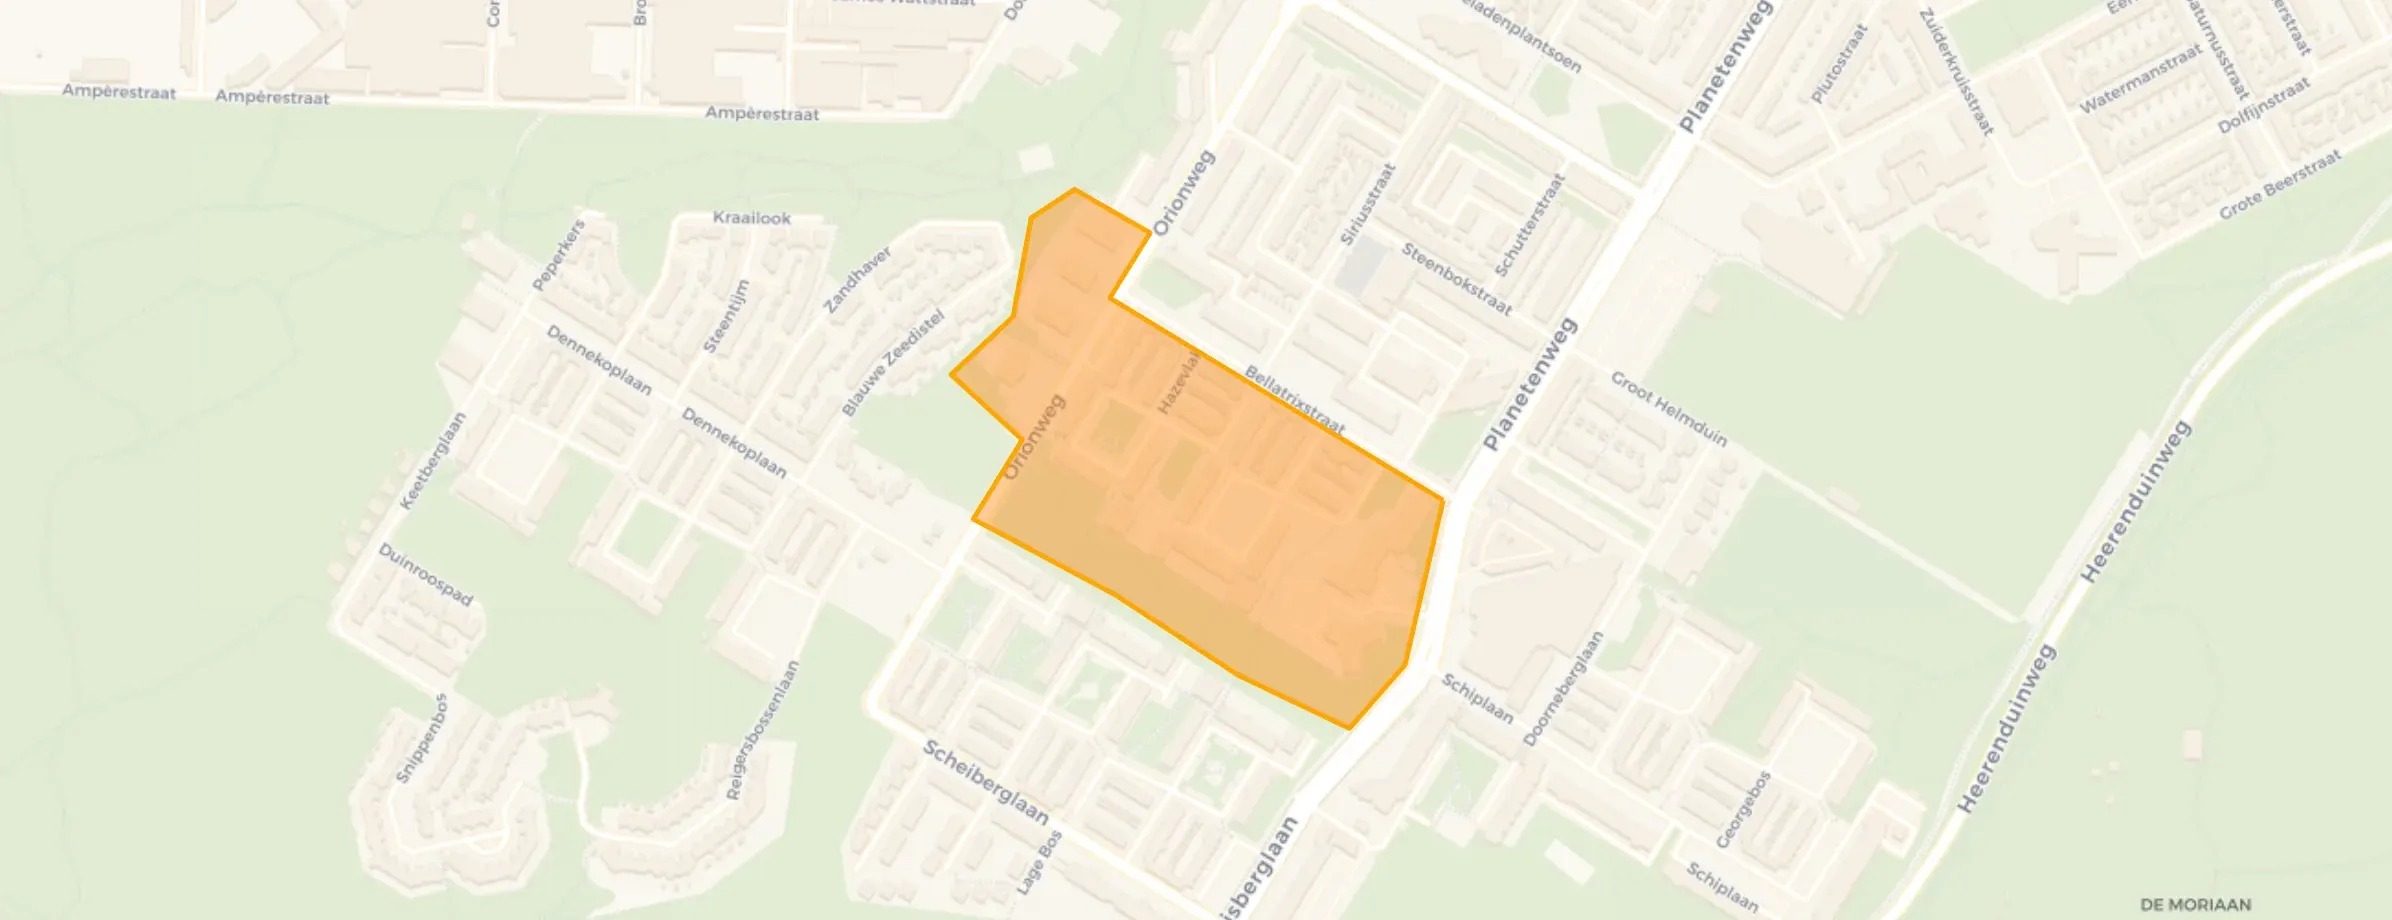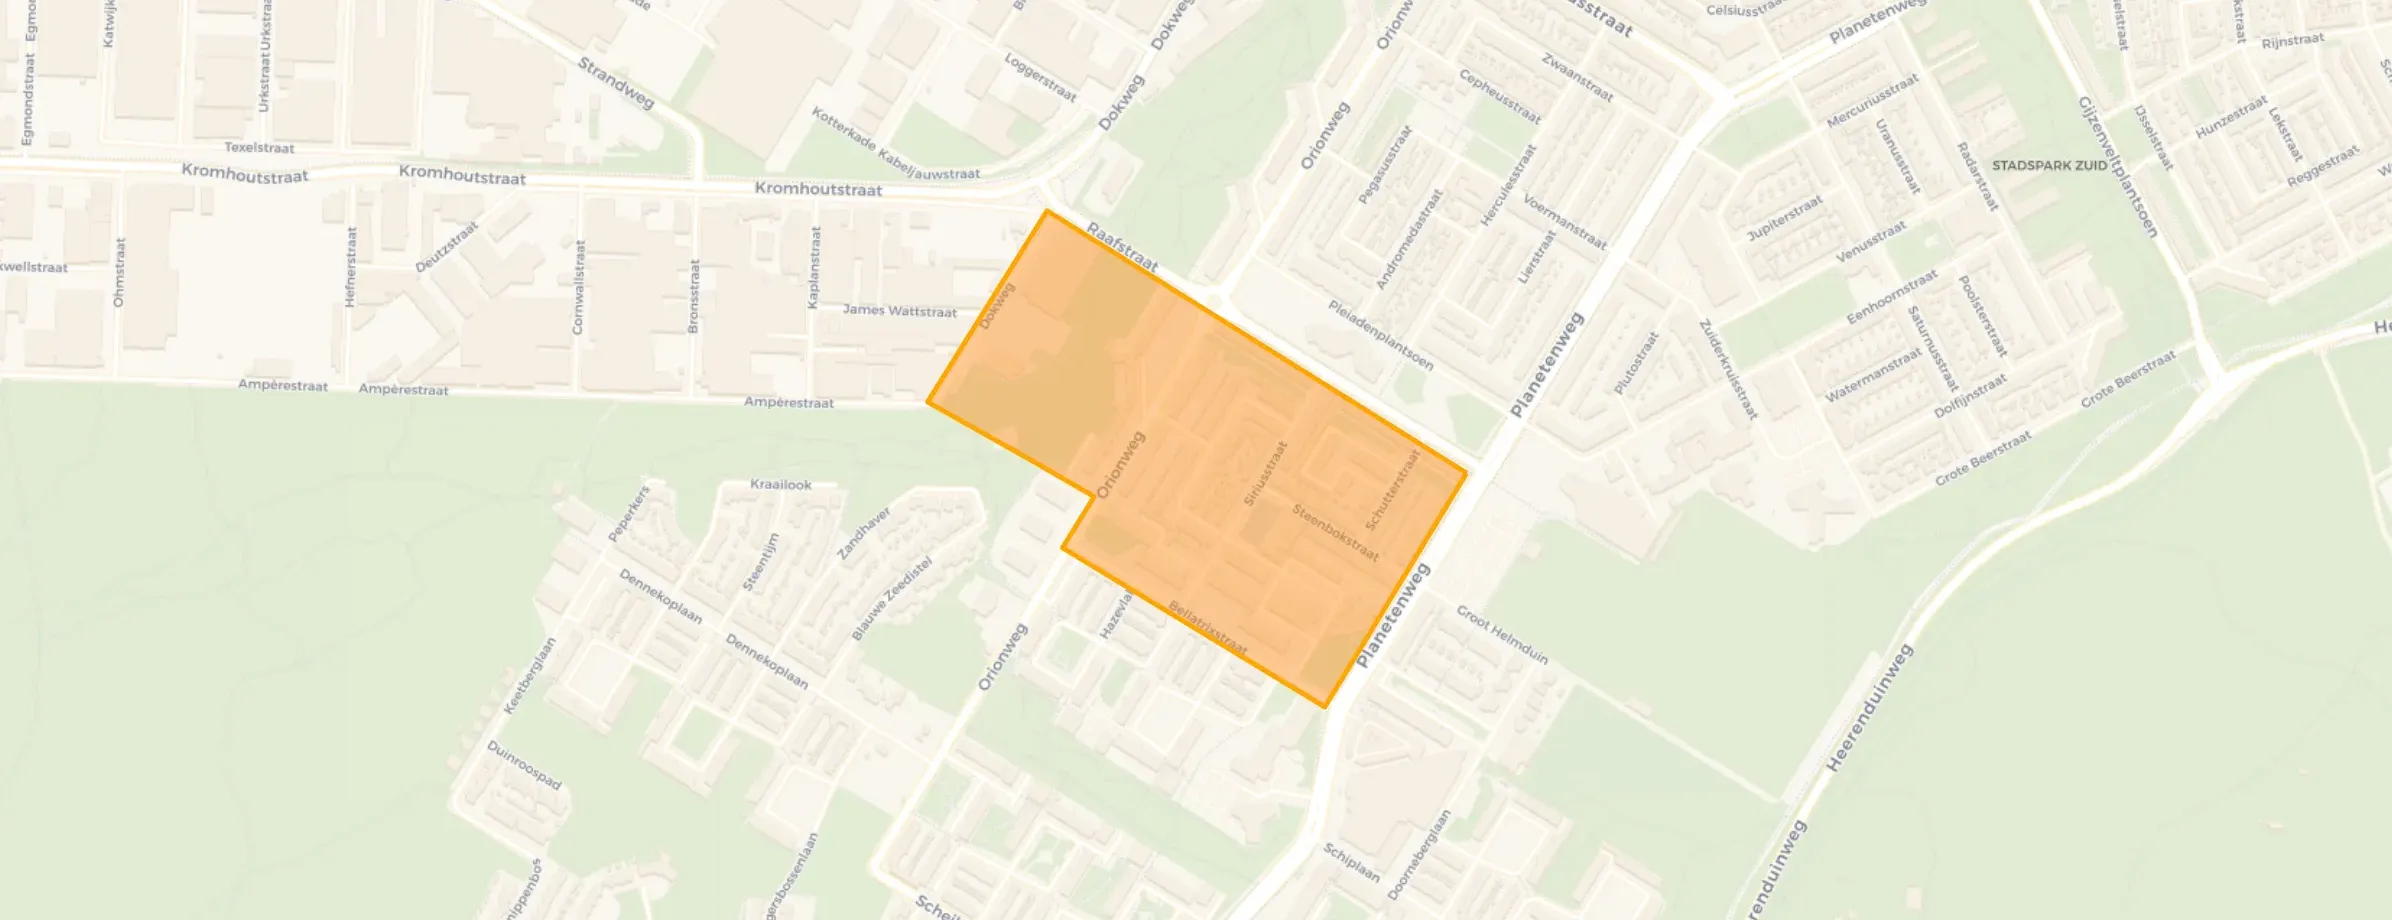
District in Velsen
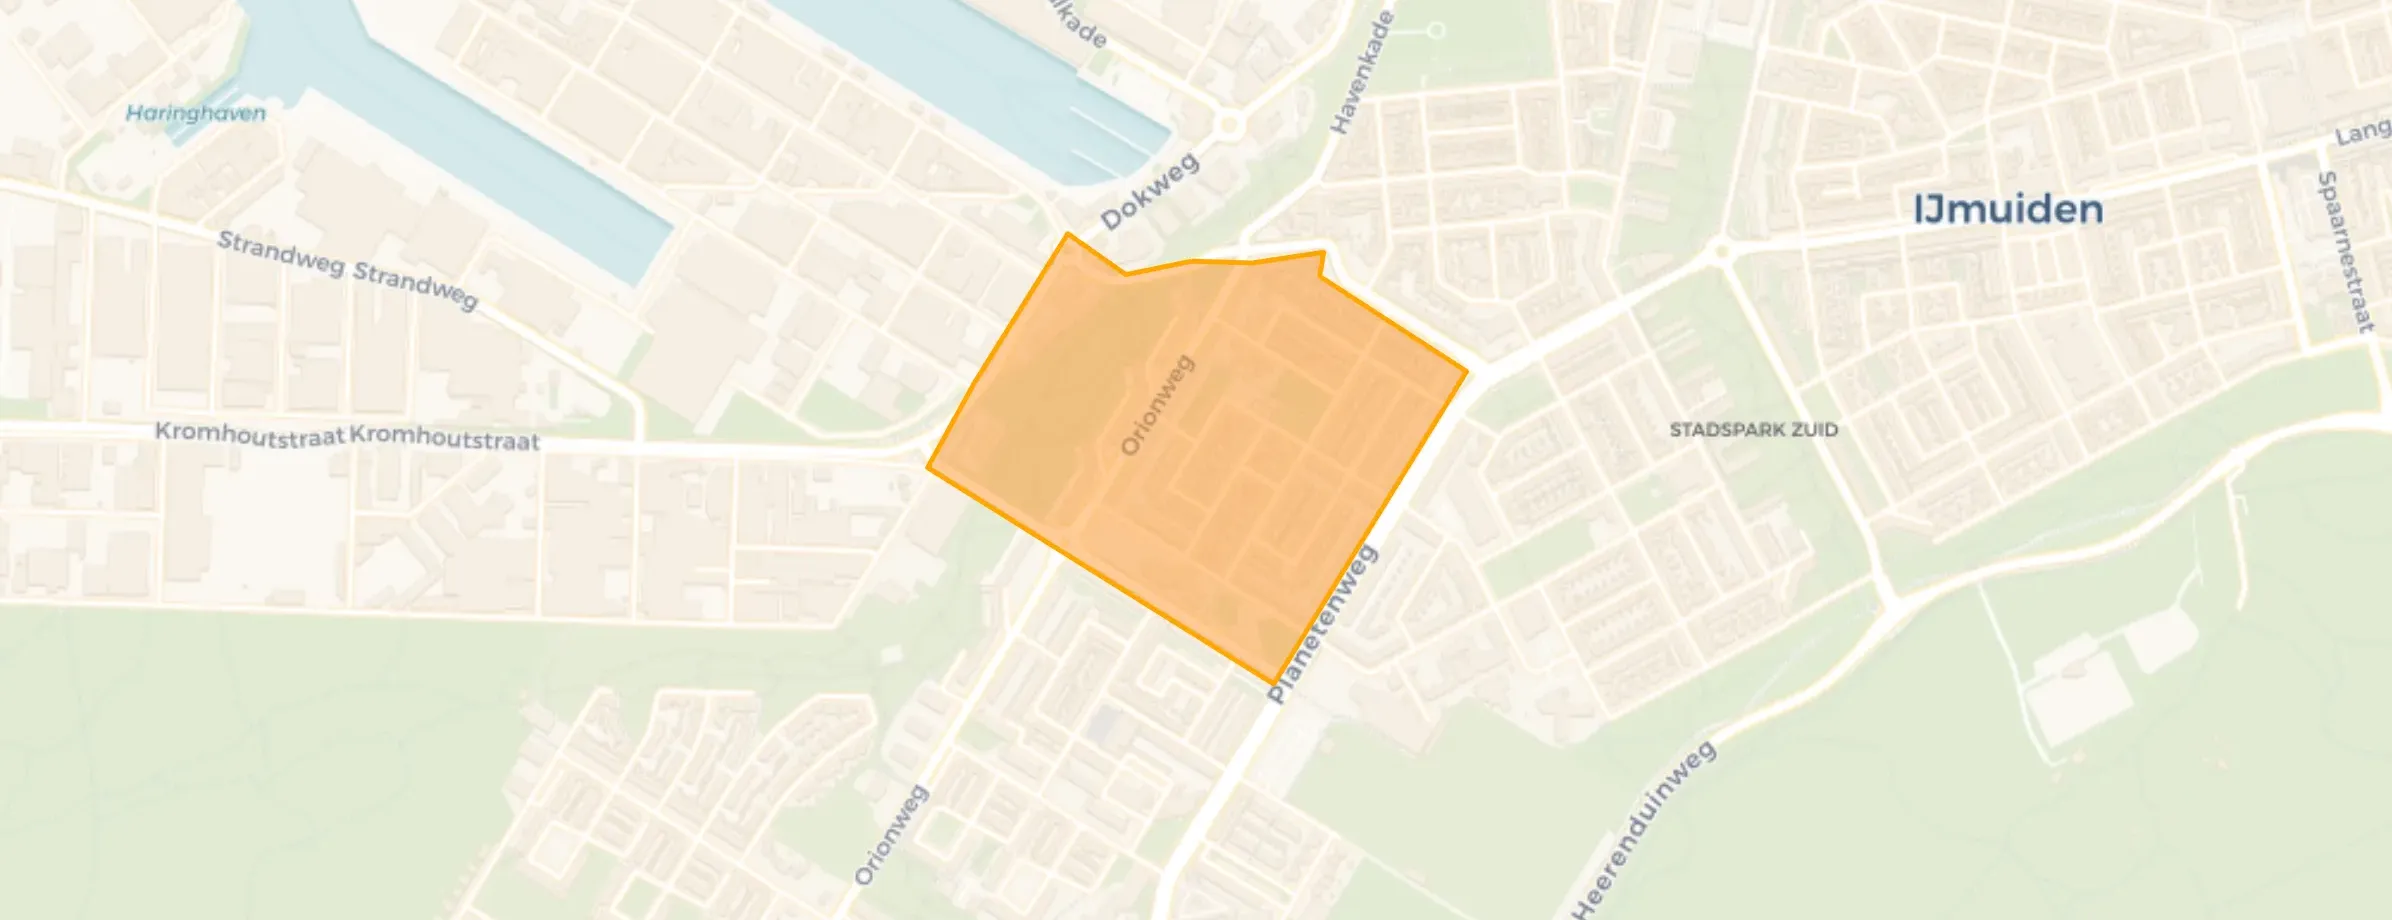
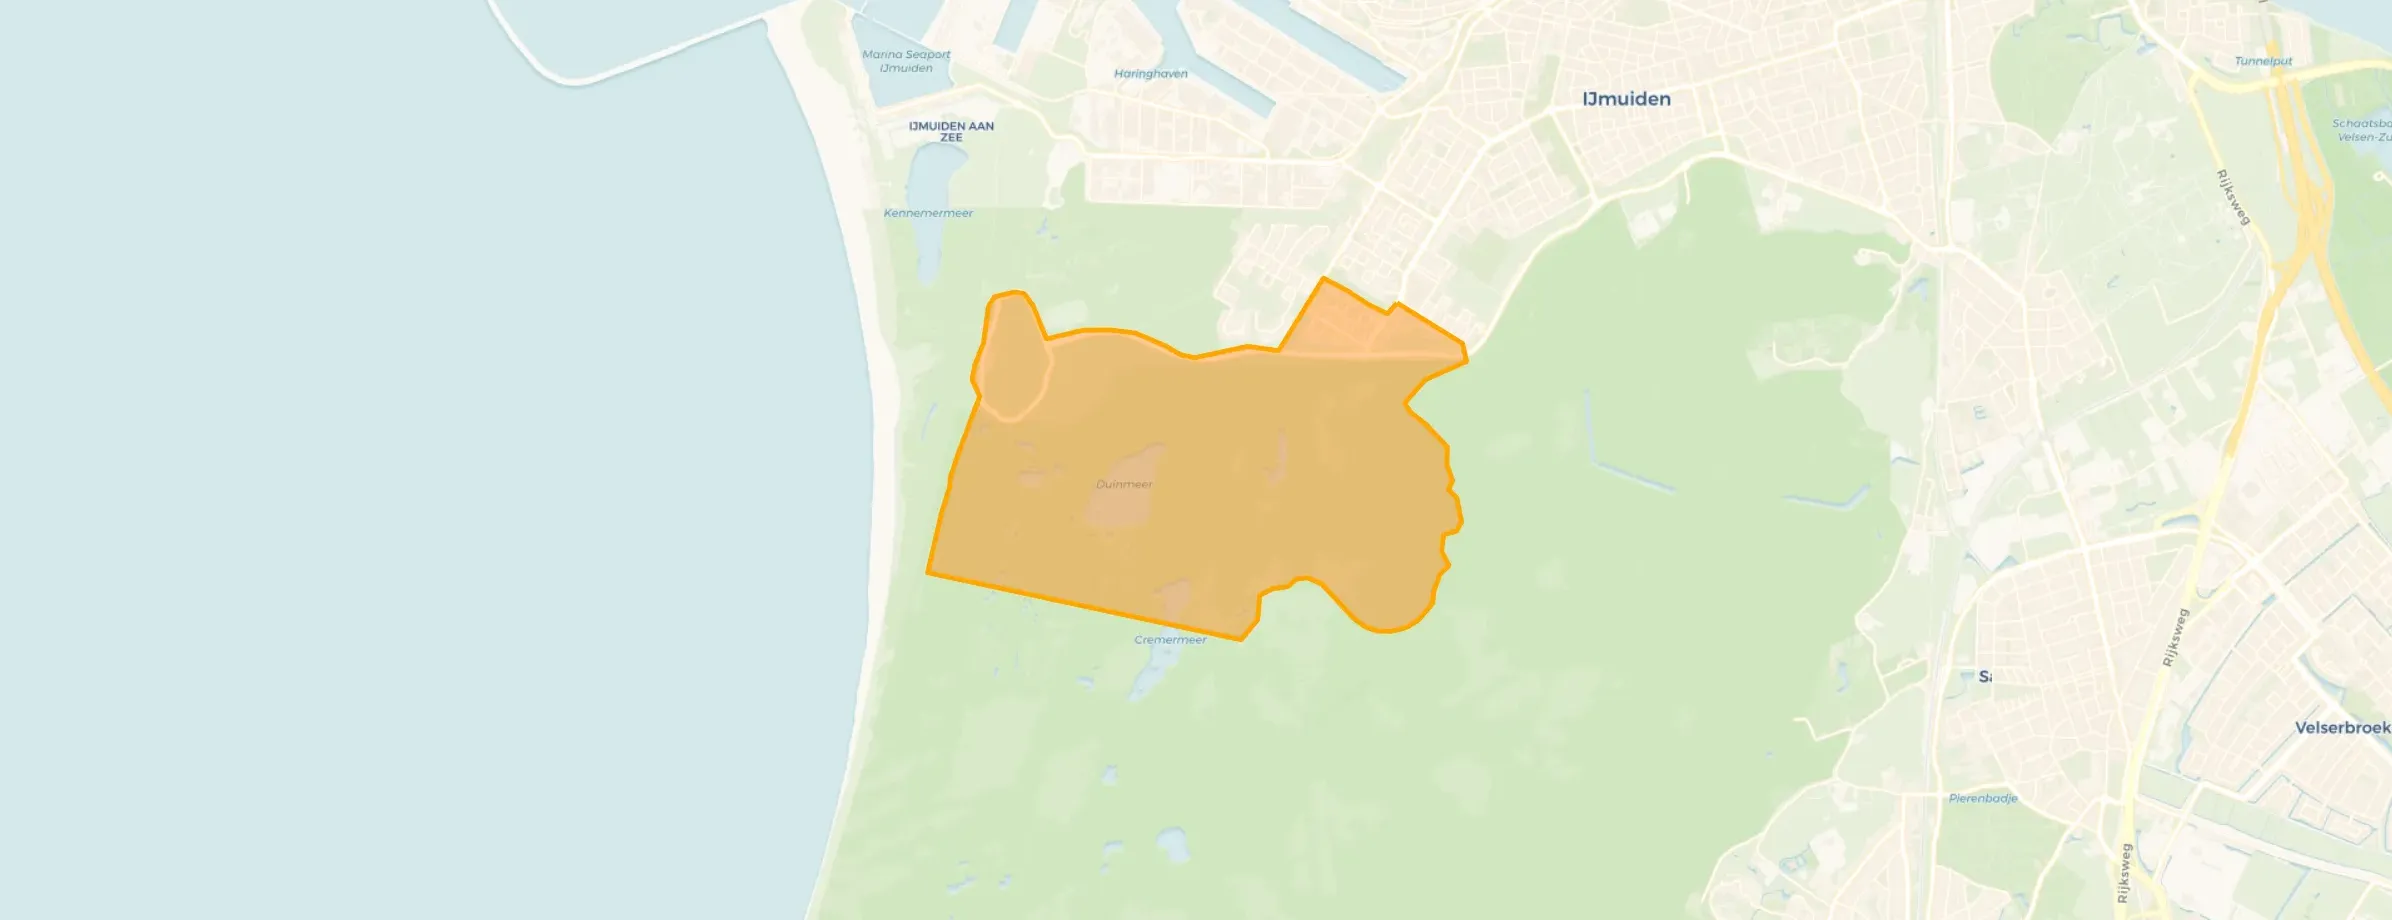
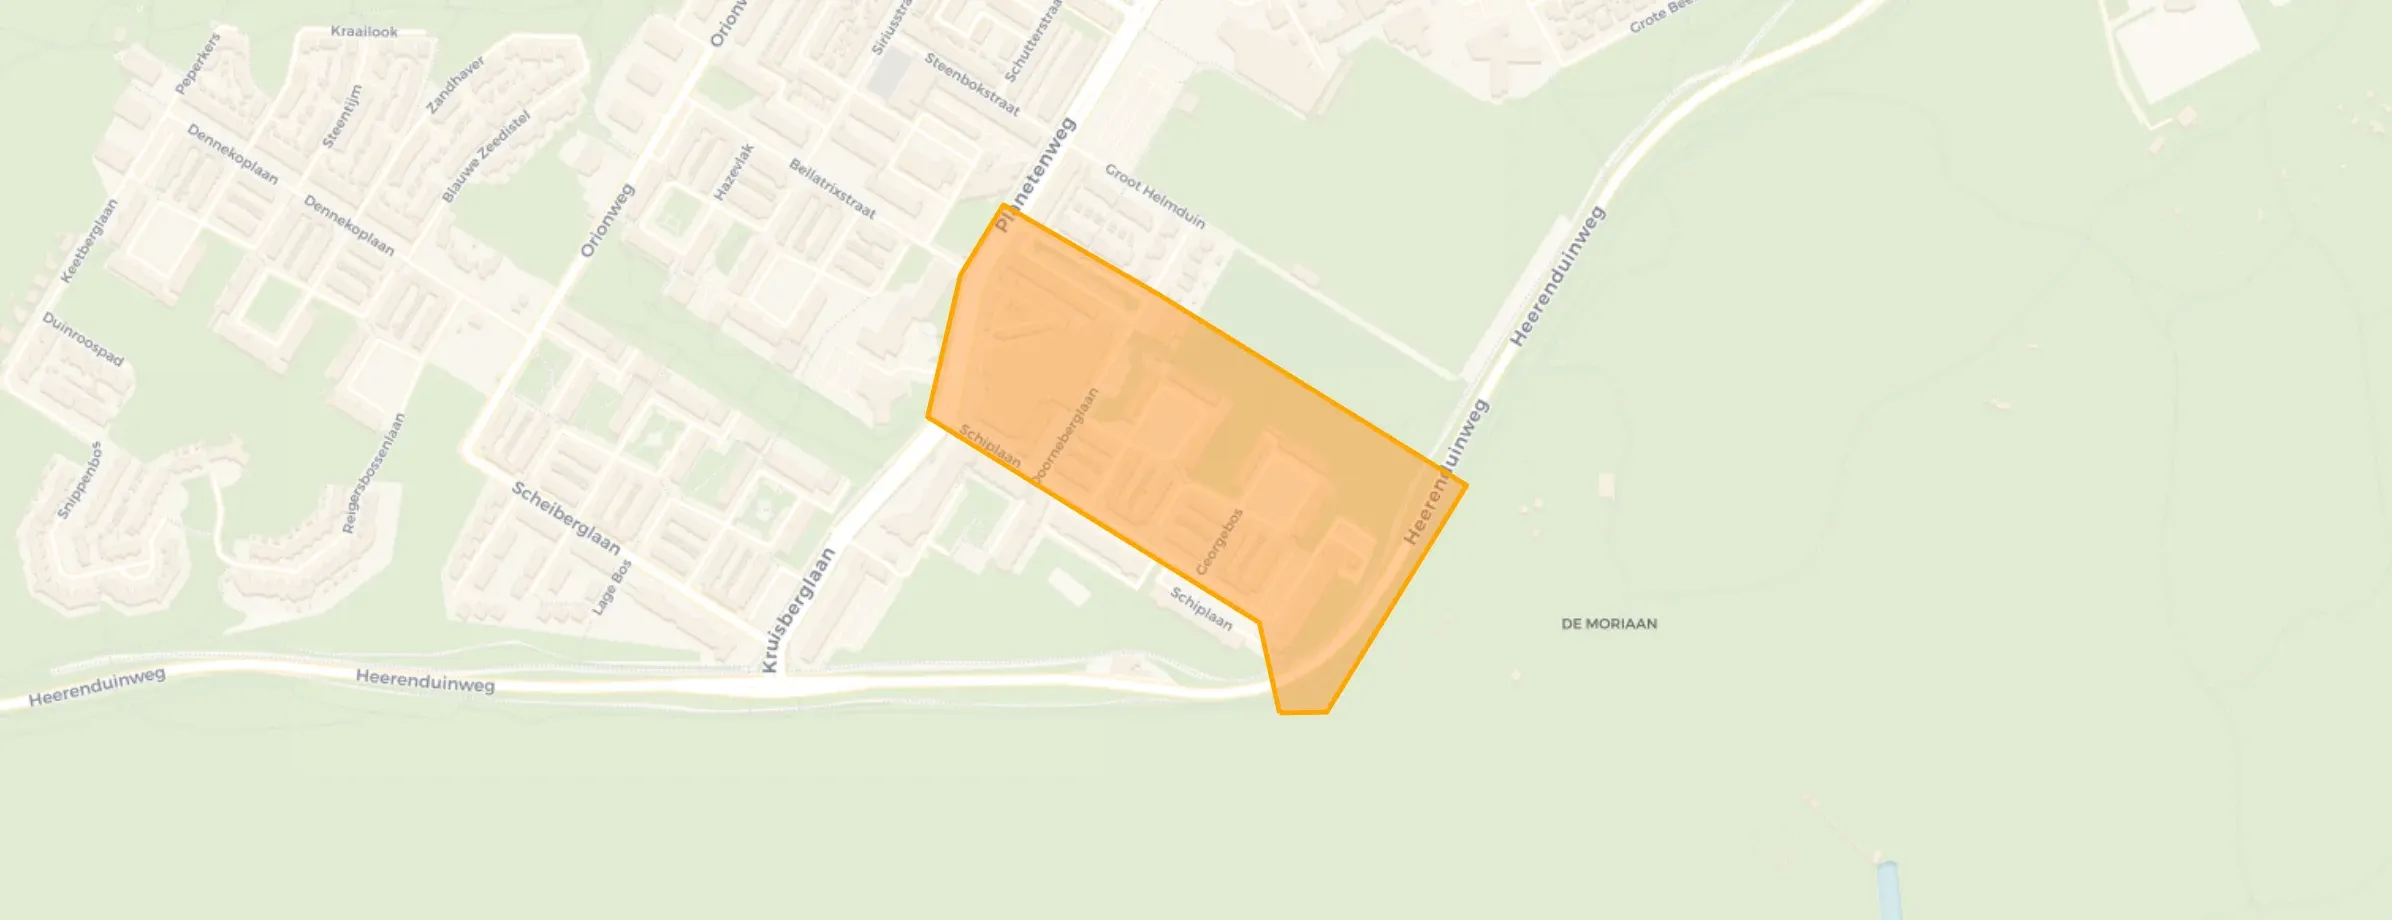
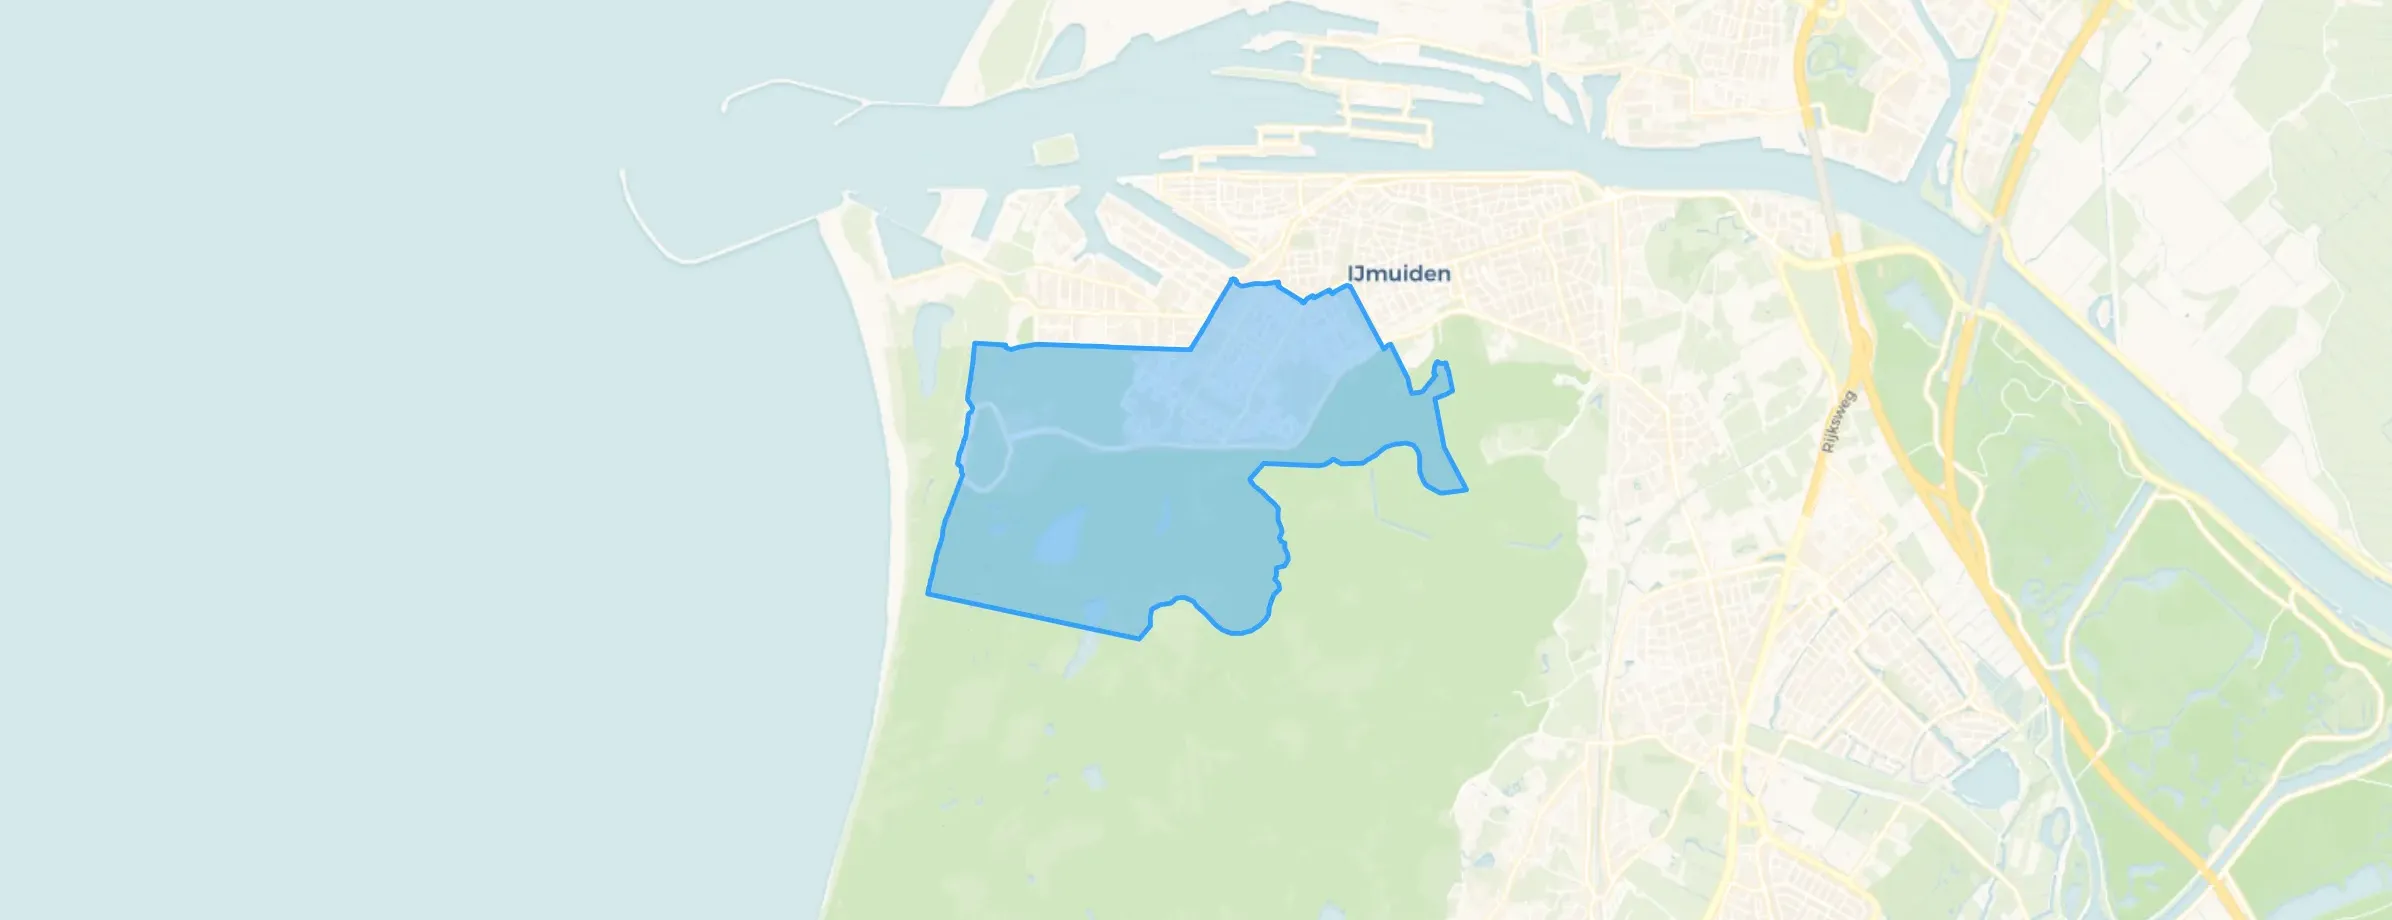
Zee- en Duinwijk is located in the province of Noord-Holland, in the municipality of Velsen The district has a total area of 544 hectares, of which 532 hectares are land and 12 hectares are water. The district is coded as WK045304. The postcode area is 1971JA-1976GD.
Zee- en Duinwijk has 10.150 residents. Of these, 48,0% are men and 52,0% are women. Most residents are 45 to 65 years (26,0%). The other age groups are 24,9% for '65 years or older', 23,3% for '25 to 45 years', 15,3% for '0 to 15 years' and 10,6% for '15 to 25 years'. Of the residents, 46,2% is unmarried, 36,2% is married, 10,5% is divorced and 7,1% is widowed. 7.050 residents originate from the Netherlands, 815 come from Europe and 2.280 come from countries outside Europe.
There are 4.905 households in Zee- en Duinwijk. 42,8% of these are single-person households, 25,9% households without children and 31,3% households with children. The average household size is 2,0 persons.
In Zee- en Duinwijk there are 8.200 income recipients. The average income per income recipient is €31.700, which is €4.100 (11%) lower than the national average of €35.800. Per resident, the average income is €26.300, which is €2.900 (10%) lower than the national average of €29.200. Most residents of Zee- en Duinwijk are educated to an intermediate level. 44,8% have an intermediate education (HAVO, VWO or MBO 2-4), 33,9% have a lower education (VMBO or MBO 1) and 21,3% have a university or higher professional education (HBO/WO).
Of the 10.150 residents, around 60% are in paid employment, which amounts to 6.090 people. This is 5% lower than the national average of 65%. The majority of workers are in salaried employment (87%), while 13% are self-employed. In Zee- en Duinwijk, 33% of residents receive a benefit. The largest group is those receiving a state pension (AOW). 2.250 people receive this benefit.
In Zee- en Duinwijk there are 5.100 homes with an average assessed value (WOZ) of €282.000. Of these, around 96% are occupied and 4% unoccupied. Most homes are rental properties. This amounts to 66% rental homes and 34% owner-occupied homes. Of the homes, 34% privately owned, 62% owned by housing associations and 4% owned by other landlords. The most common construction periods in Zee- en Duinwijk are 1950-1970 (51%) and 1970-1980 (22%).
There are currently no homes for sale in Zee- en Duinwijk. The most recently listed home is Scheiberglaan 316 by VAN WAALWIJK VAN DOORN MAKELAARS. No homes were sold in Zee- en Duinwijk over the past year.
There are currently no homes for rent in Zee- en Duinwijk. The most recent home is Schiplaan 2T, offered by ViaDaan op Pararius. No homes were let in Zee- en Duinwijk over the past year.
No recent rental data available for Zee- en Duinwijk.
In Zee- en Duinwijk there are 5.145 addresses with a registered energy label. The most common labels are A (23%), C (21%) and B (17%). On average, an address in Zee- en Duinwijk uses 2.140 kWh of electricity per year. This is 24% below the national average of 2.810 kWh. With an annual consumption of 860 m³ per address, natural gas consumption is 33% below the national average of 1.280 m³.
Good experience. I have never felt unsafe in my neighbourhood.
Auto-translated to English by AINice quiet neighbourhood with almost exclusively local traffic. Unfortunately, few to no amenities really nearby. Would have liked a shop closer by.
Auto-translated to English by AIVery cosy neighbourhood, everyone knows each other and plenty of space to do what you want.
Auto-translated to English by AIIn this neighbourhood everything is within reach, shops nearby just a few minutes' walk away. There are also many playgrounds in the area, although I think they are not well maintained; new playgrounds and more green spaces should be created. The bus stop is close by, but often dark in the evening, which gives an unsafe feeling. Also, the gateway is very dark and fireworks are often set off, which also gives an unsafe feeling.
Auto-translated to English by AIThe housing stock is mainly post-war — 67% was built between 1945 and 1990. In addition, the most common type is flats (69%).
Over the past year a home for sale in Zee- en Duinwijk was listed for an average of €517,580 (€4,384 per m²).
Residents give Zee- en Duinwijk a 8.1 out of 10 based on 4 reviews. Safety stands out with a 9.5; accessibility lags behind with a 5.7.
From Zee- en Duinwijk you can on average reach a supermarket at 0.5 km, a GP at 1.0 km, a railway station at 5.3 km, a primary school at 0.7 km (as the crow flies, source: CBS).
Right now you will find 16 homes for sale and 2 homes for rent in Zee- en Duinwijk.