
Municipality in Gelderland
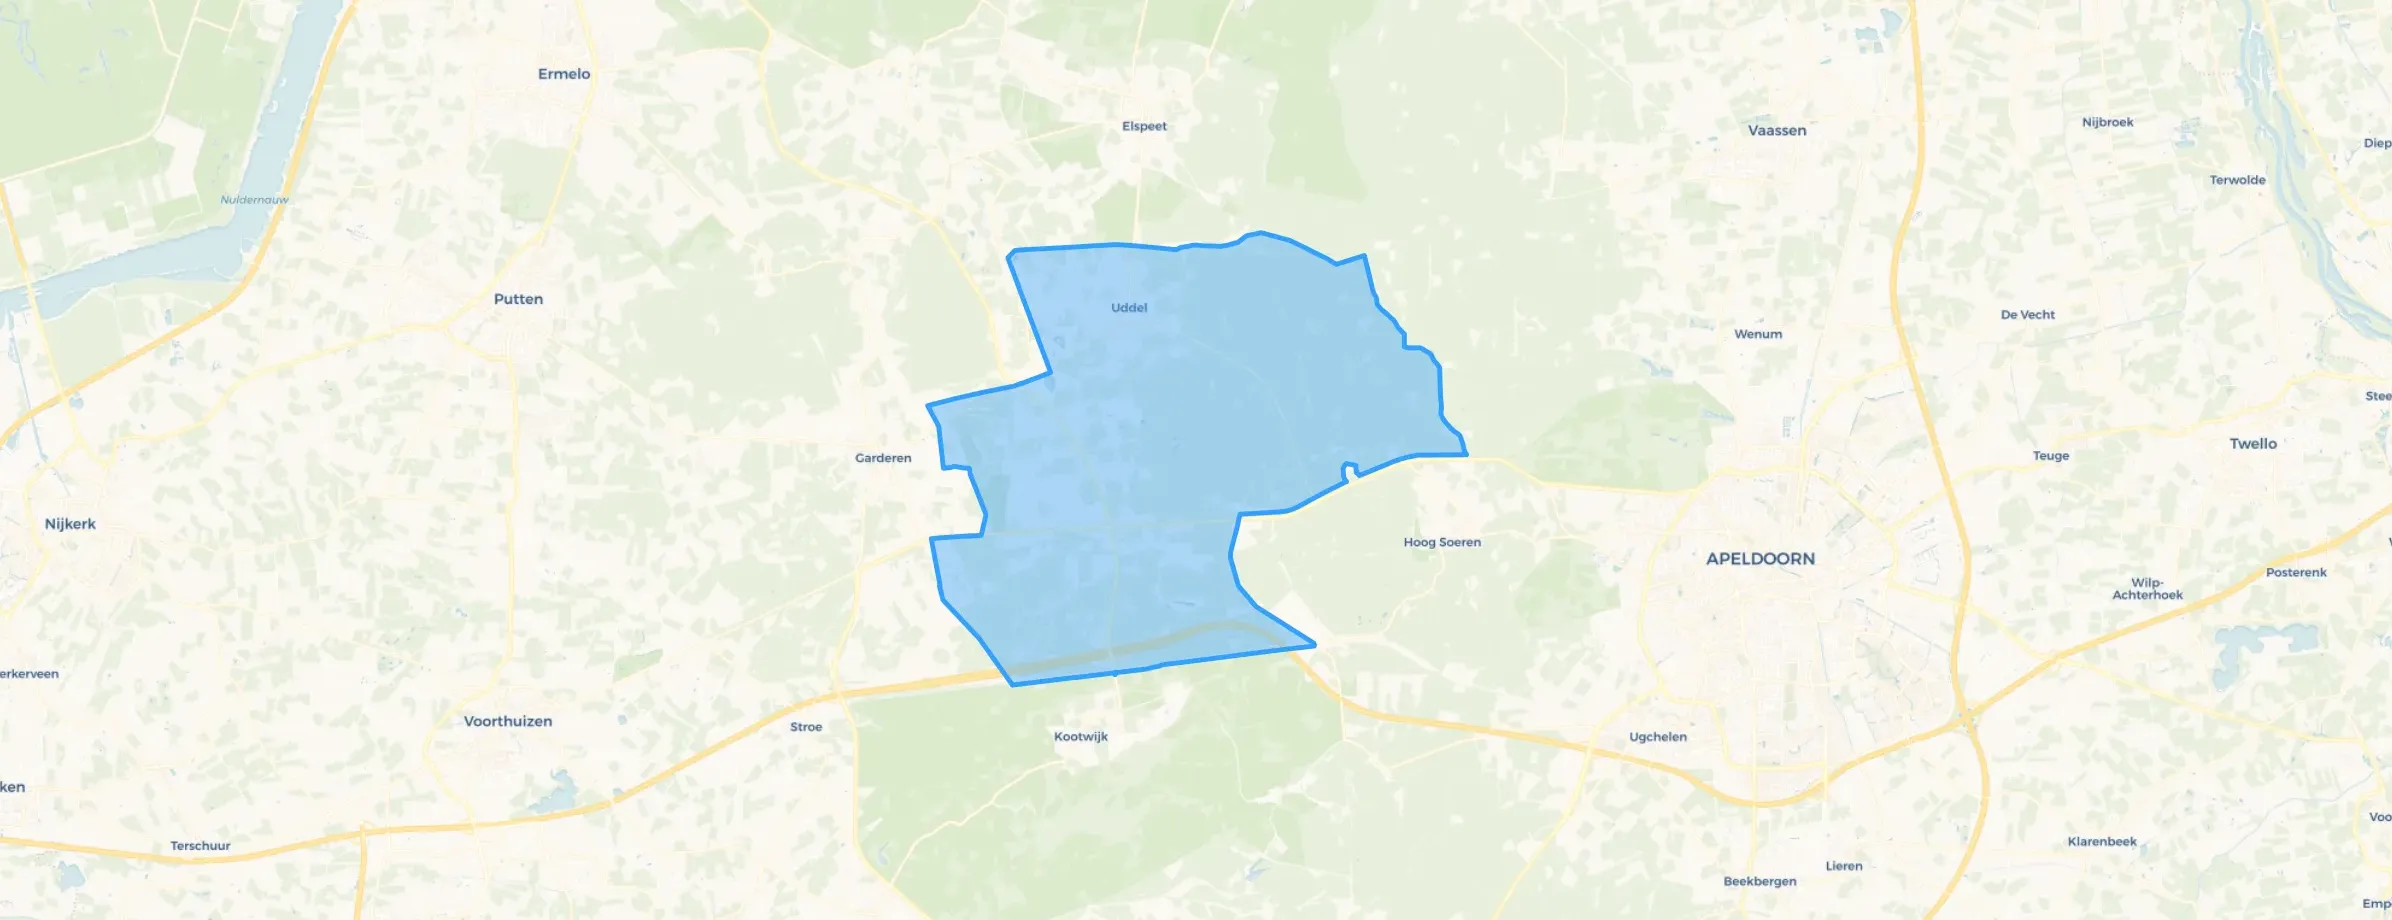
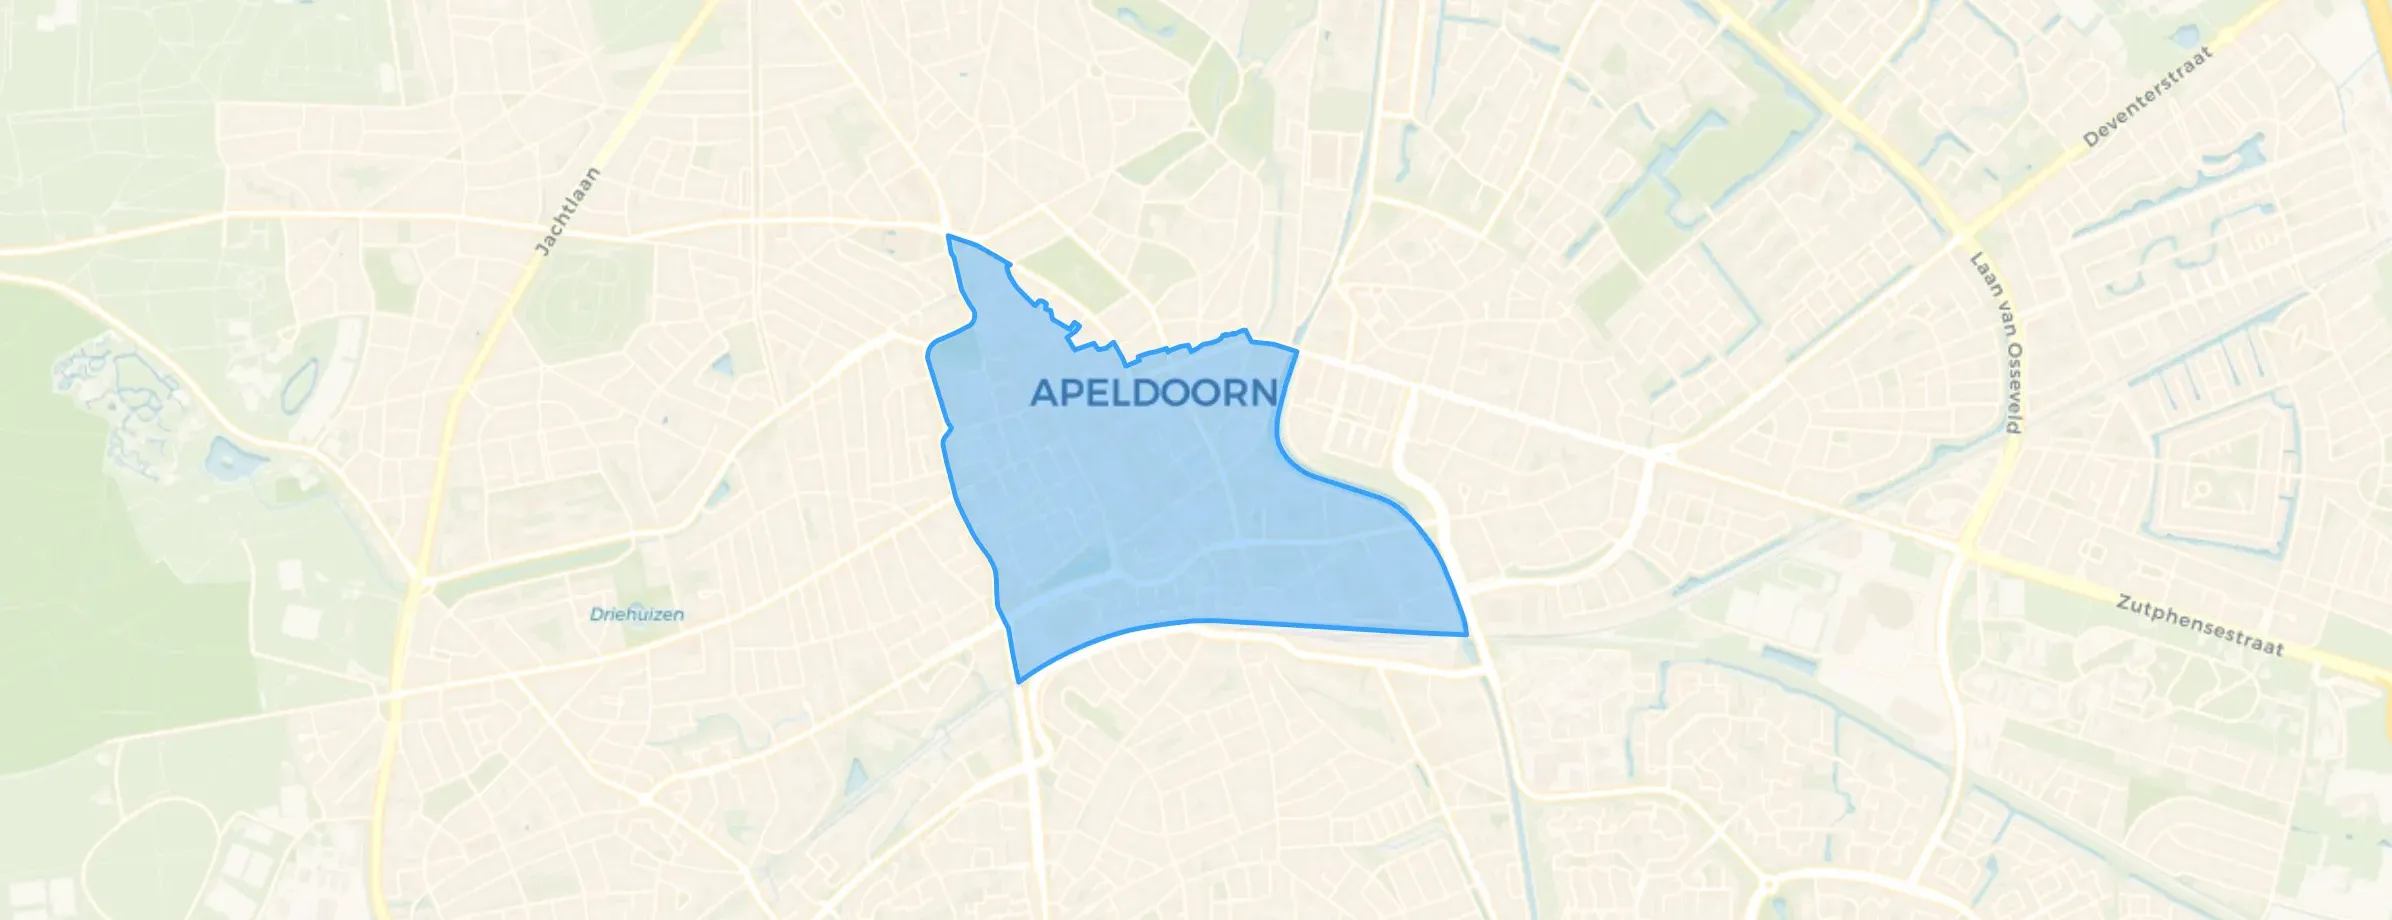
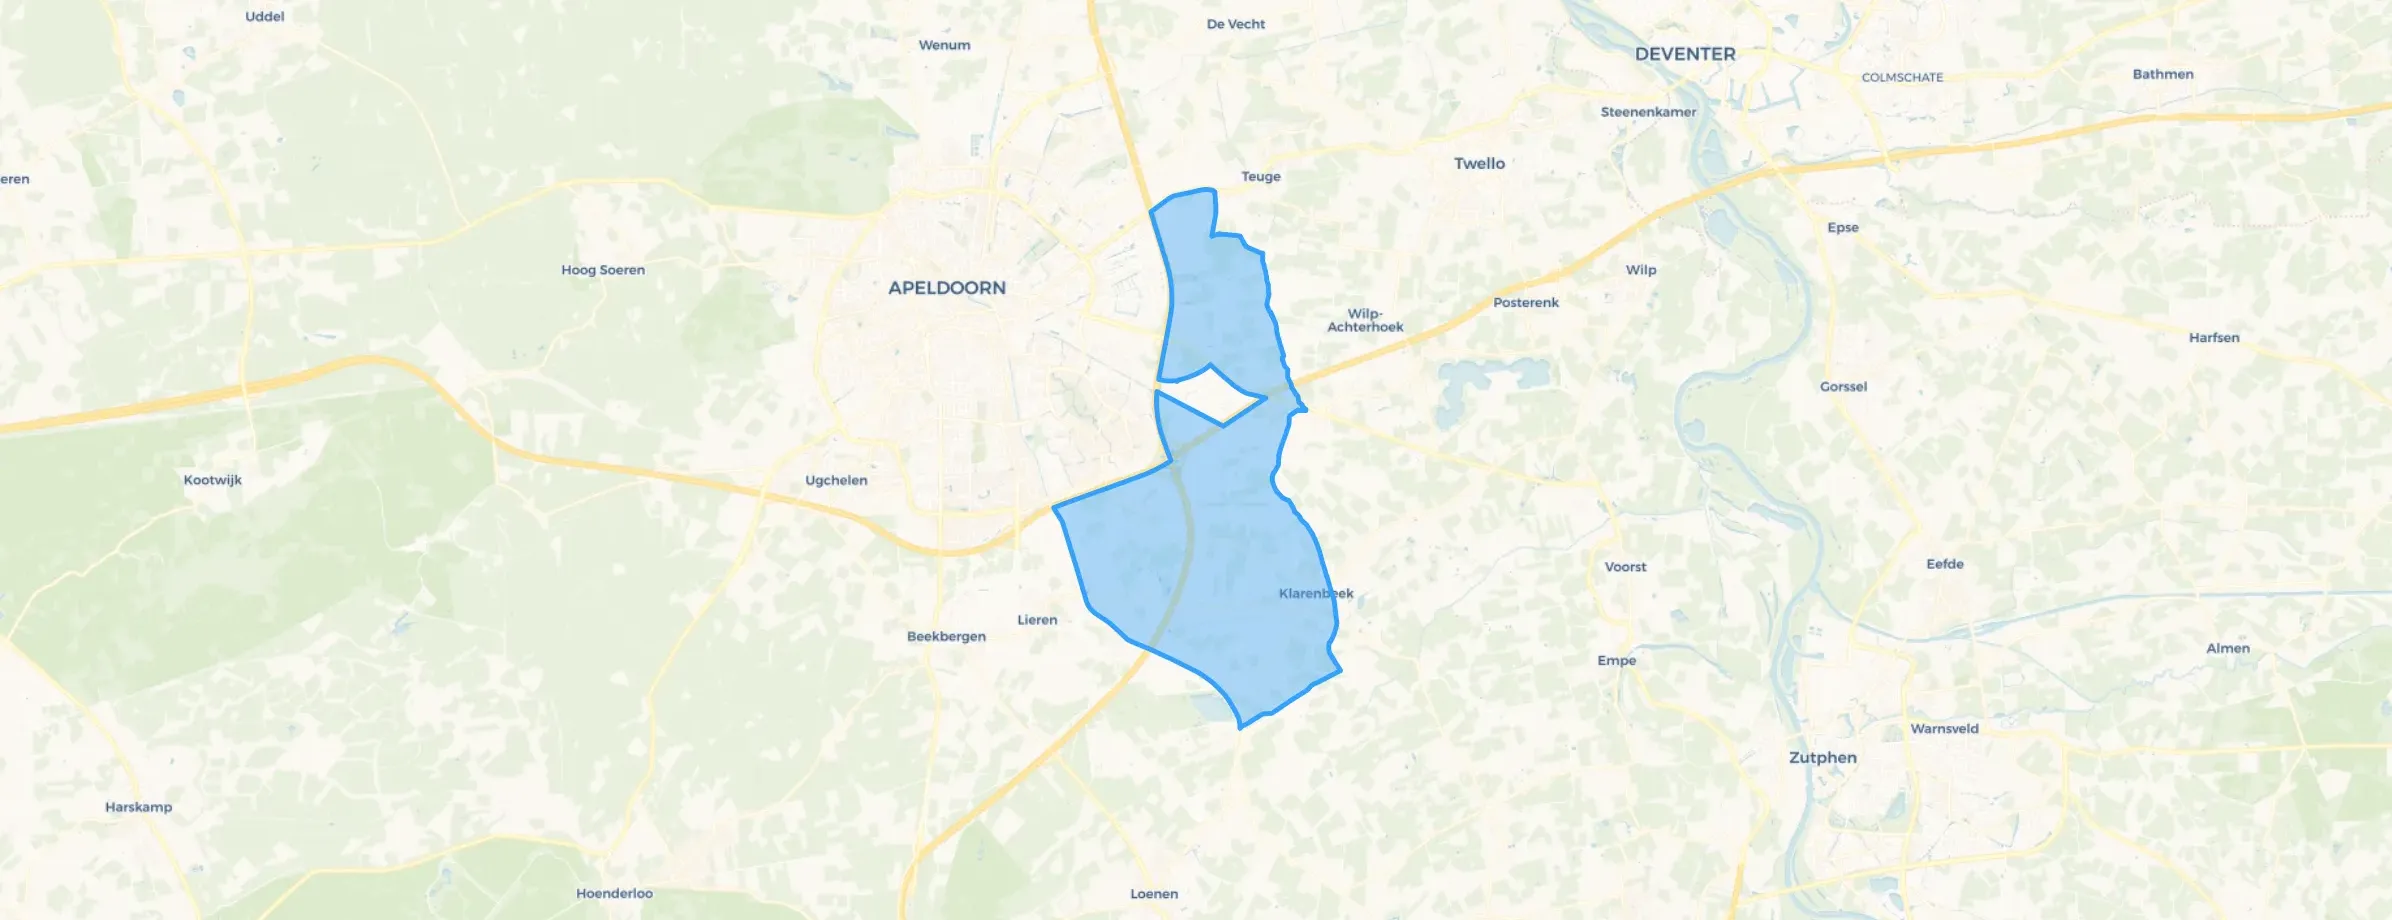
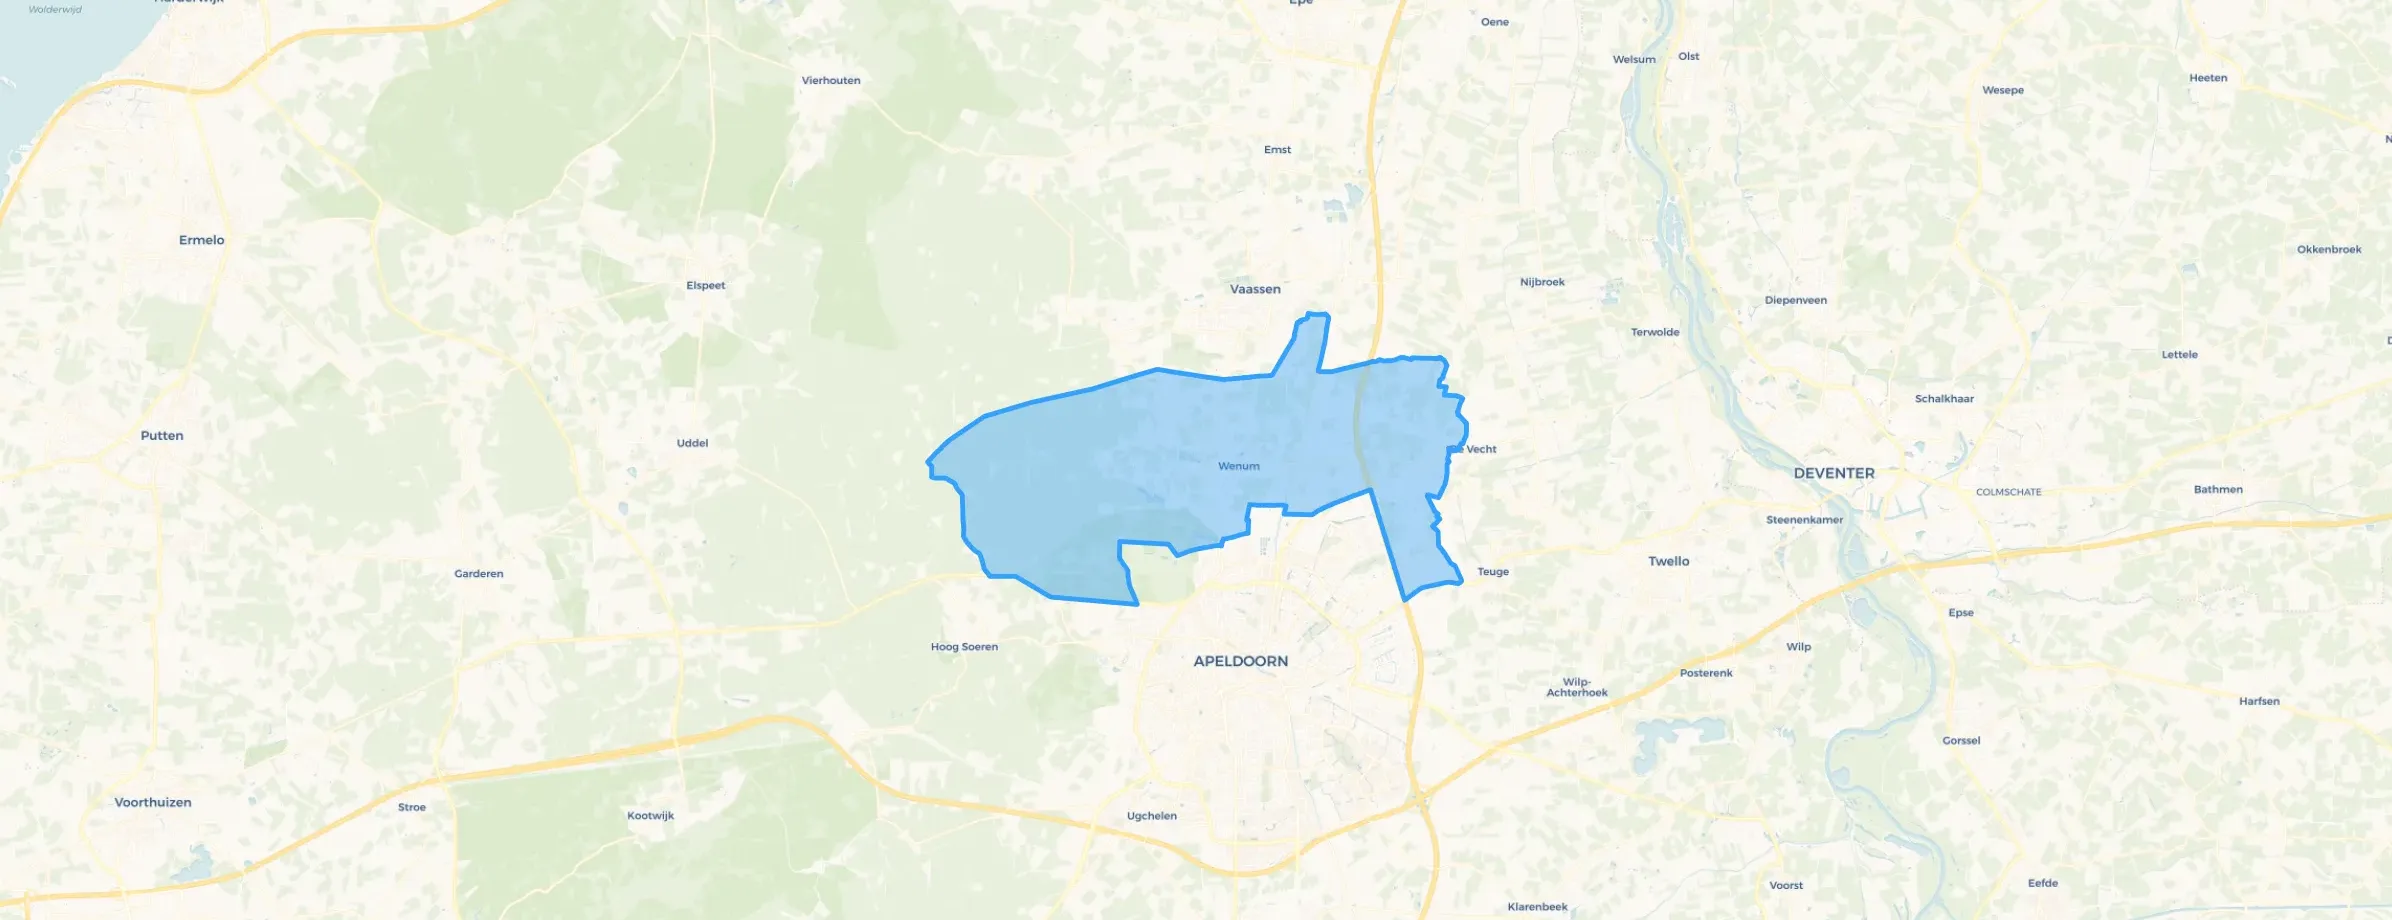
Apeldoorn is located in the province of Gelderland The municipality has a total area of 34.115 hectares, of which 33.986 hectares are land and 129 hectares are water. The municipality is coded as GM0200. The postcode area is 3888KA-7381GB.
Apeldoorn has 168.551 residents. Of these, 50,0% are men and 50,0% are women. Most residents are 45 to 65 years (27,3%). The other age groups are 23,9% for '25 to 45 years', 22,5% for '65 years or older', 14,9% for '0 to 15 years' and 11,5% for '15 to 25 years'. Of the residents, 46,9% is unmarried, 39,5% is married, 8,5% is divorced and 5,1% is widowed. 131.943 residents originate from the Netherlands, 10.643 come from Europe and 25.965 come from countries outside Europe.
There are 76.875 households in Apeldoorn. 37,8% of these are single-person households, 29,9% households without children and 32,3% households with children. The average household size is 2,1 persons. The national average is 2,1 persons.
In Apeldoorn there are 135.600 income recipients. The average income per income recipient is €41.400, which is €800 (2%) lower than the national average of €42.200. Per resident, the average income is €34.500, which is €400 (1%) lower than the national average of €34.900. Most residents of Apeldoorn are educated to an intermediate level. 42,9% have an intermediate education (HAVO, VWO or MBO 2-4), 30,3% have a university or higher professional education (HBO/WO) and 26,7% have a lower education (VMBO or MBO 1).
Of the 168.551 residents, around 72% are in paid employment, which amounts to 121.357 people. This is 0% lower than the national average of 72%. The majority of workers are in salaried employment (85%), while 15% are self-employed. In Apeldoorn, 29% of residents receive a benefit. The largest group is those receiving a state pension (AOW). 34.050 people receive this benefit.
In Apeldoorn there are 75.994 homes with an average assessed value (WOZ) of €386.000. Of these, around 97% are occupied and 3% unoccupied. Most homes are owner-occupied. This amounts to 40% rental homes and 60% owner-occupied homes. Of the homes, 60% privately owned, 28% owned by housing associations and 12% owned by other landlords. The most common construction periods in Apeldoorn are 1950-1970 (20%) and 1970-1980 (19%).
There are currently no homes for sale in Apeldoorn. The most recently listed home is Rietdekkersdreef 528 by Goos woning- en bedrijfsmakelaars. No homes were sold in Apeldoorn over the past year.
There are currently no homes for rent in Apeldoorn. The most recent home is Mariastraat 2K, offered by Tijmen Kroes Makelaardij op Funda. No homes were let in Apeldoorn over the past year.
No recent rental data available for Apeldoorn.
In Apeldoorn there are 55.326 addresses with a registered energy label. The most common labels are A (32%), C (22%) and B (16%). On average, an address in Apeldoorn uses 2.620 kWh of electricity per year. This is 3% above the national average of 2.550 kWh. Natural gas consumption, at 860 m³ per year, is 8% above the national average of 800 m³.
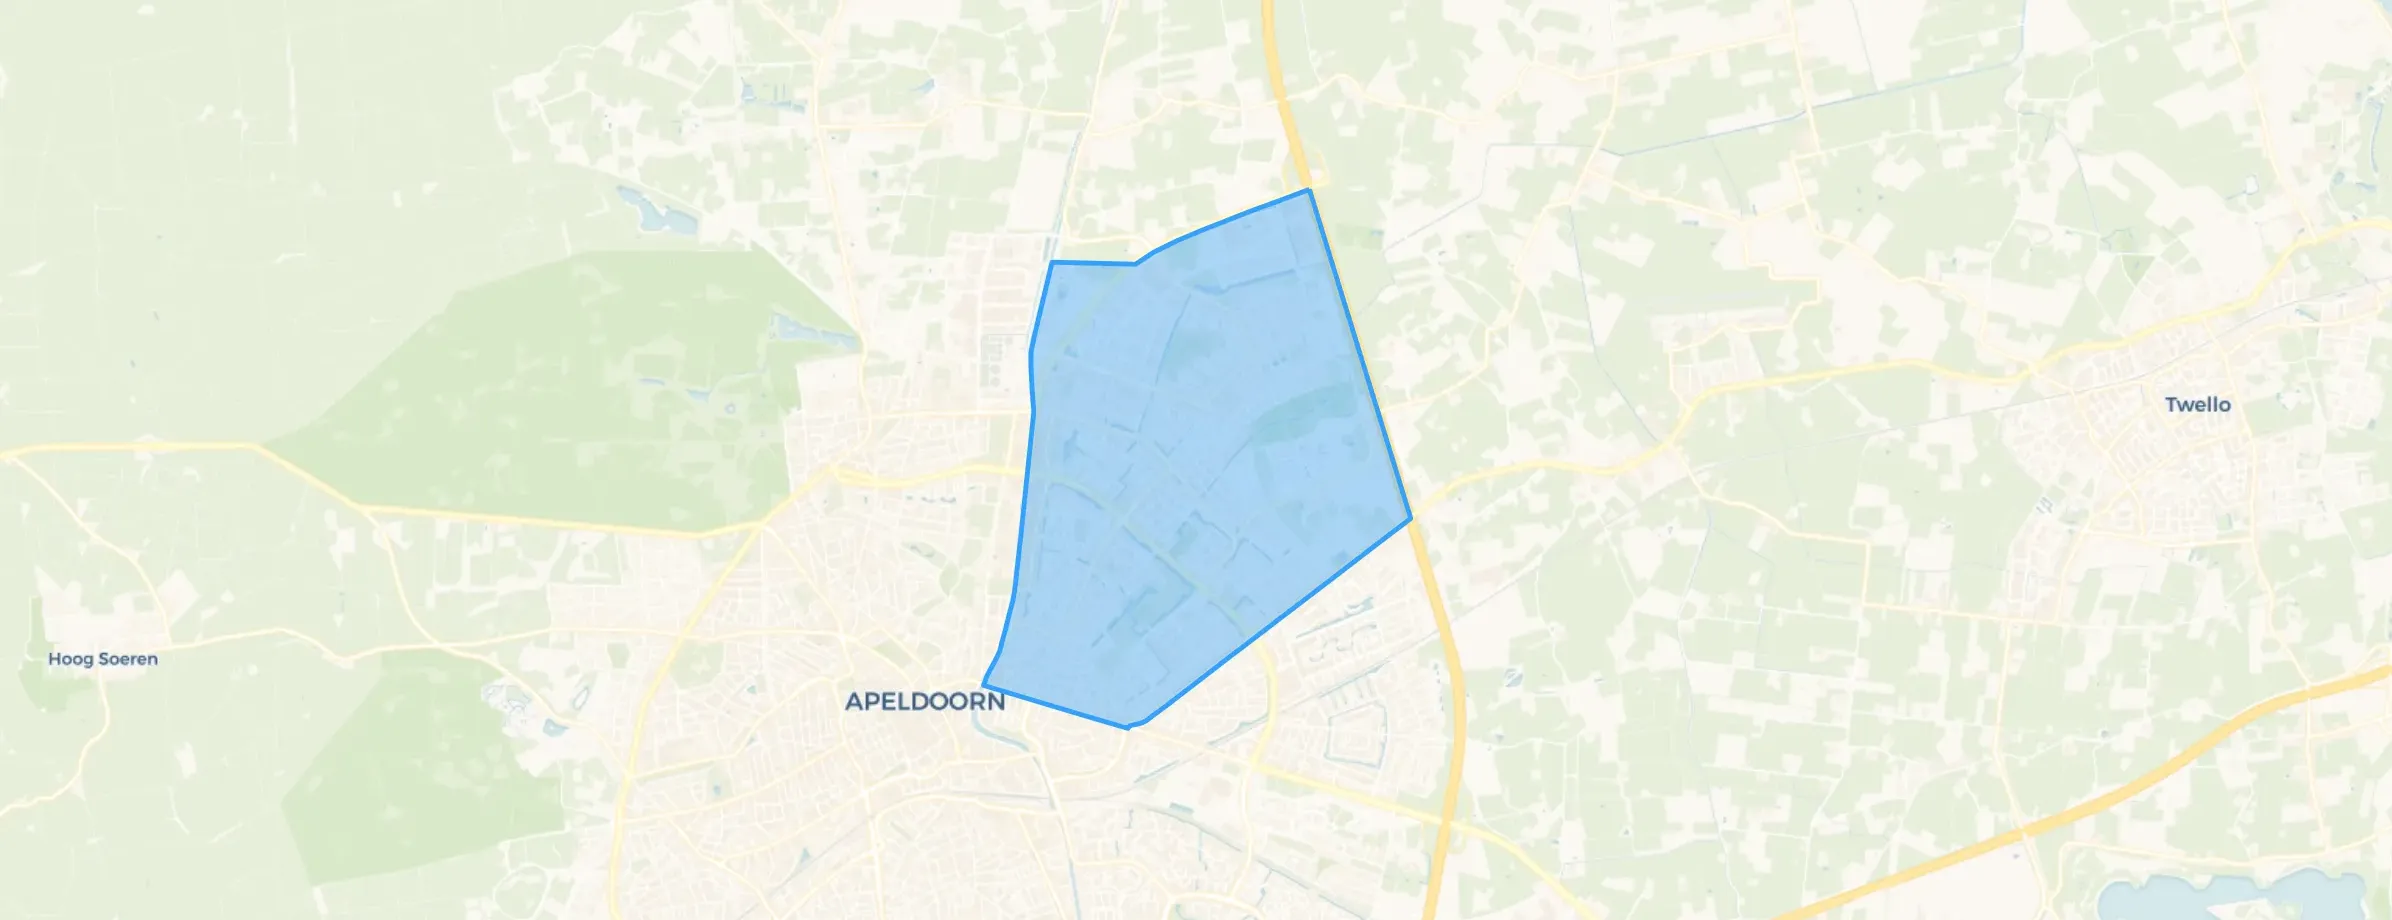

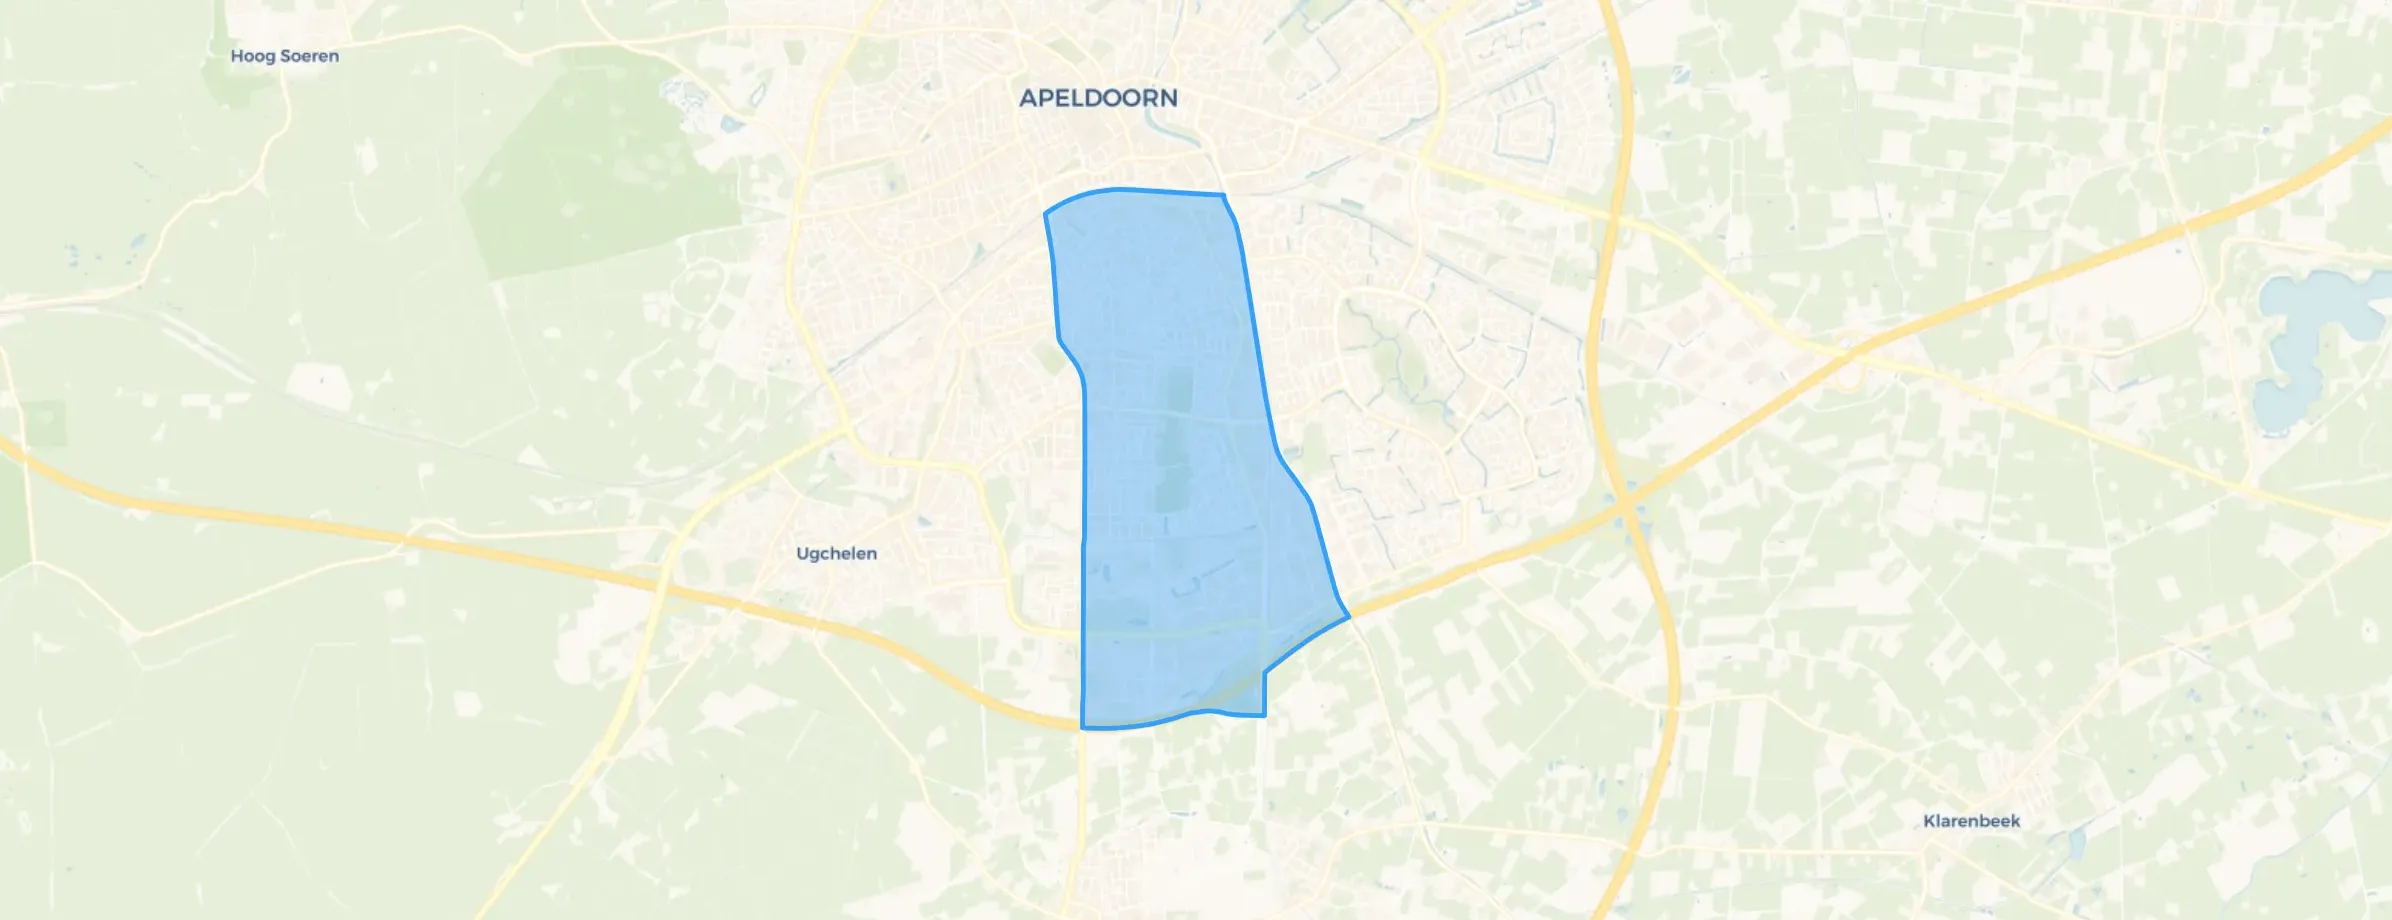

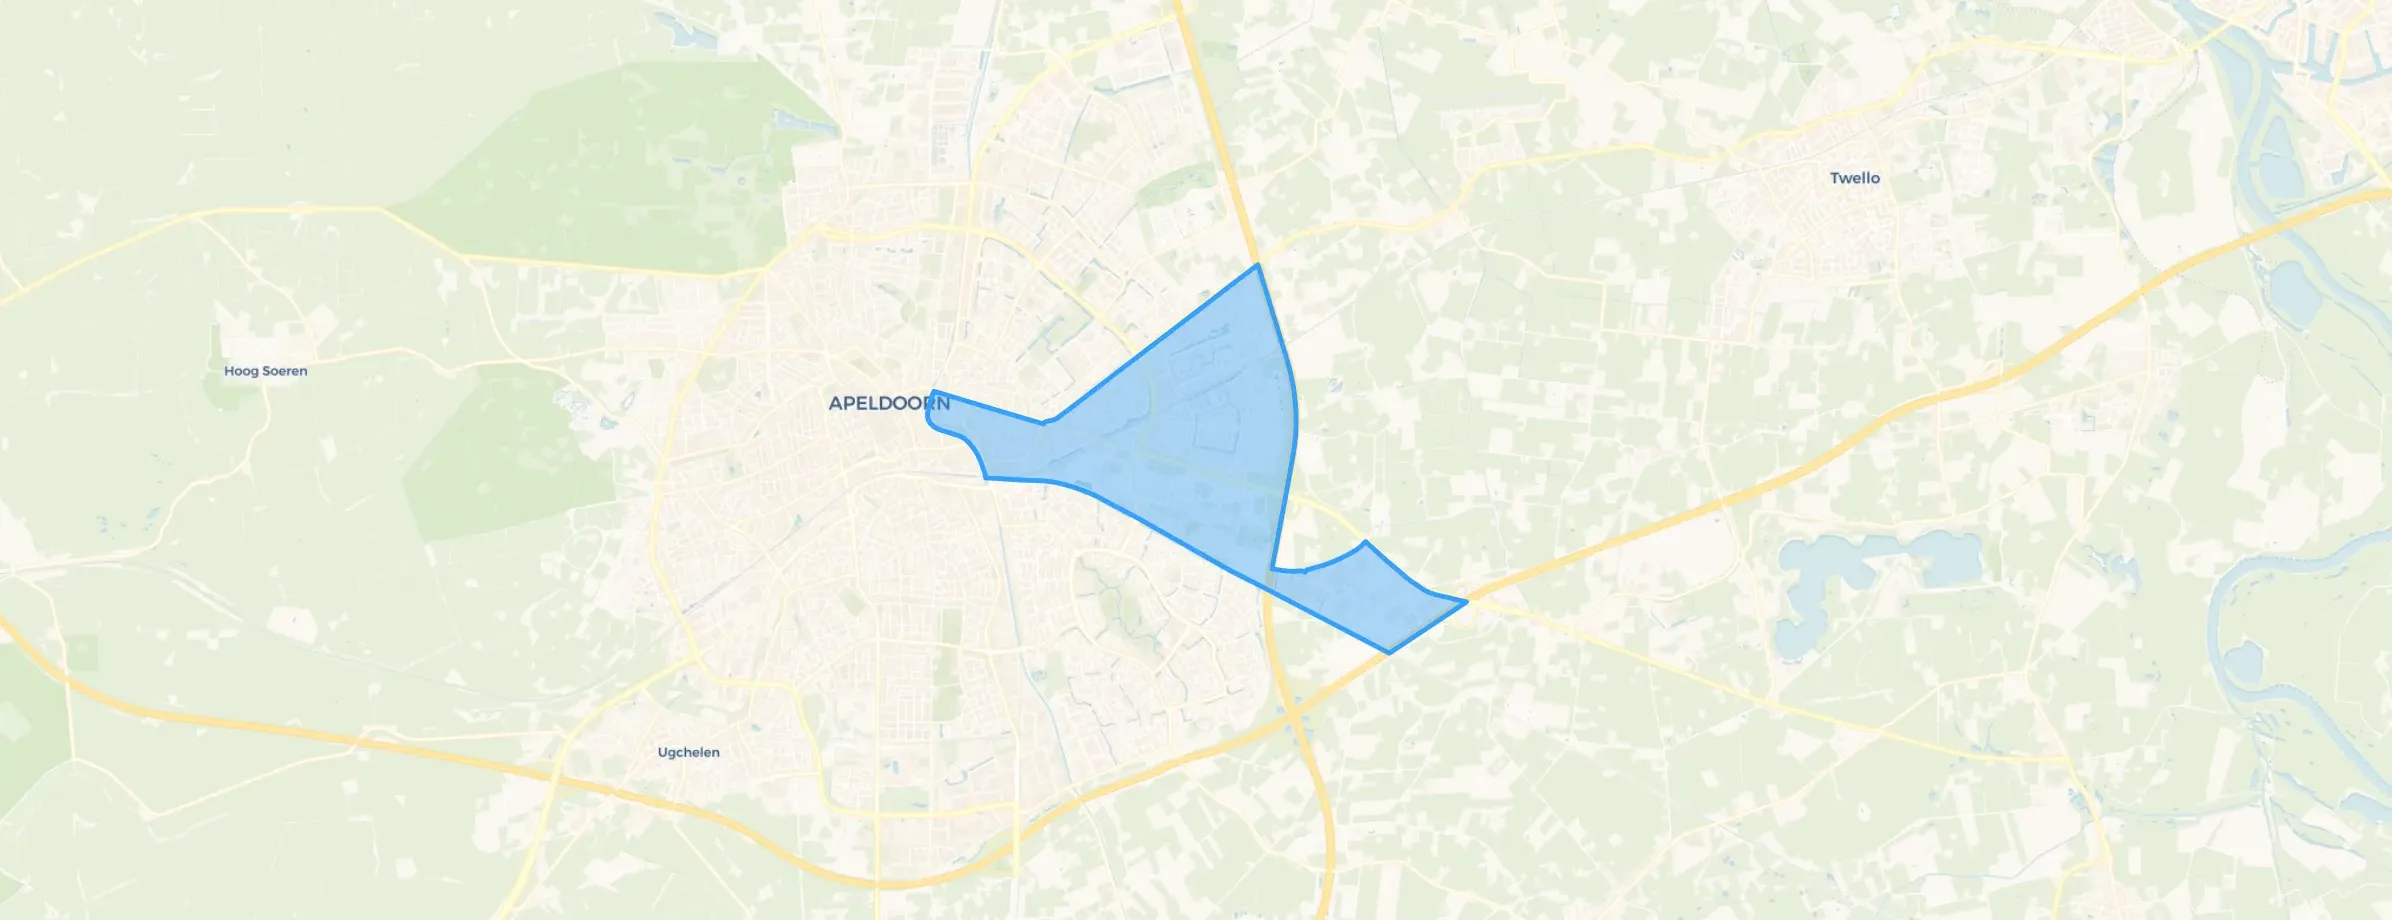

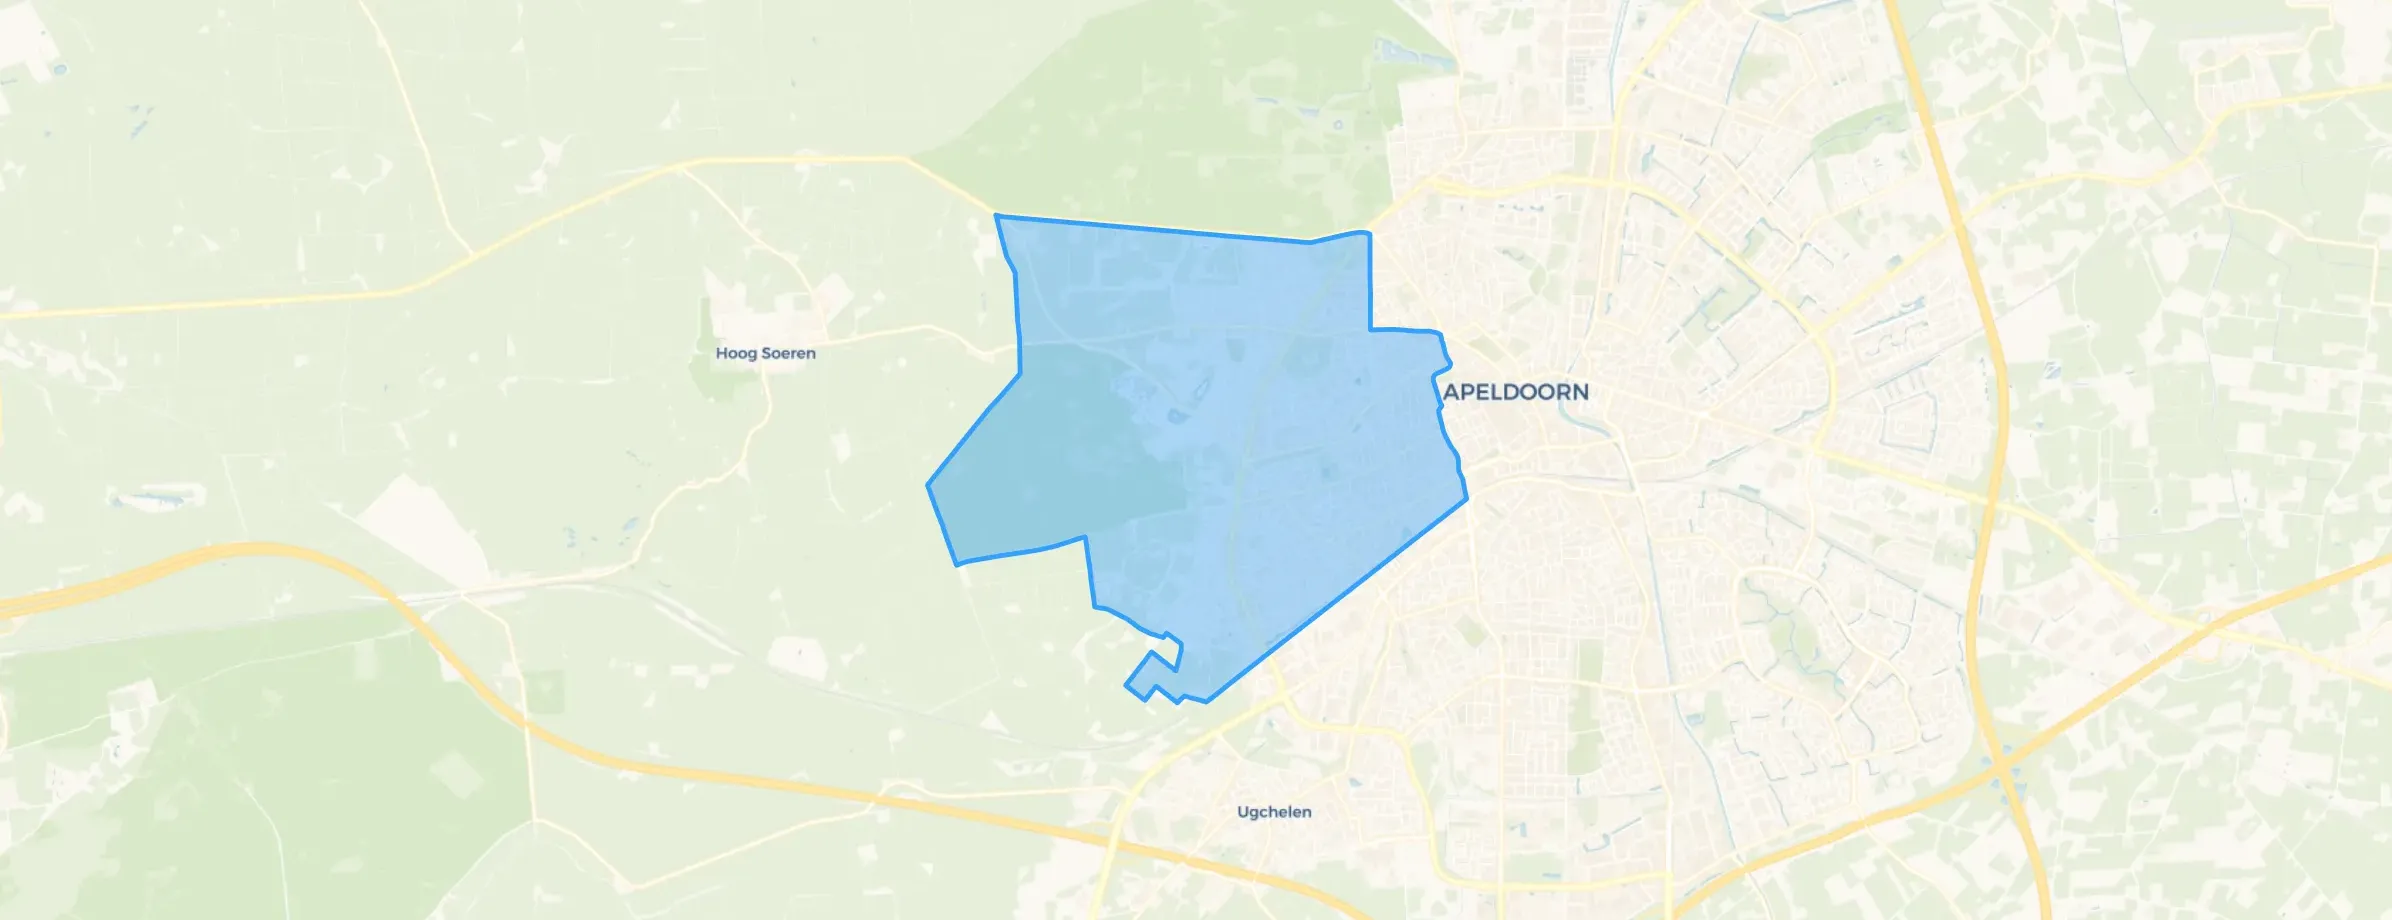
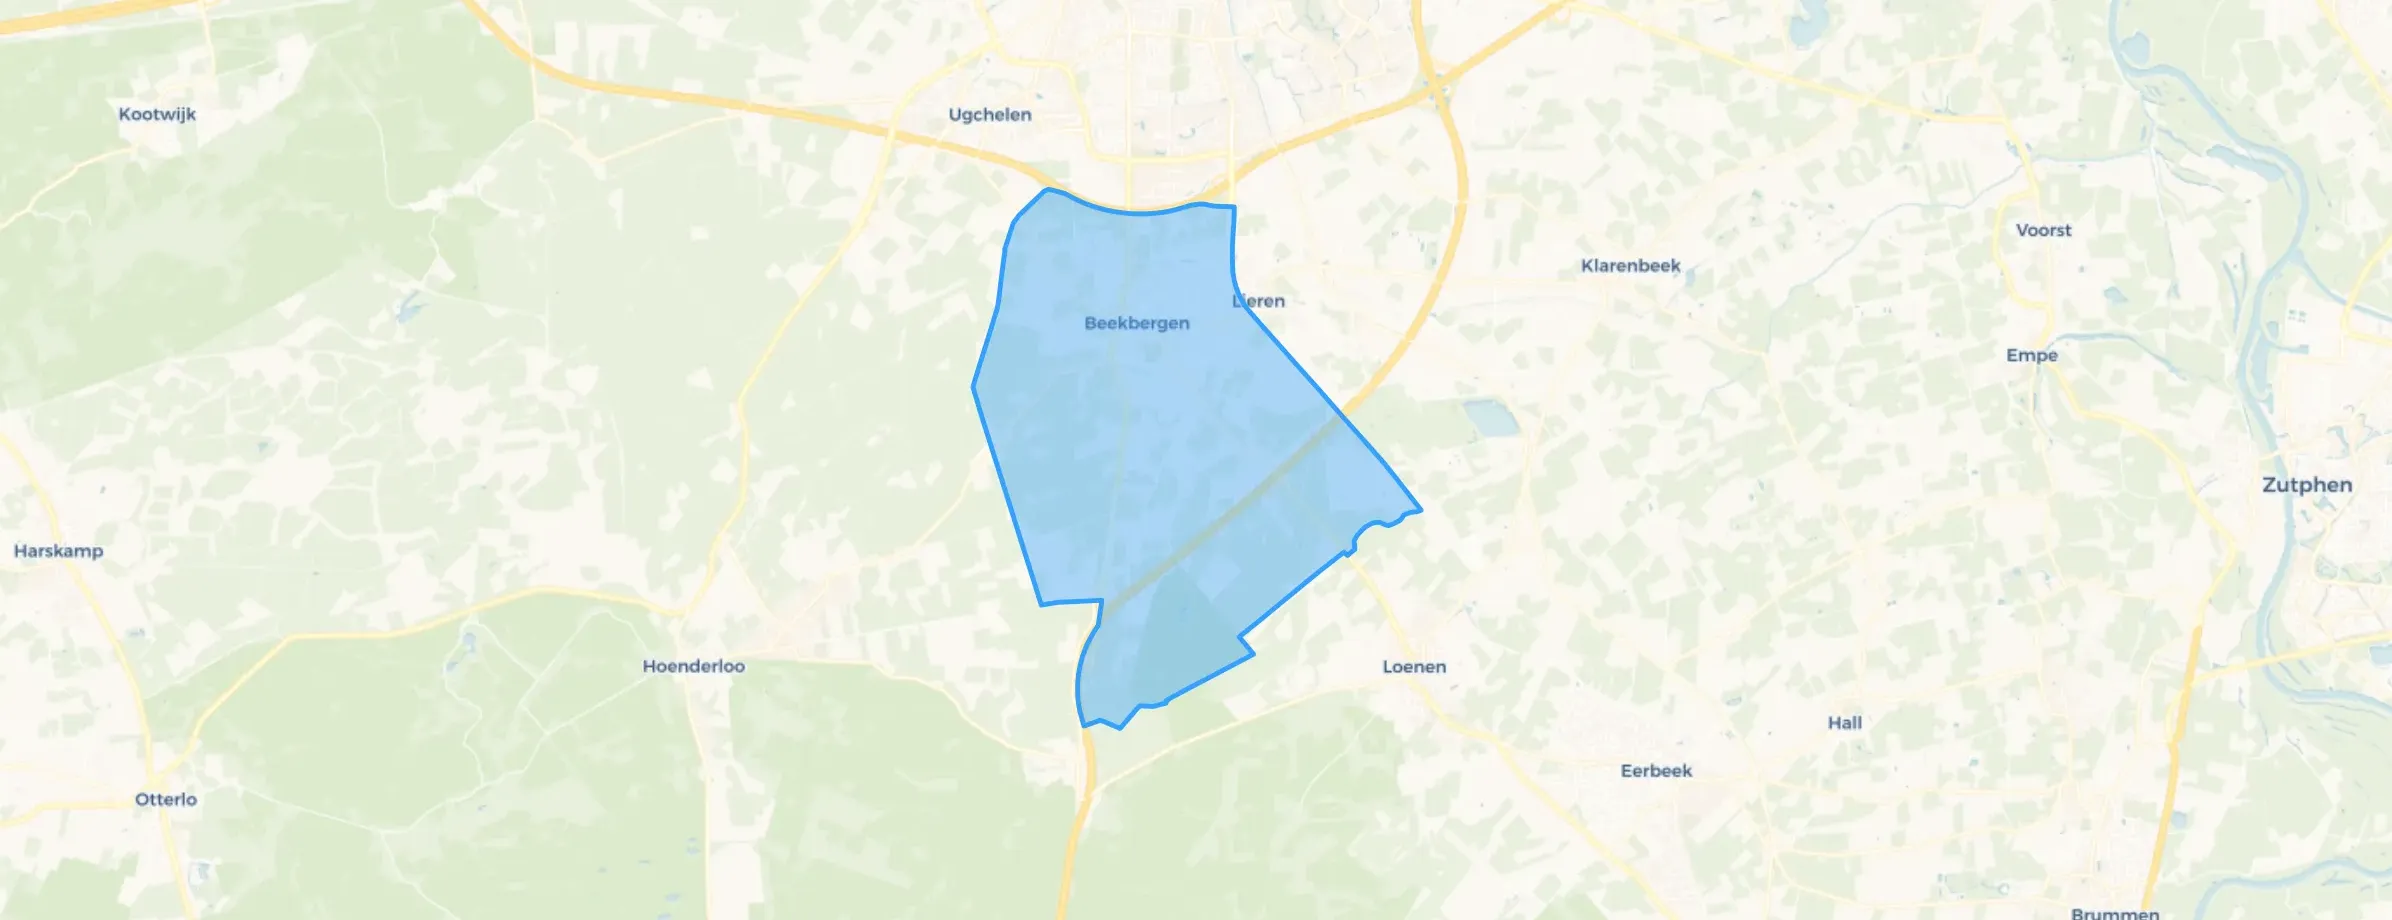
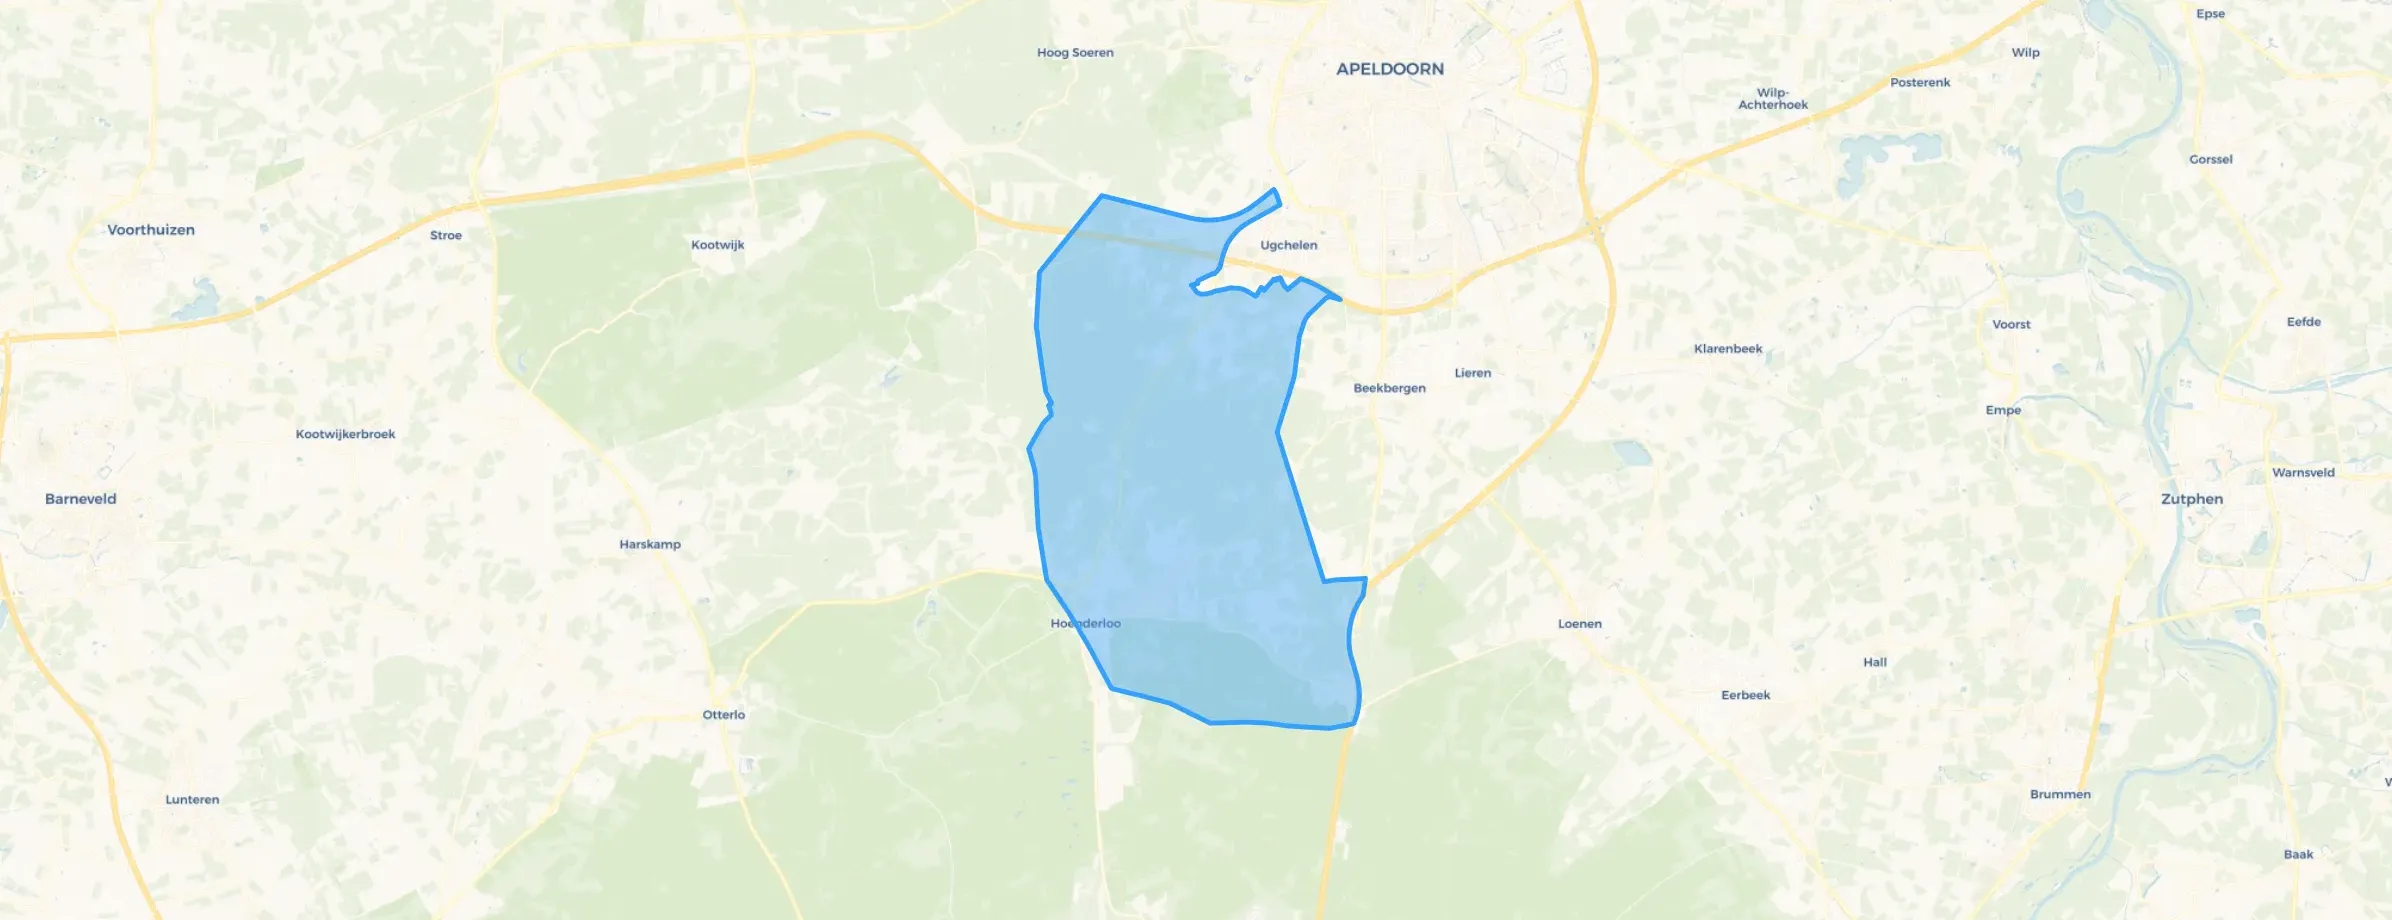
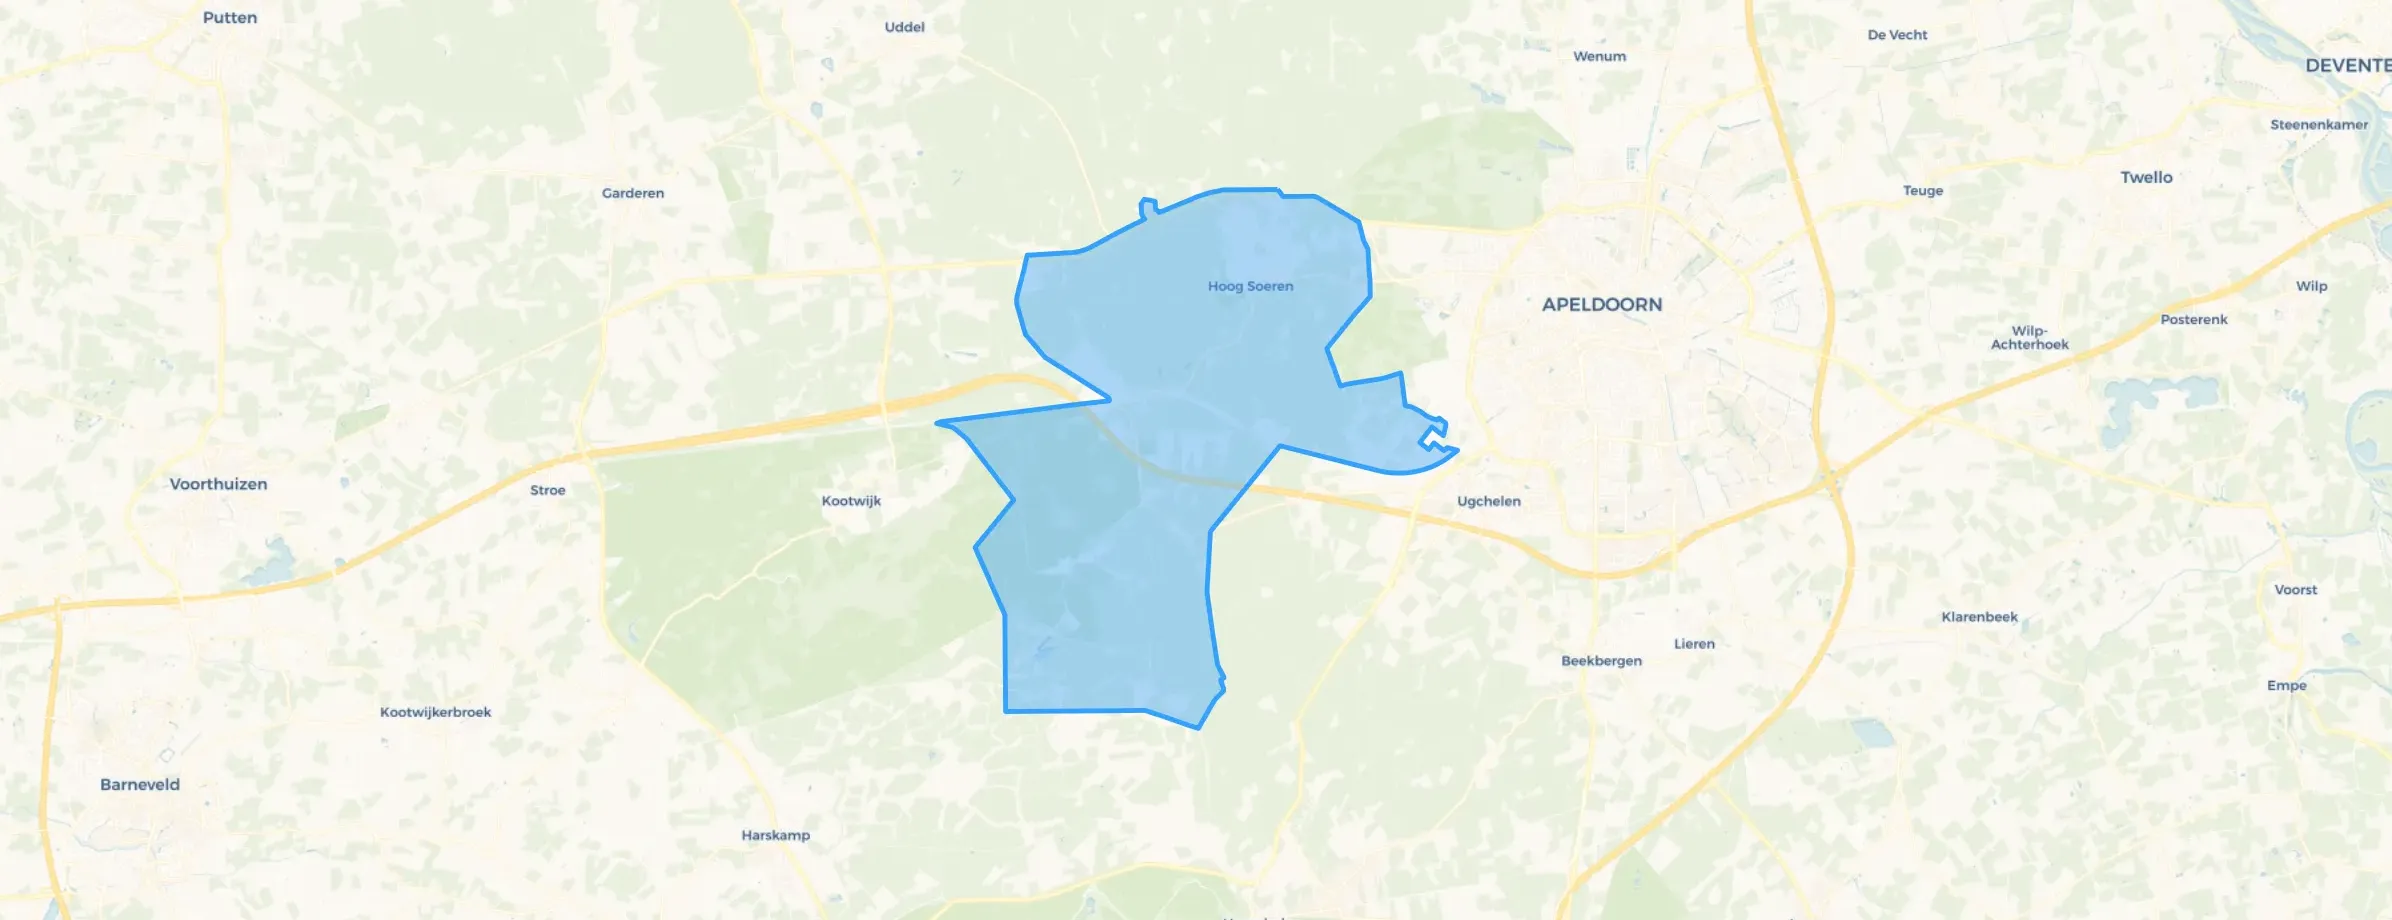
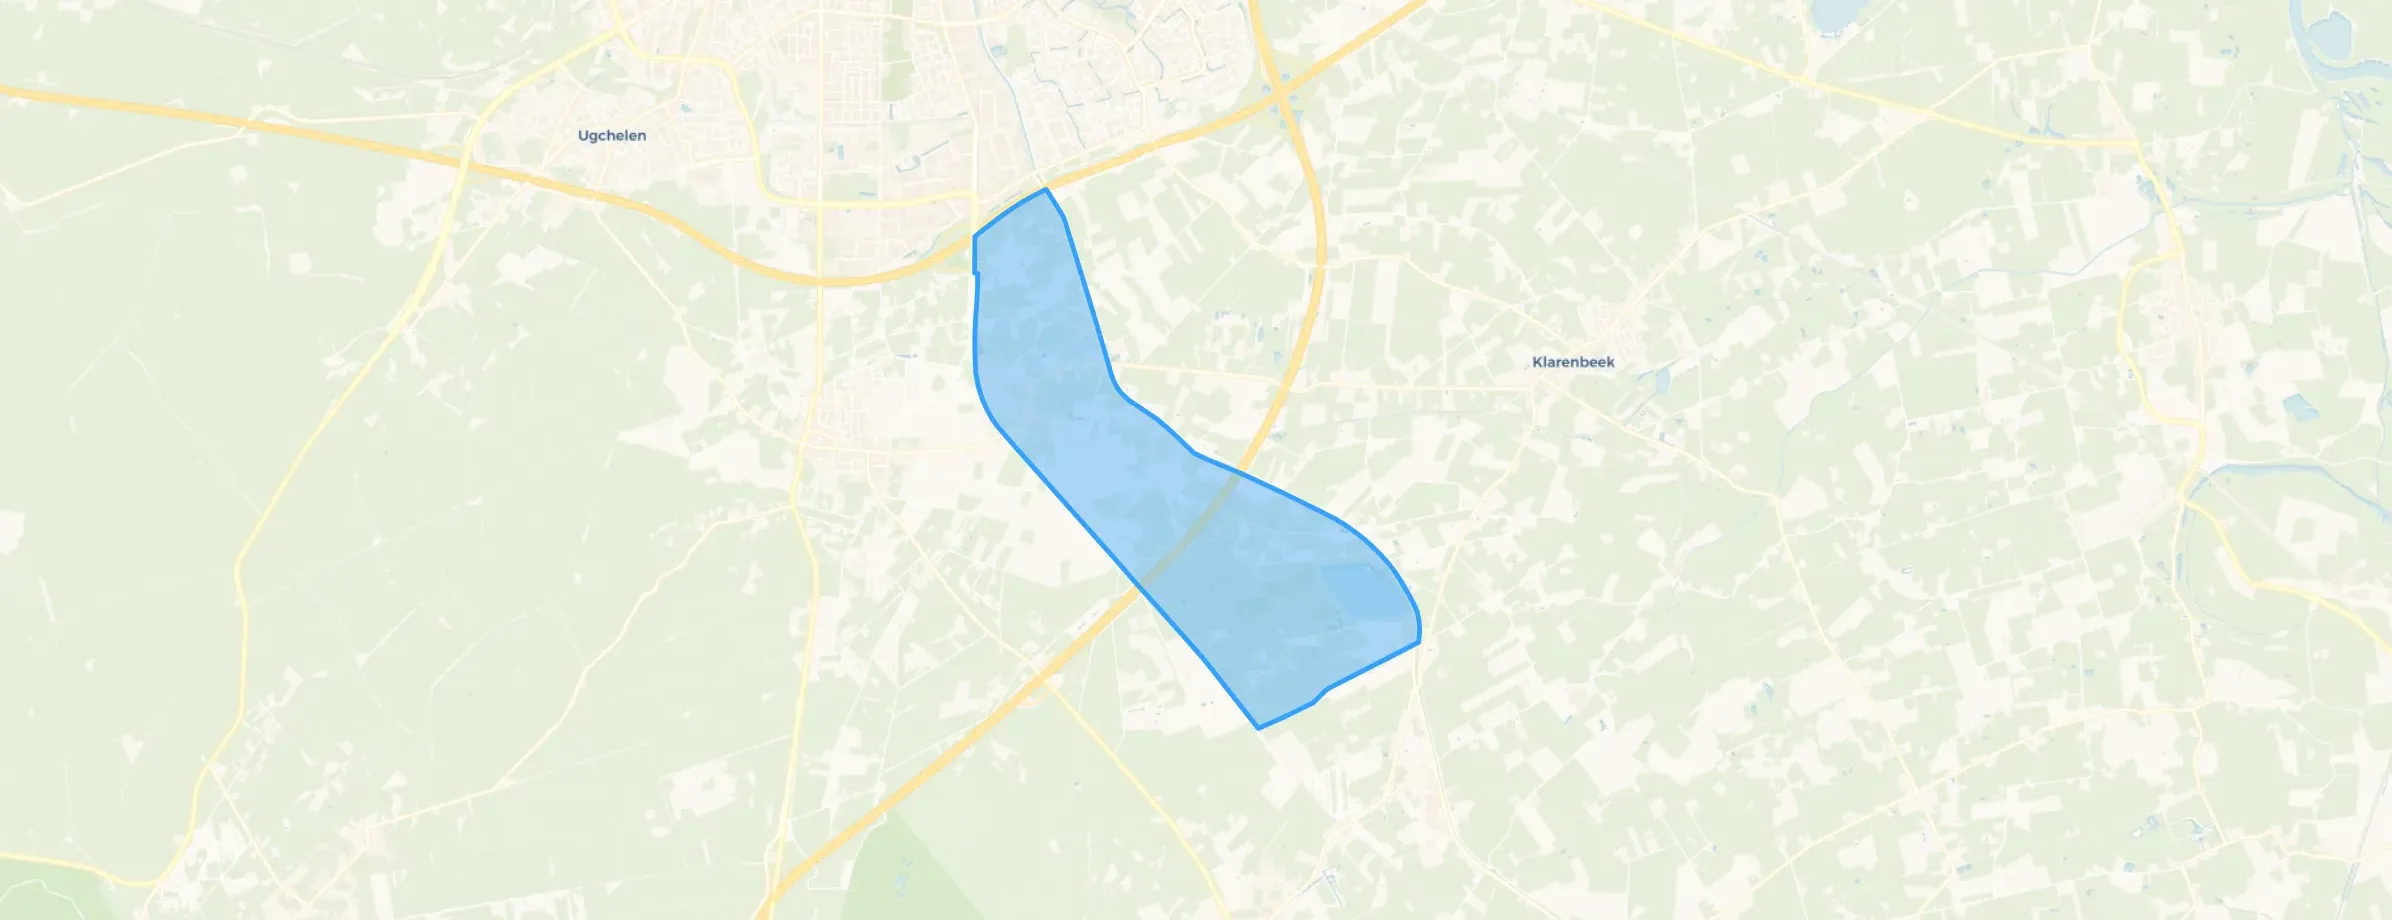
Een bende!! Veel rokers met honden en veel luidruchtige, asociale jeugd op fatbikes die met name op het winkelcentrum rondhangen. Nu is het een bende, met dezelfde jeugd die hun afval overal op straat en in het groen gooien, er is echt ZOVEEL zwerfafval, ongelofelijk. Ontzettend vies rondom vuilnisbakken ook. Zelden tot nooit is er toezicht of surveillance, misschien als het wat rustiger is, kennelijk durft niemand niemand aan te spreken op hun gedrag. Je voelt je er niet veilig ieg. Verder veel kleine oude woningen en grote flats en weinig scholen.
Auto-translated to English by AIIk heb 12 jaar in orde gewoond en je ziet echt dat de buurt keihard achter uit gaat mijn mening kijk lekker verder als je onder de normale mensen wilt wonen. Iedereen gooit zijn afval naast de containers. Scholen falen om vatsoenlijk Nederlandse te geven. De woning bouw doet niks aan de veiligheid van de huurders, willen camera toezicht maar wordt afgewezen. Bij de voorzieningen hangt alleen maar jongere waardoor de kleine kinderen hier niet veilig kunnen spelen.
Auto-translated to English by AIVery calm environment with very friendly people
Auto-translated to English by AIA simple neighbourhood but nowadays everything is being crammed into vacant houses. Families that mess up the front and back gardens. This has been reported several times but the housing association thinks it's fine and doesn't consider the neighbours. A school with a lot of traffic nuisance and dog owners who walk their dogs on a children's playground without cleaning up. There is also dealing on the school grounds in the dark evenings and it takes a while before the police or enforcement arrive.
Auto-translated to English by AINeighbourhood is nicely quiet
Auto-translated to English by AIused to be a fine area but for a few years now the living pleasure and safety in the neighbourhood have been declining a lot. drug dealing in the evening with a lot of noise and parking nuisance
Auto-translated to English by AII've lived here for 55 years now, but it's not getting any nicer. In the beginning it was good living. I live alone now; both my parents died here. I was allowed to stay, but now I live among very different kinds of people. I would like to leave, but the housing association sets so many requirements that I'll probably end up staying.
Auto-translated to English by AIEveryone does their best in this beautiful neighbourhood, just like the shopping centre de Eglantier around the corner. I have lived in de Warenargaarde for more than 20 years and am very satisfied, peace and hope that we may have it for a long time together with our neighbours.
Auto-translated to English by AIThe housing stock is mainly post-war — 53% was built between 1945 and 1990.
Over the past year a home for sale in Apeldoorn was listed for an average of €506,229 (€4,106 per m²). Last quarter prices rose by 5%.
A rental home in Apeldoorn cost an average of €1,398 per month (€15 per m²). That is 35% below the national average.
Residents give Apeldoorn a 7.2 out of 10 based on 74 reviews. Especially nature and greenery (8.0) scores well; community (7.0) receives the lowest rating.
The housing supply in Apeldoorn is remarkably efficient: 52% has an A, A+ or B label. The average natural gas consumption per household is 860 m³ per year.
From Apeldoorn you can on average reach a supermarket at 0.9 km, a GP at 0.9 km, a railway station at 3.3 km, a primary school at 0.7 km (as the crow flies, source: CBS).
Right now you will find 894 homes for sale and 58 homes for rent in Apeldoorn.







