Municipality in Noord-Brabant
Best is located in the province of Noord-Brabant The municipality has a total area of 3.465 hectares, of which 3.389 hectares are land and 76 hectares are water. The municipality is coded as GM0753. The postcode area is 5681BA-5685JZ.
Best has 31.652 residents. Of these, 50,1% are men and 49,9% are women. Most residents are 45 to 65 years (27,9%). The other age groups are 25,1% for '25 to 45 years', 20,7% for '65 years or older', 15,2% for '0 to 15 years' and 11,1% for '15 to 25 years'. Of the residents, 45,2% is unmarried, 43,1% is married, 7,2% is divorced and 4,5% is widowed. 24.386 residents originate from the Netherlands, 2.888 come from Europe and 4.378 come from countries outside Europe.
There are 13.948 households in Best. 31,5% of these are single-person households, 32,1% households without children and 36,3% households with children. The average household size is 2,3 persons. The national average is 2,1 persons.
In Best there are 25.800 income recipients. The average income per income recipient is €44.800, which is €2.600 (6%) higher than the national average of €42.200. Per resident, the average income is €37.200, which is €2.300 (7%) higher than the national average of €34.900. Most residents of Best are educated to an intermediate level. 39,4% have an intermediate education (HAVO, VWO or MBO 2-4), 38,2% have a university or higher professional education (HBO/WO) and 22,4% have a lower education (VMBO or MBO 1).
Of the 31.652 residents, around 75% are in paid employment, which amounts to 23.739 people. This is 3% higher than the national average of 72%. The majority of workers are in salaried employment (86%), while 14% are self-employed. In Best, 24% of residents receive a benefit. The largest group is those receiving a state pension (AOW). 5.890 people receive this benefit.
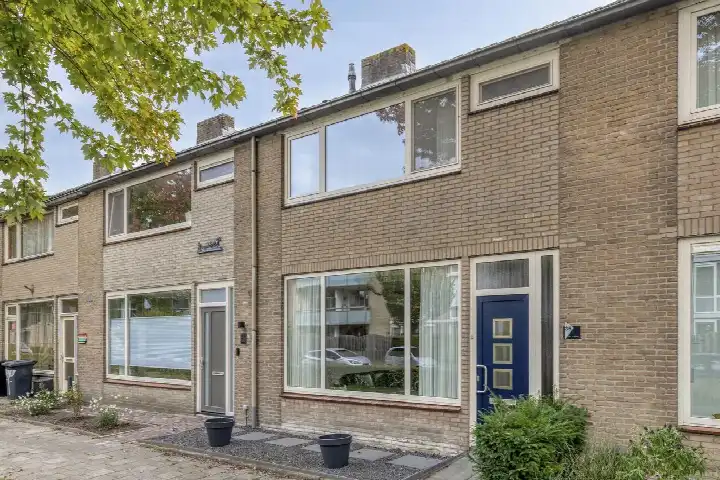
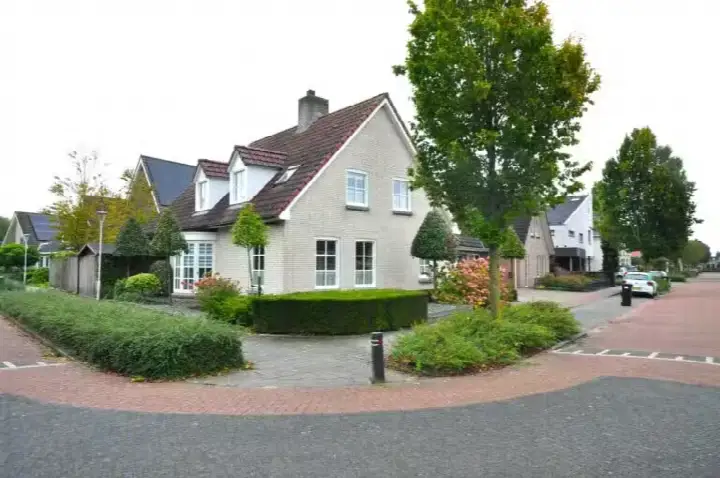
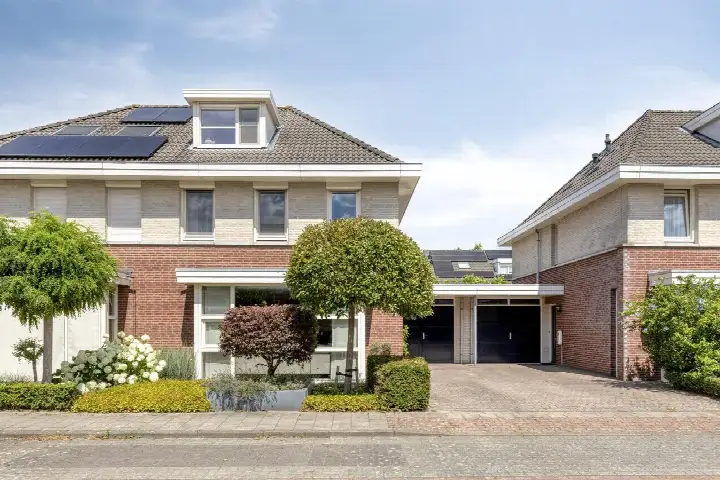
In Best there are 13.650 homes with an average assessed value (WOZ) of €464.000. Of these, around 98% are occupied and 2% unoccupied. Most homes are owner-occupied. This amounts to 29% rental homes and 71% owner-occupied homes. Of the homes, 71% privately owned, 20% owned by housing associations and 9% owned by other landlords. The most common construction periods in Best are 1950-1970 (22%) and 1990-2000 (17%).
There are currently no homes for sale in Best. The most recently listed home is Burgemeester Notermansstraat 9 by Best Housing op Funda. No homes were sold in Best over the past year.
There are currently no homes for rent in Best. The most recent home is Koningin Julianaweg 45A, offered by www.wooniezie.nl. No homes were let in Best over the past year.
No recent rental data available for Best.
In Best there are 9.345 addresses with a registered energy label. The most common labels are A (34%), C (18%) and B (17%). On average, an address in Best uses 2.940 kWh of electricity per year. This is 15% above the national average of 2.550 kWh. Natural gas consumption, at 860 m³ per year, is 8% above the national average of 800 m³.
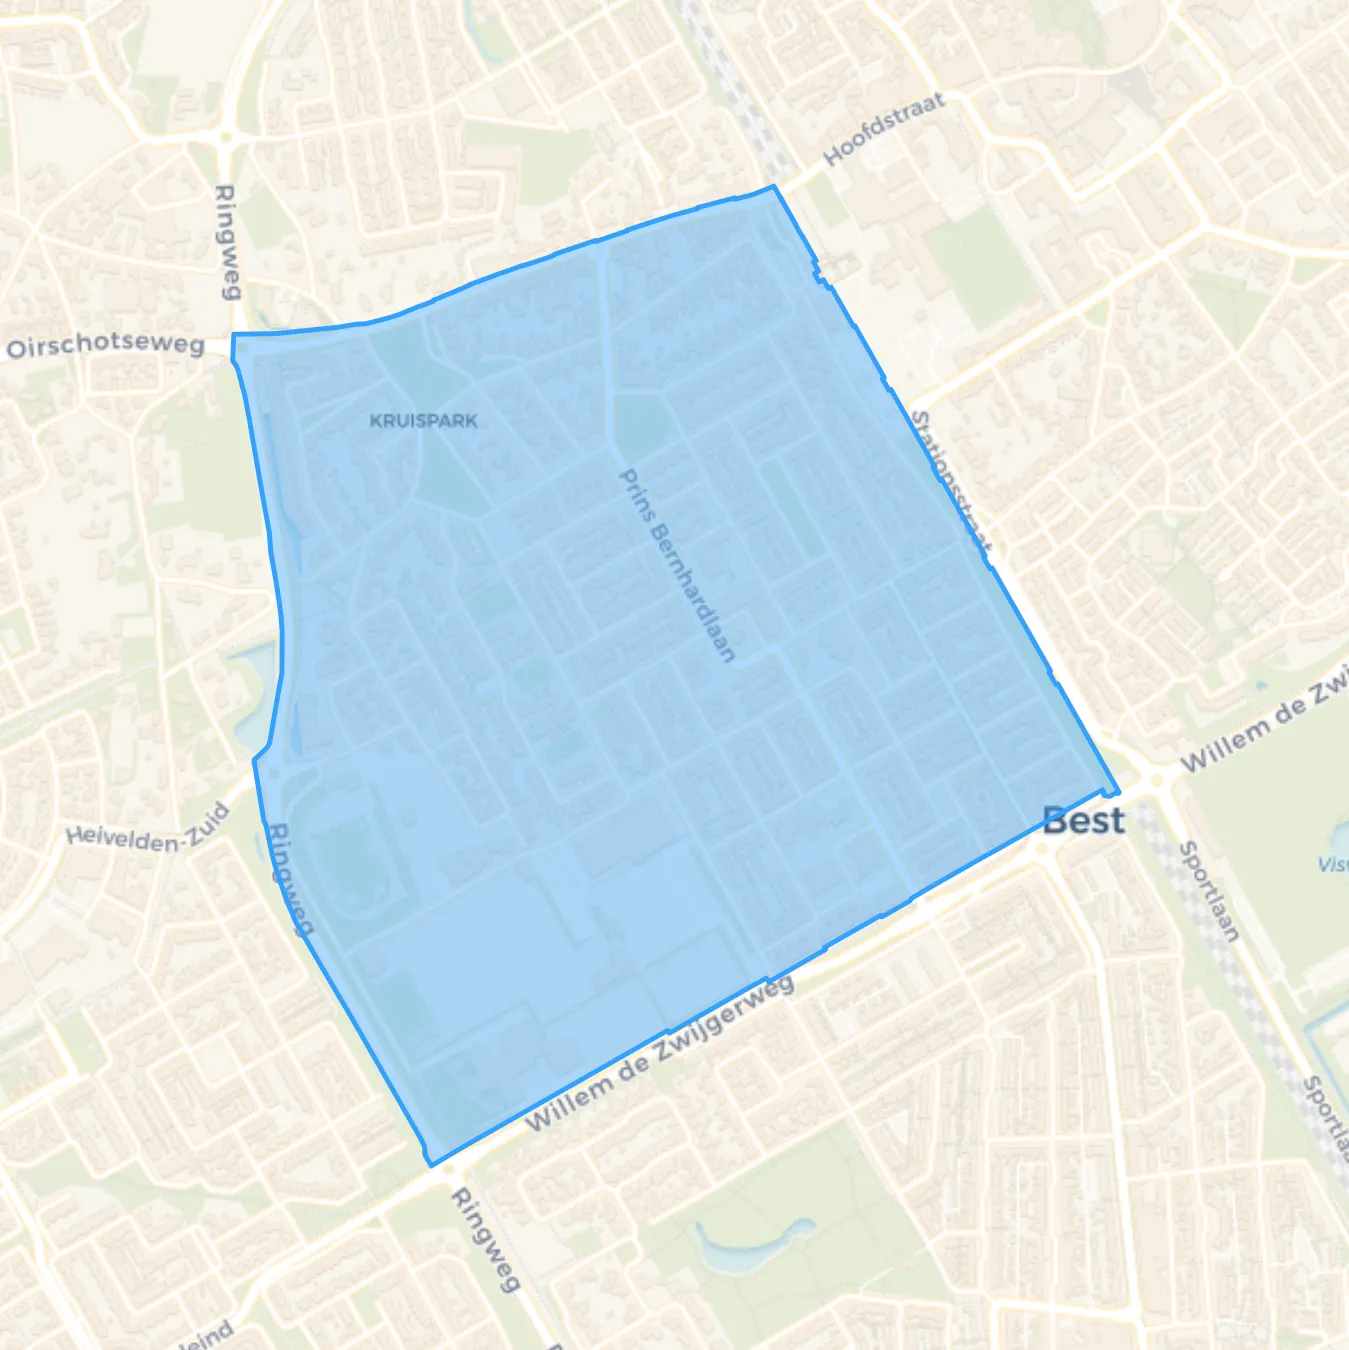


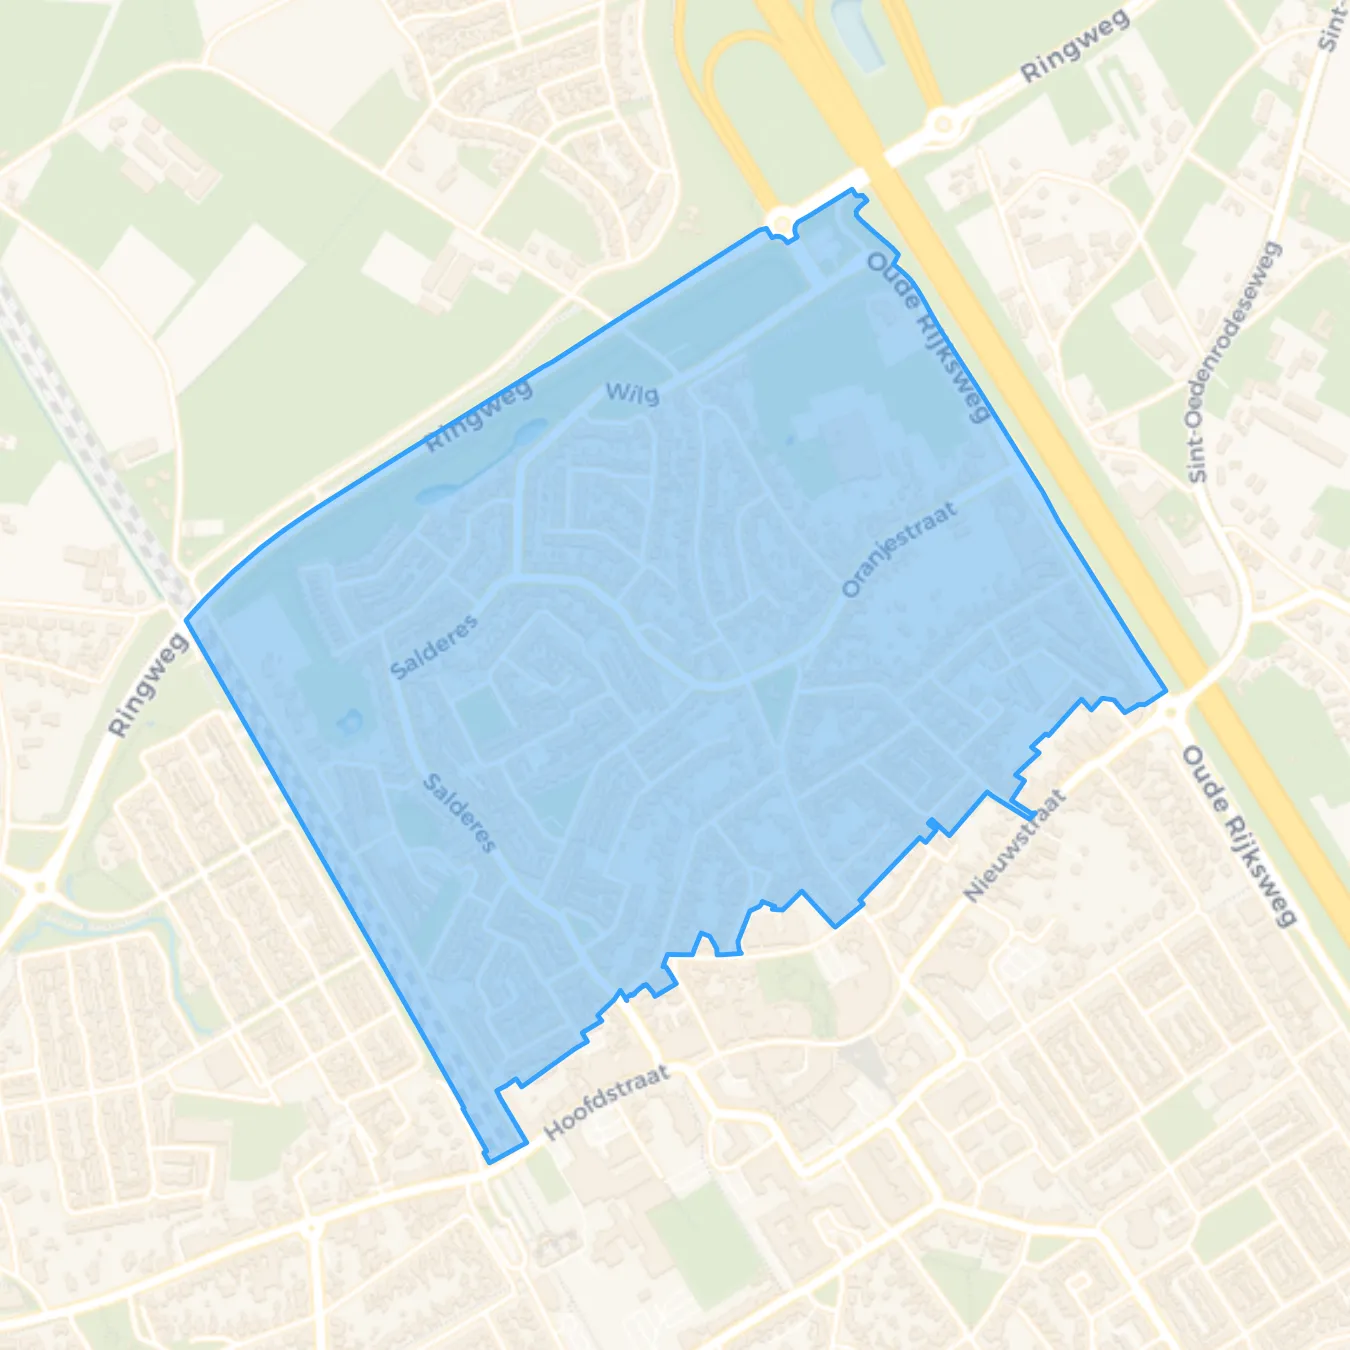
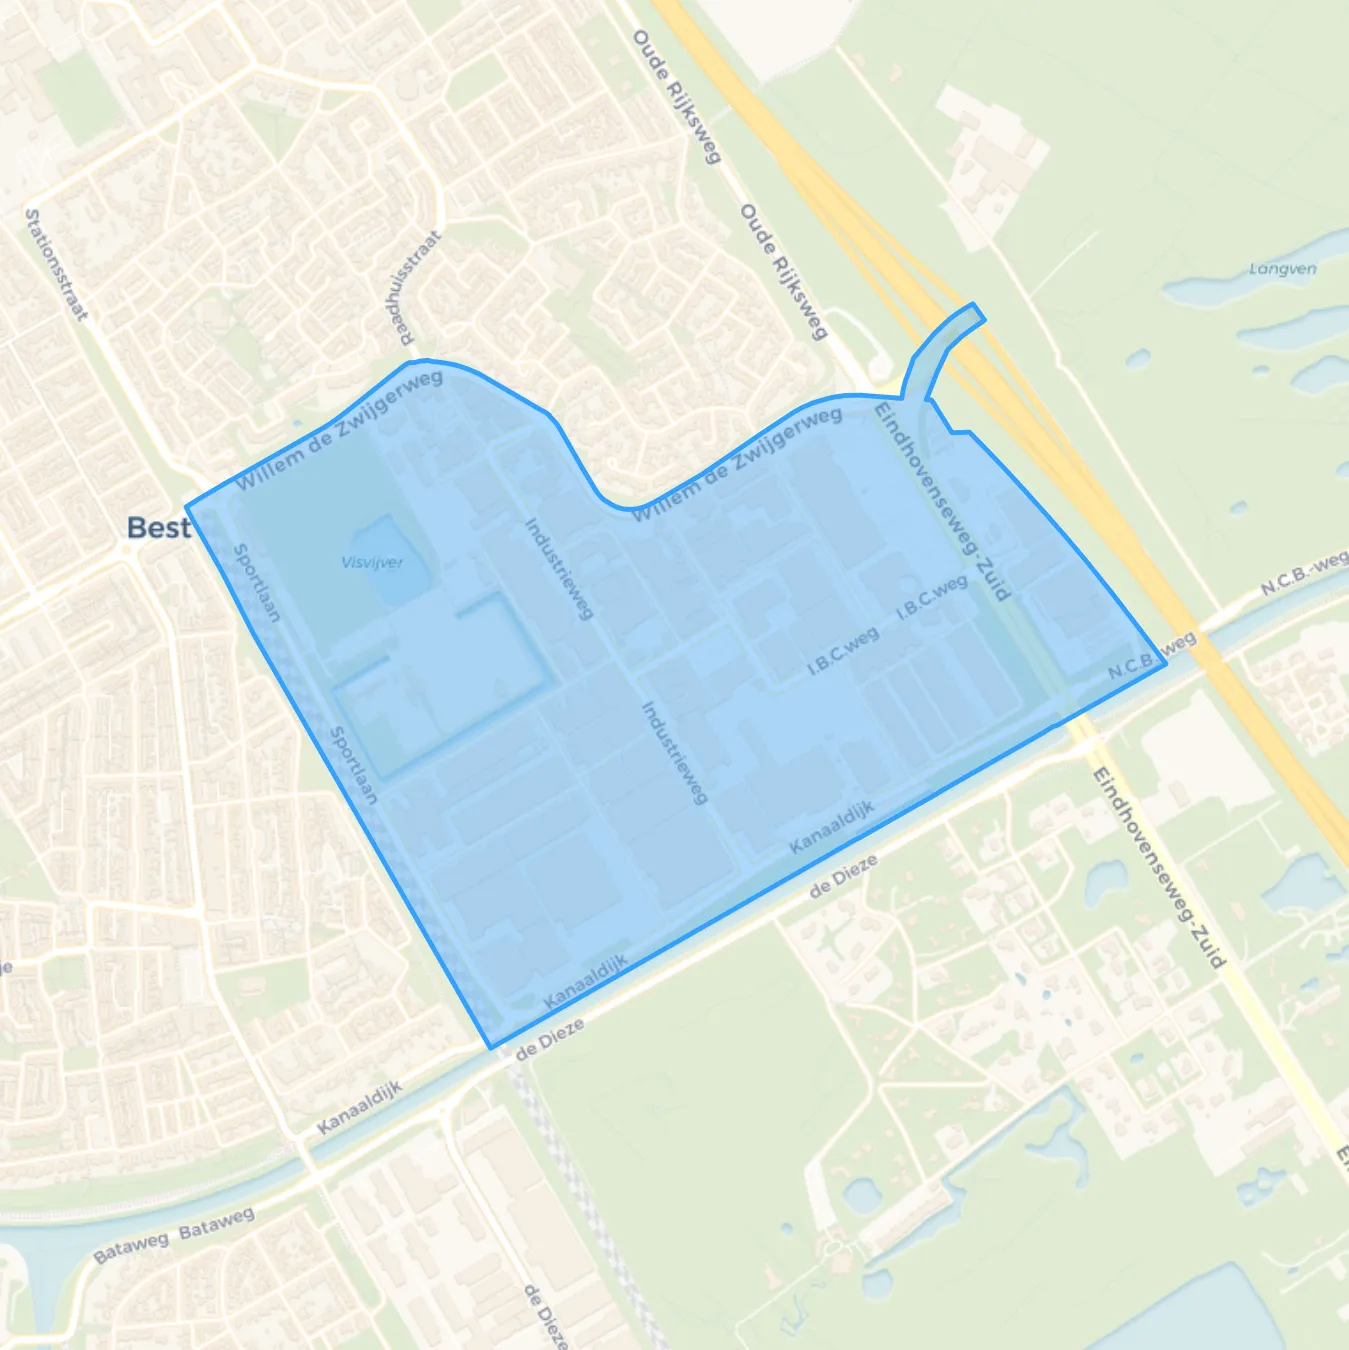

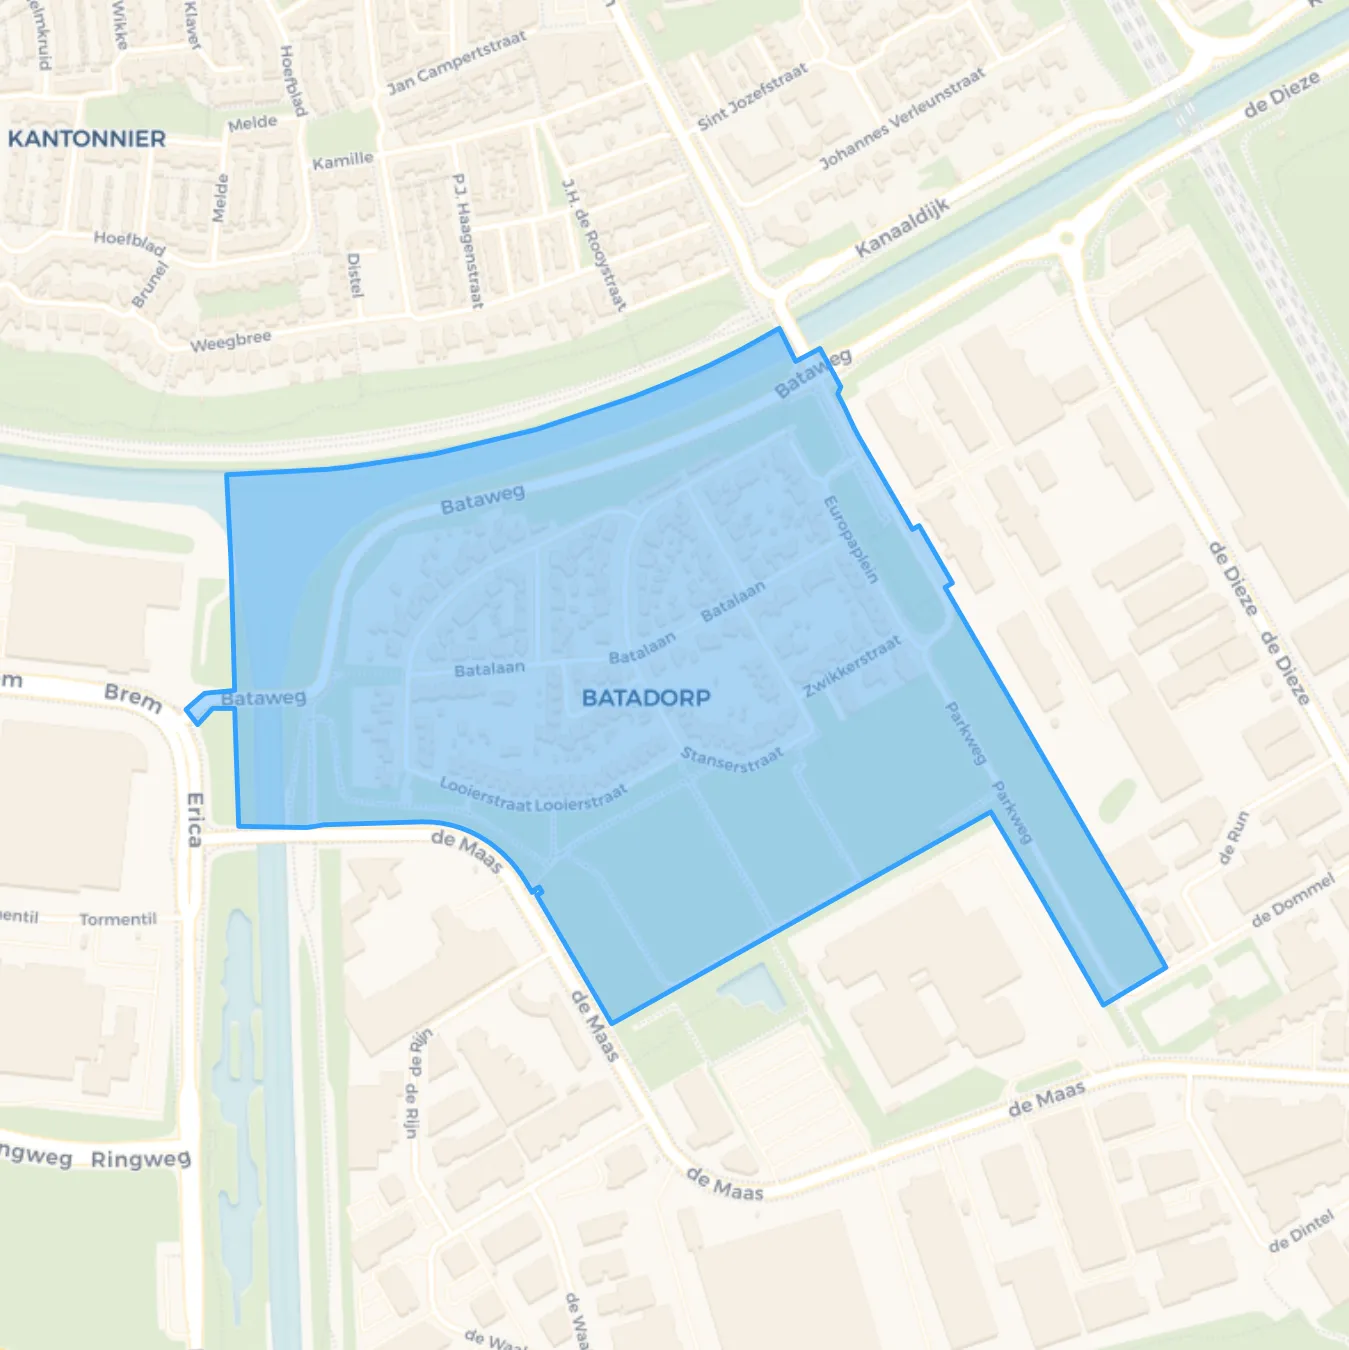
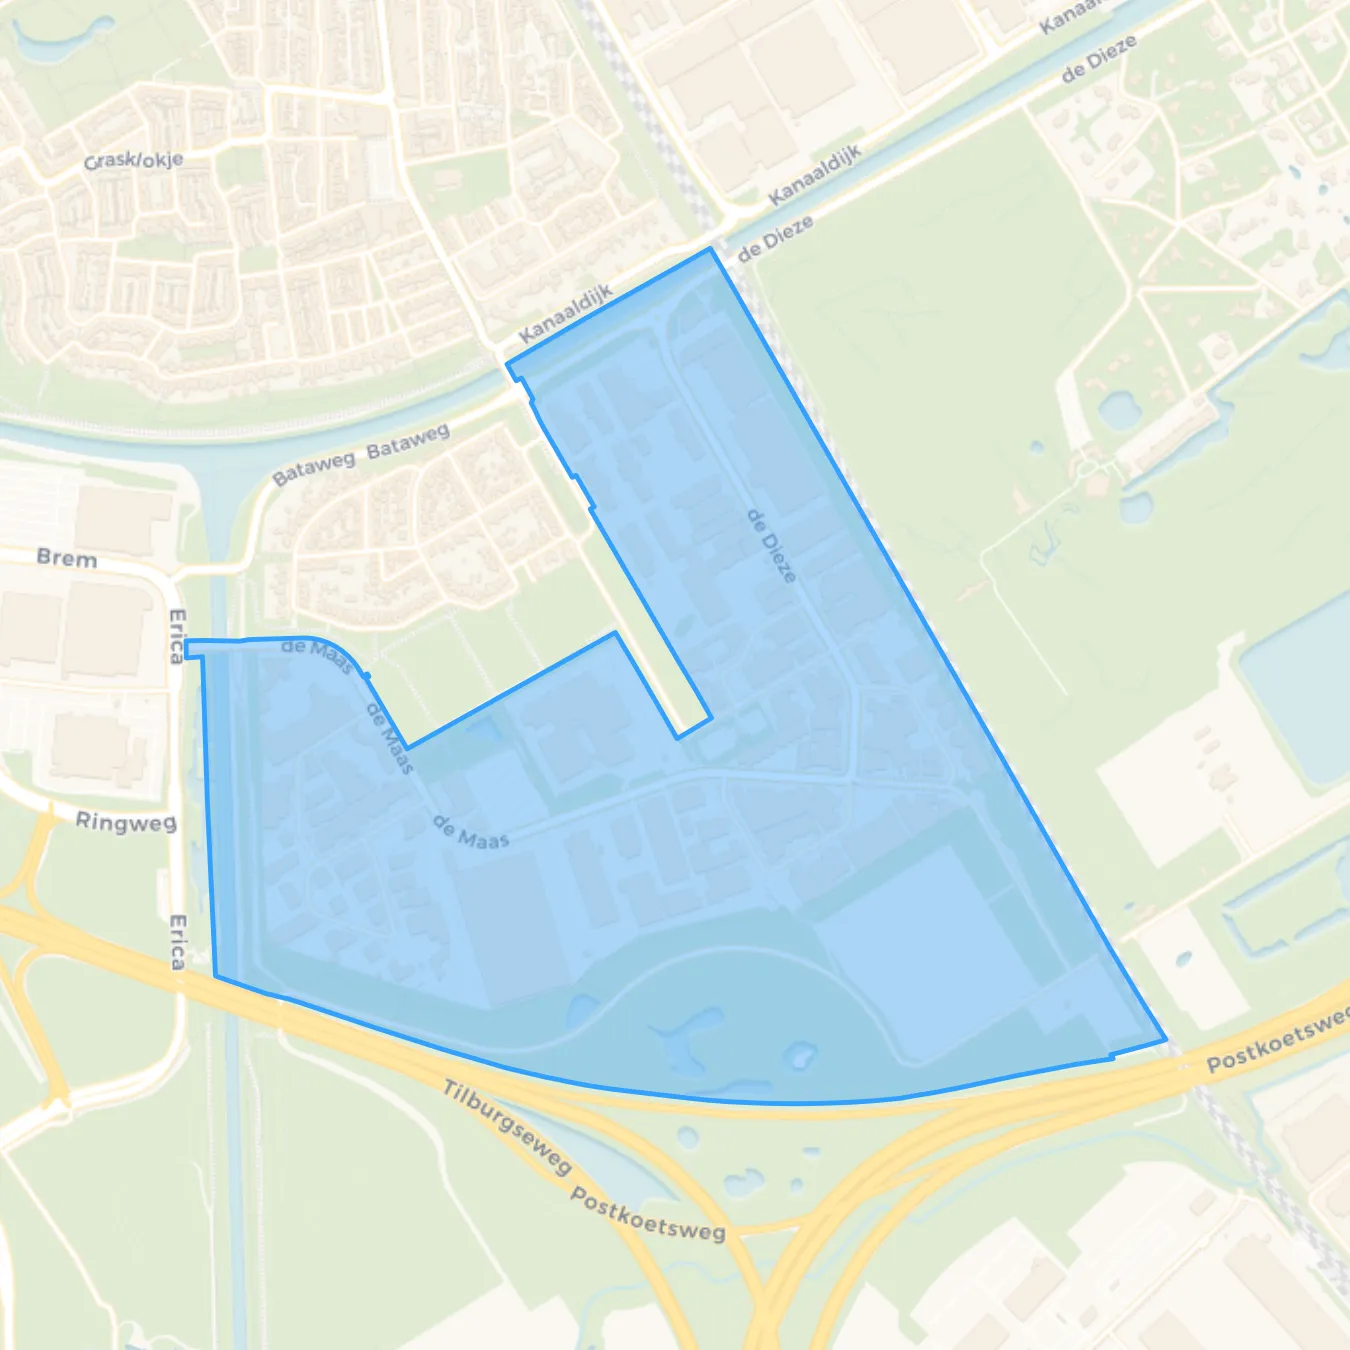
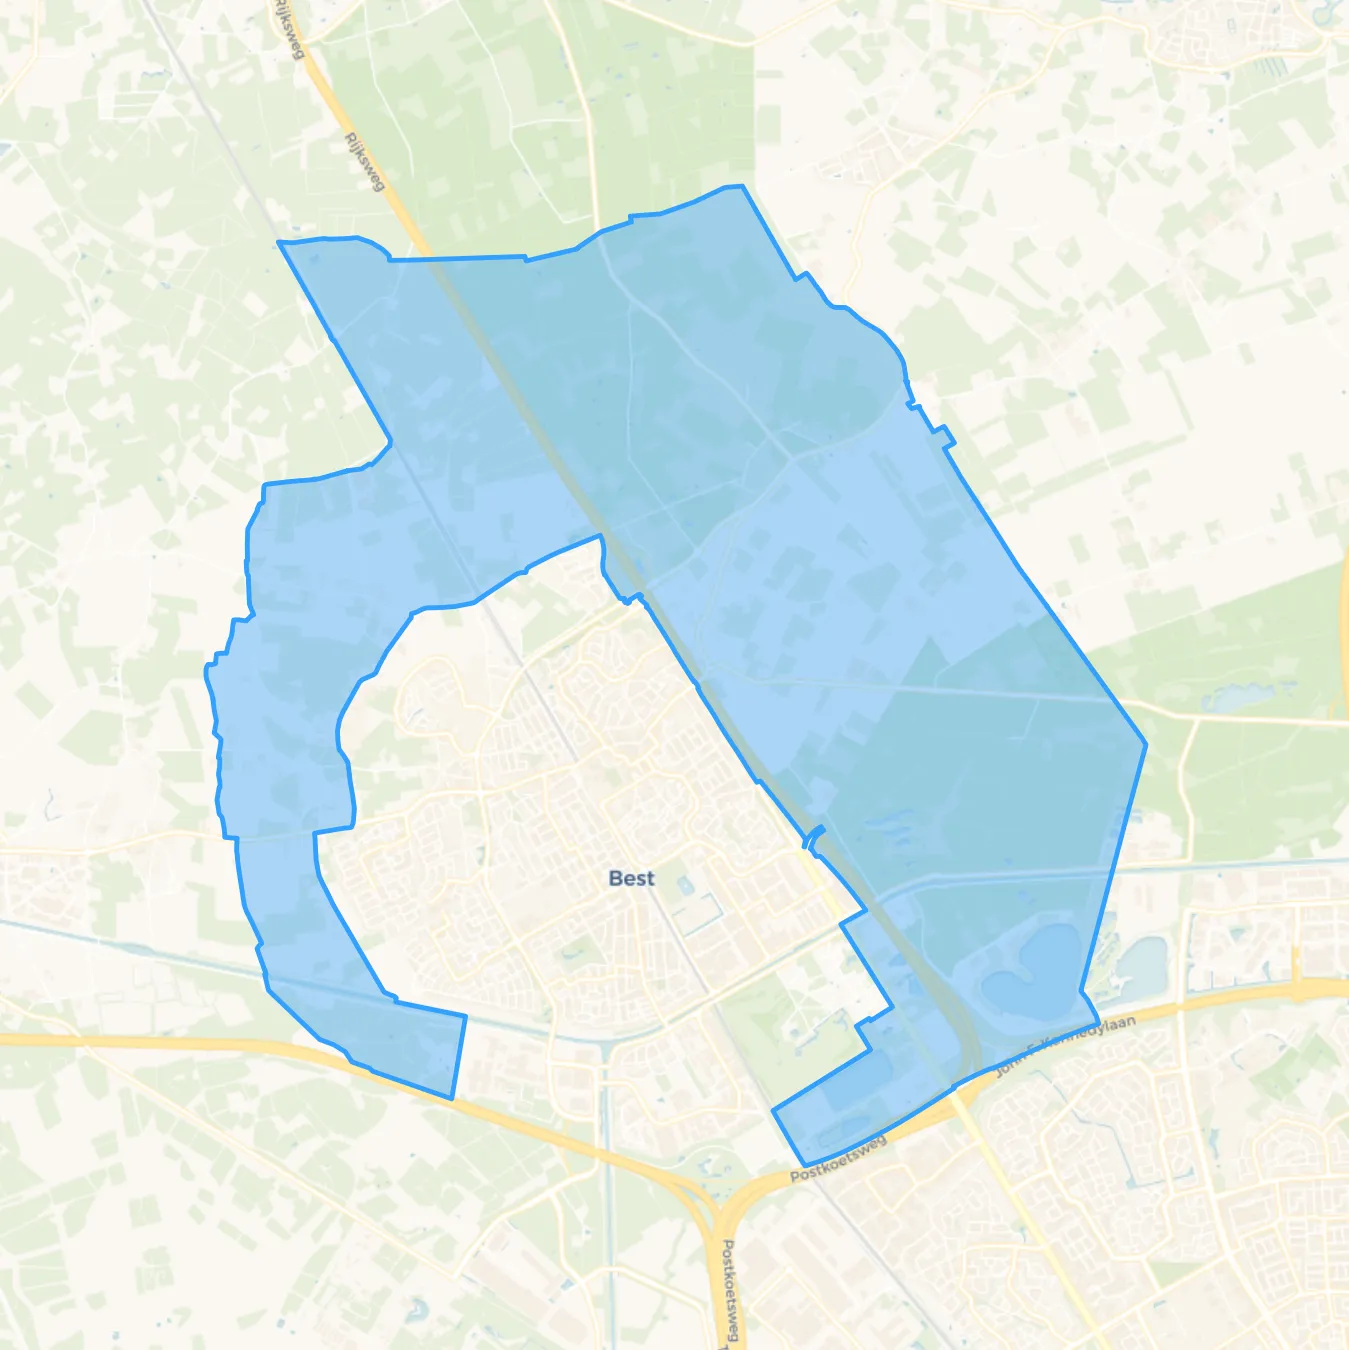
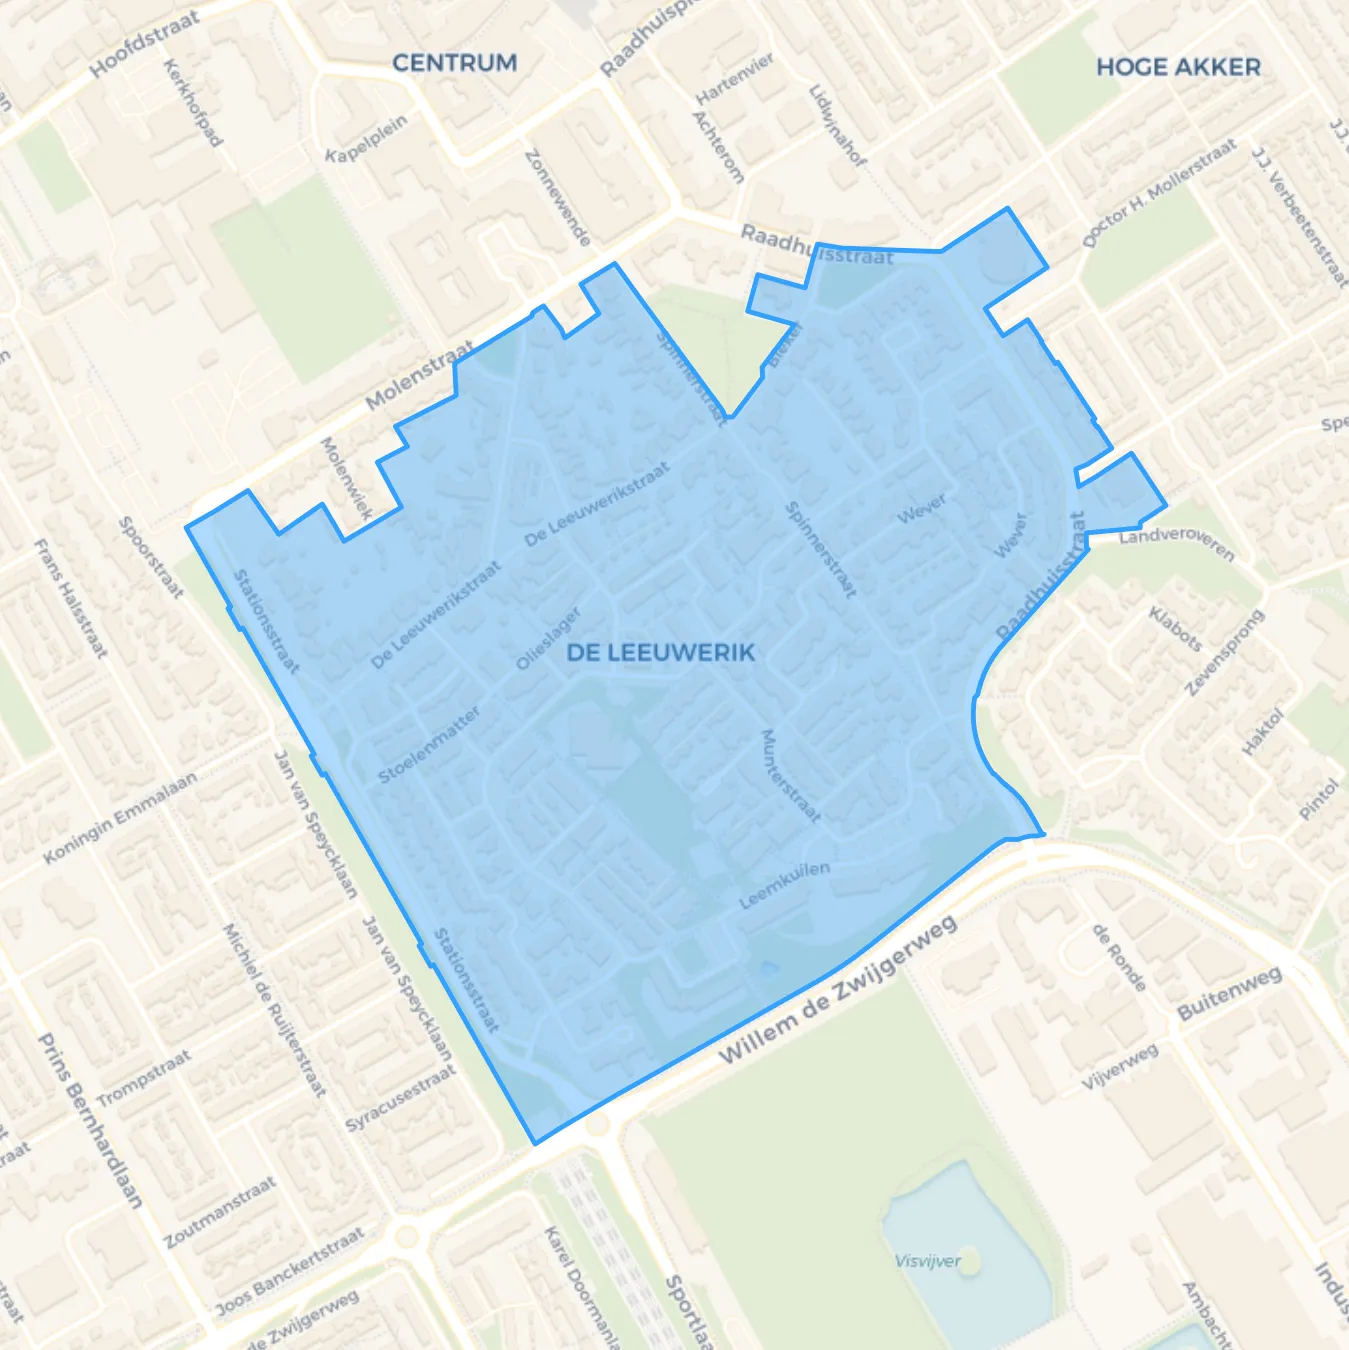
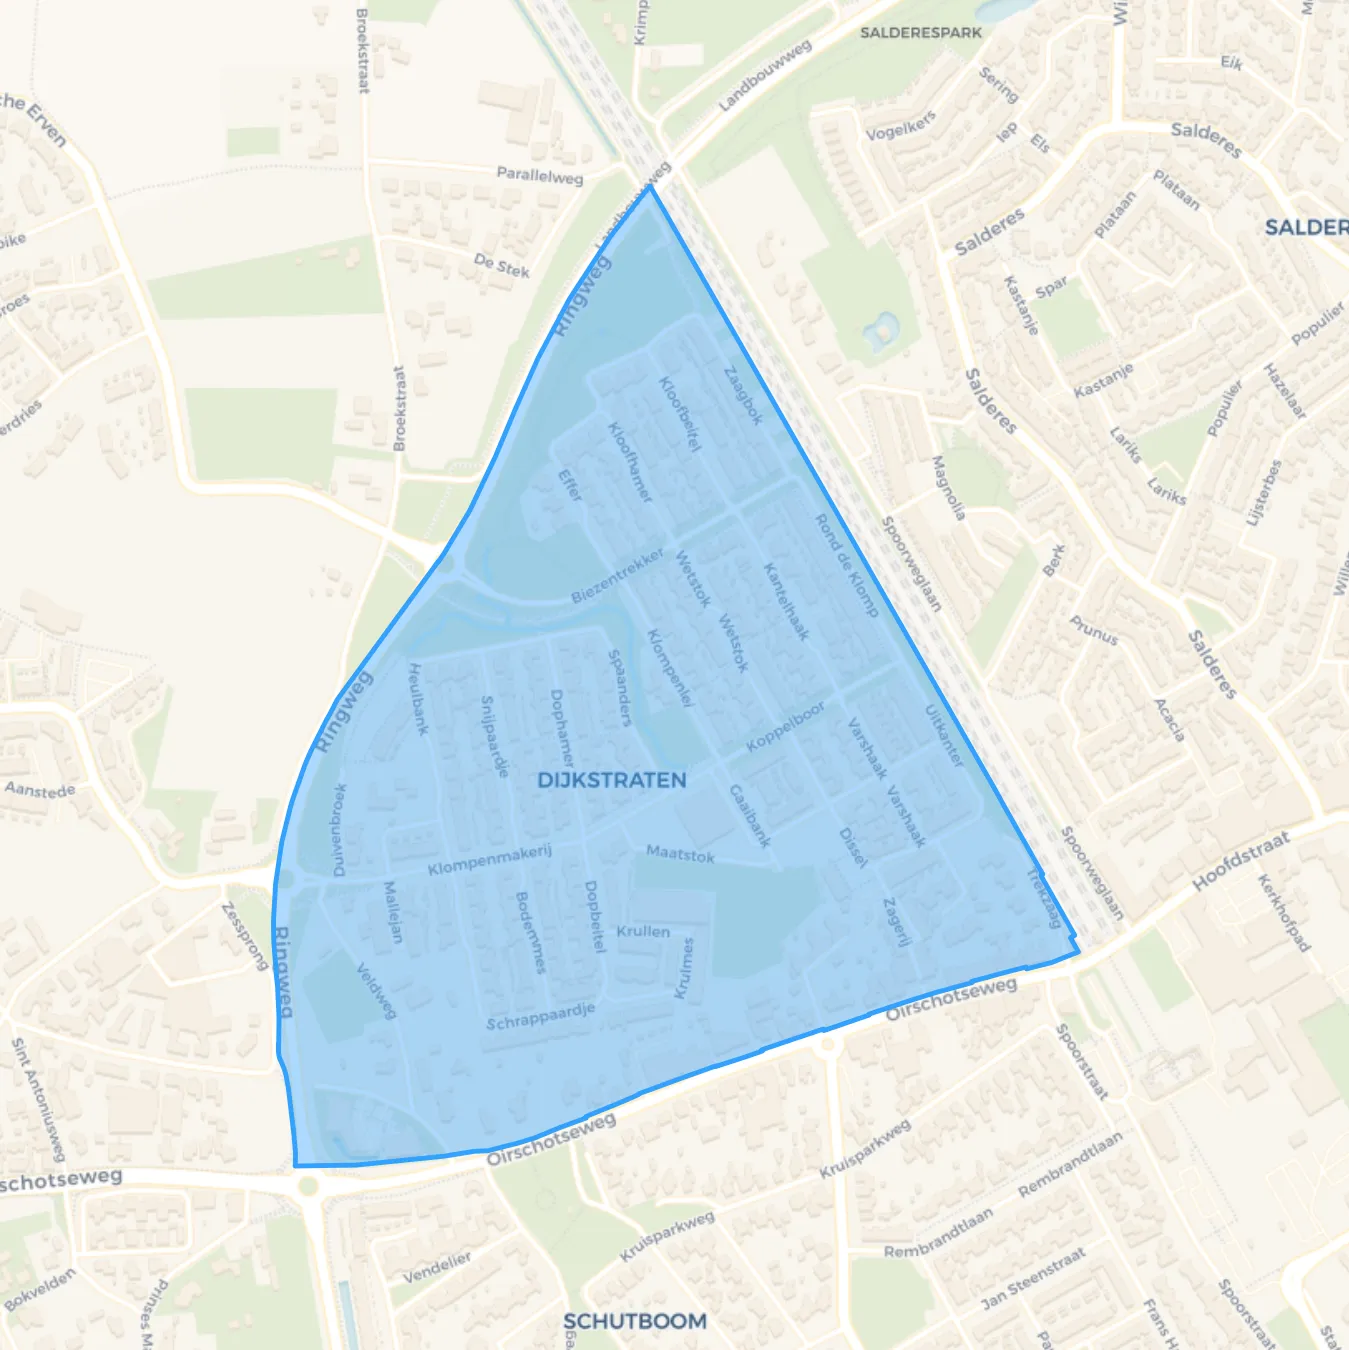
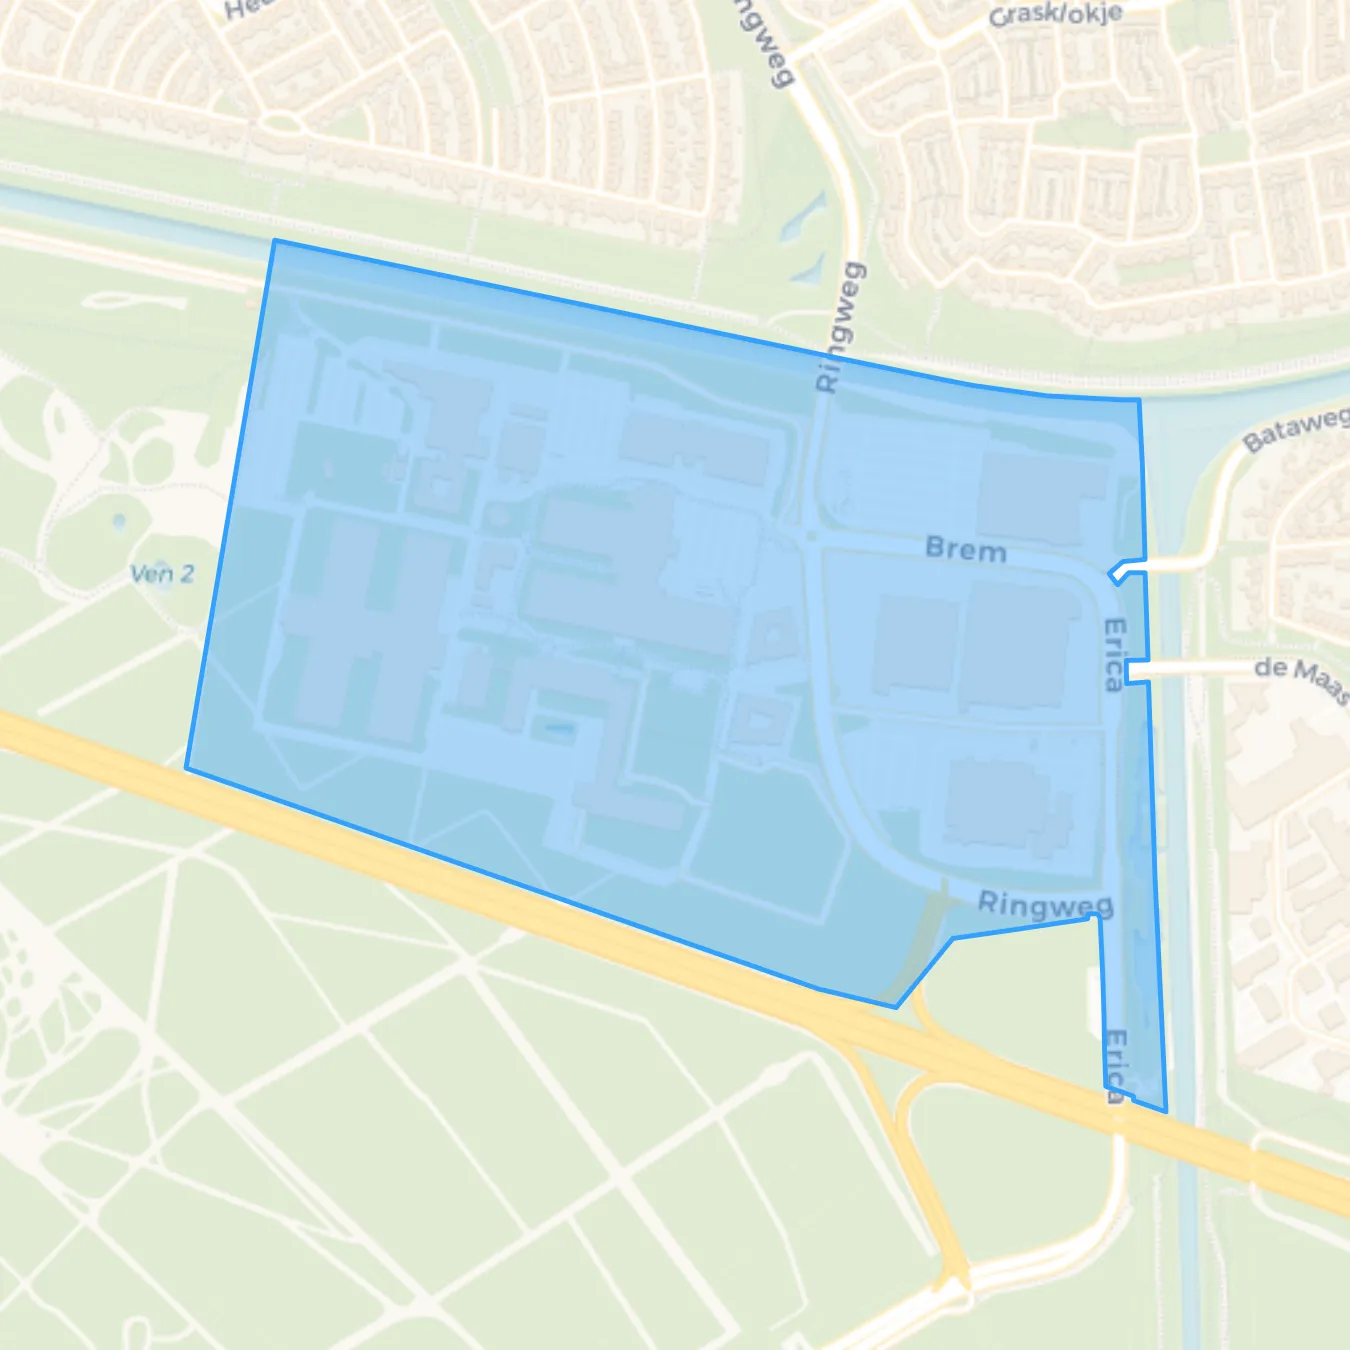
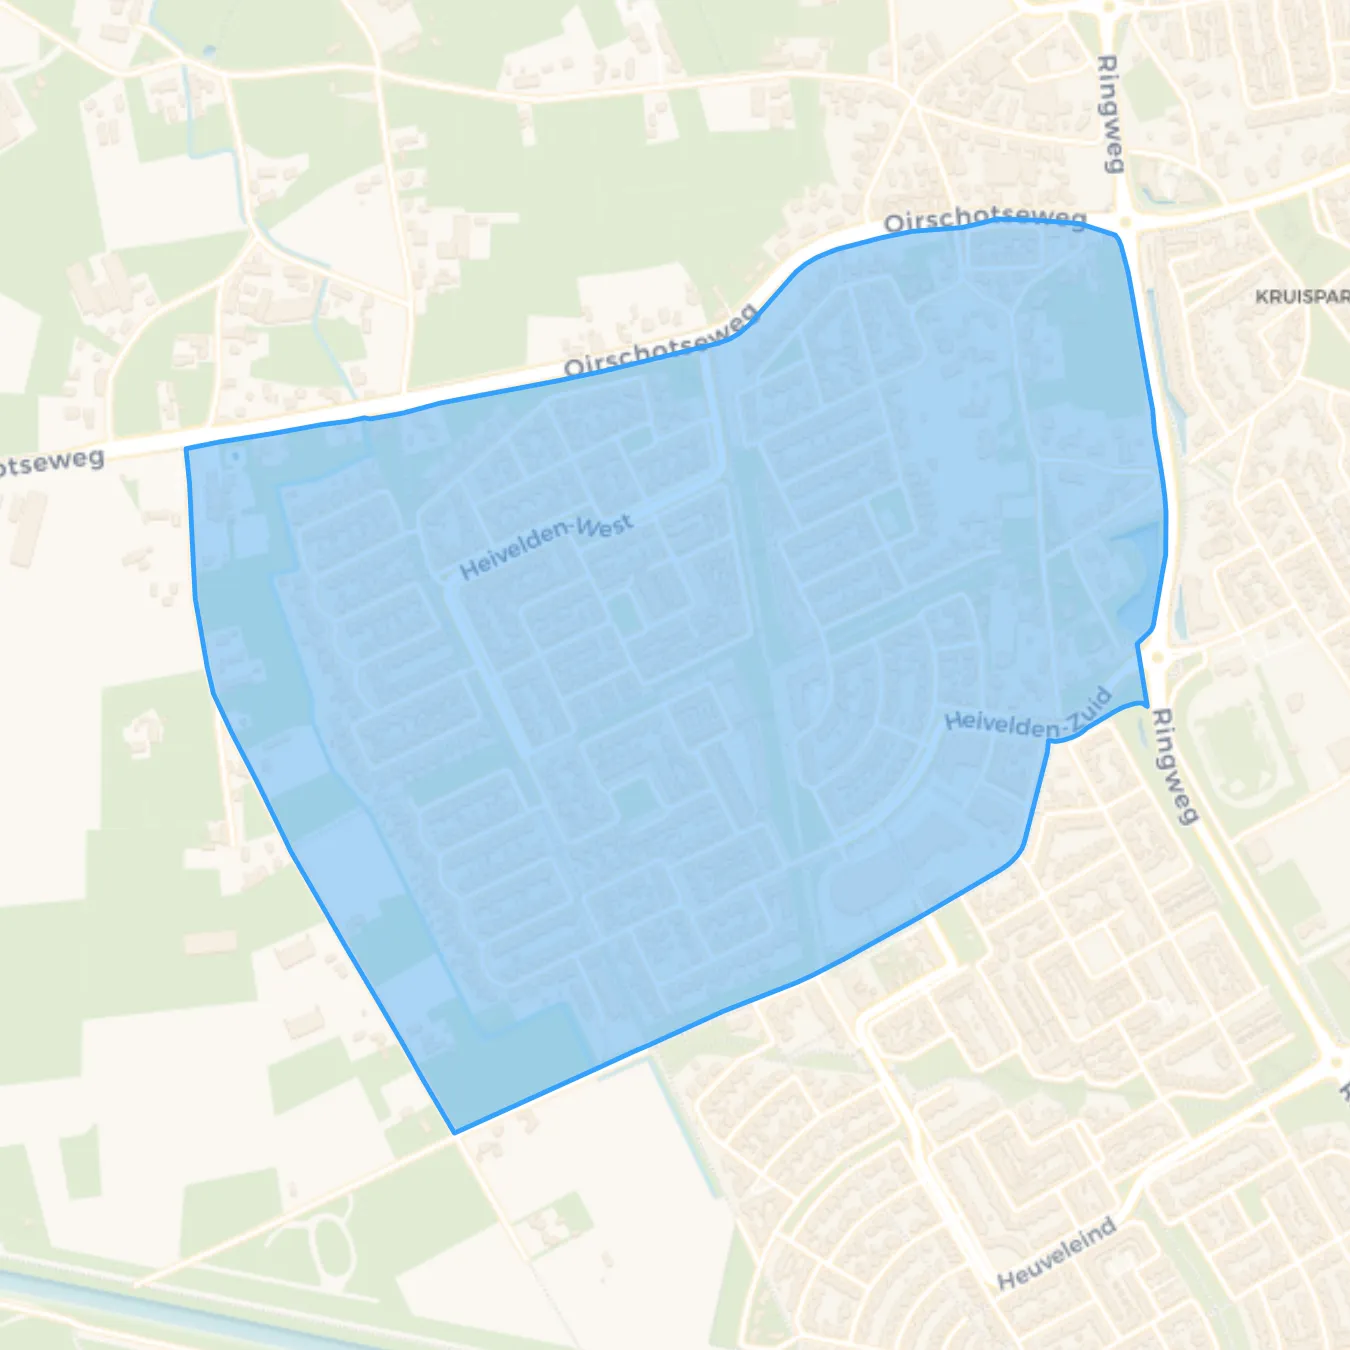
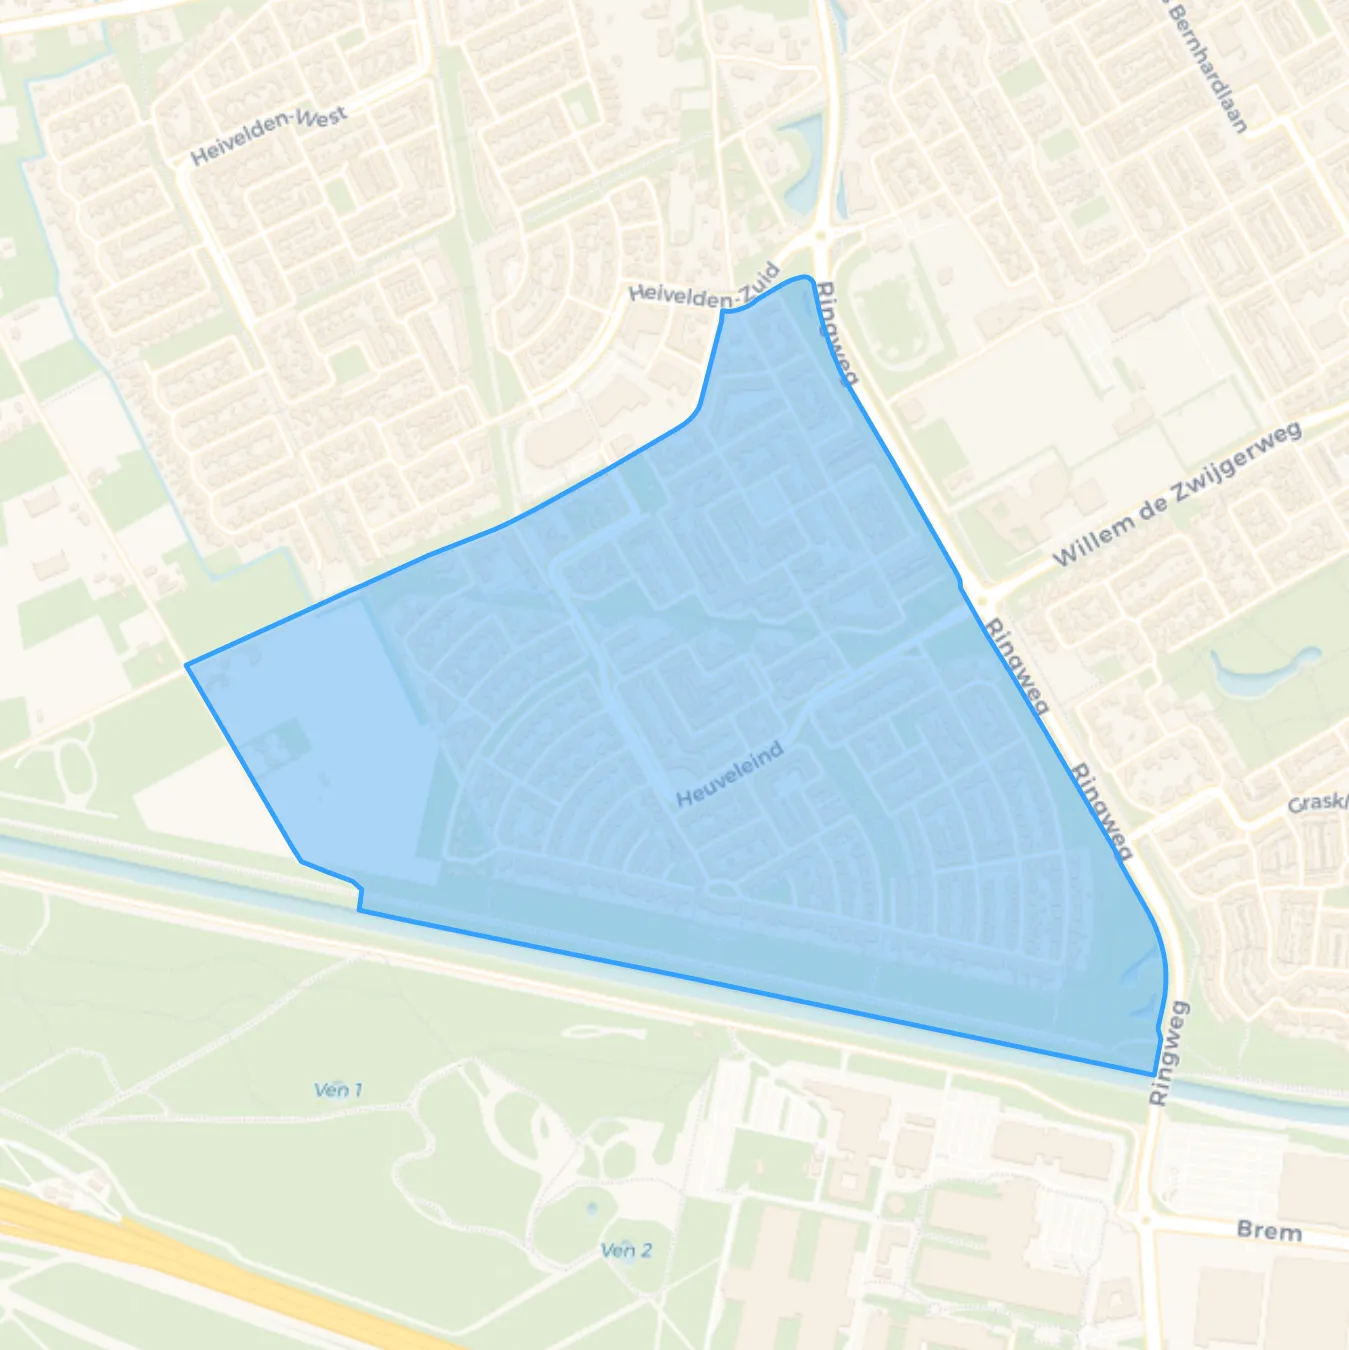
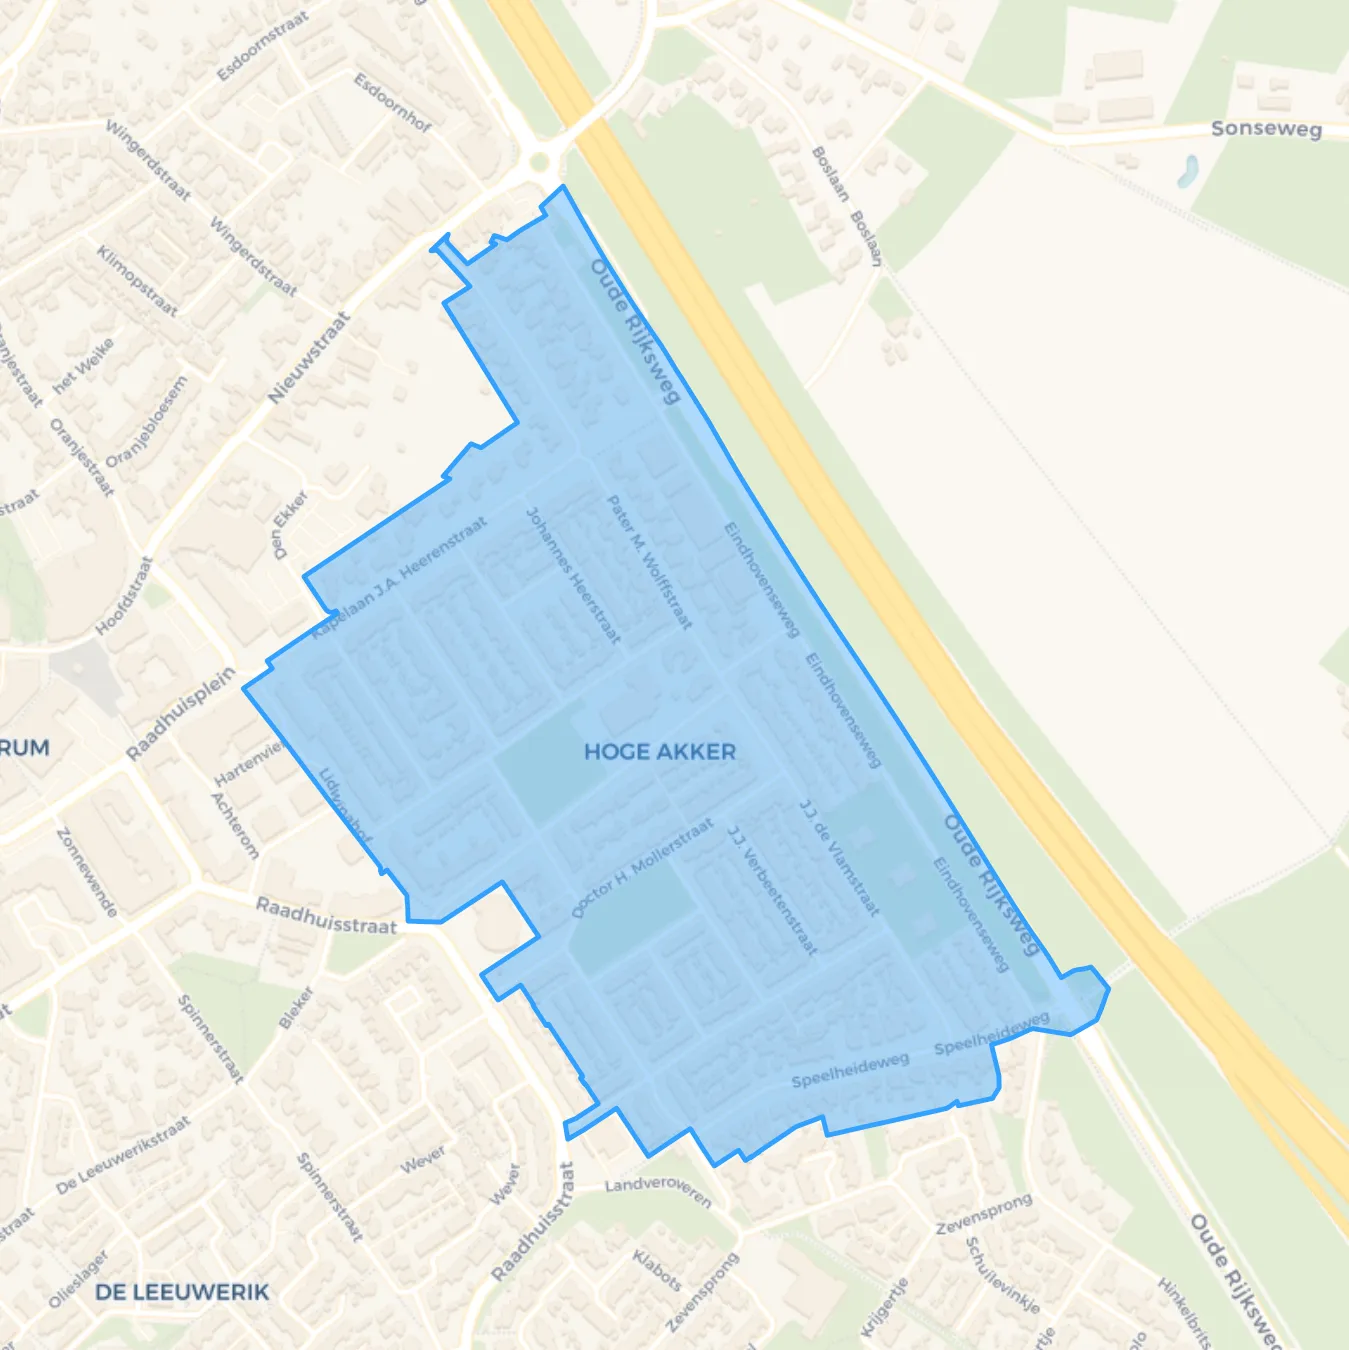
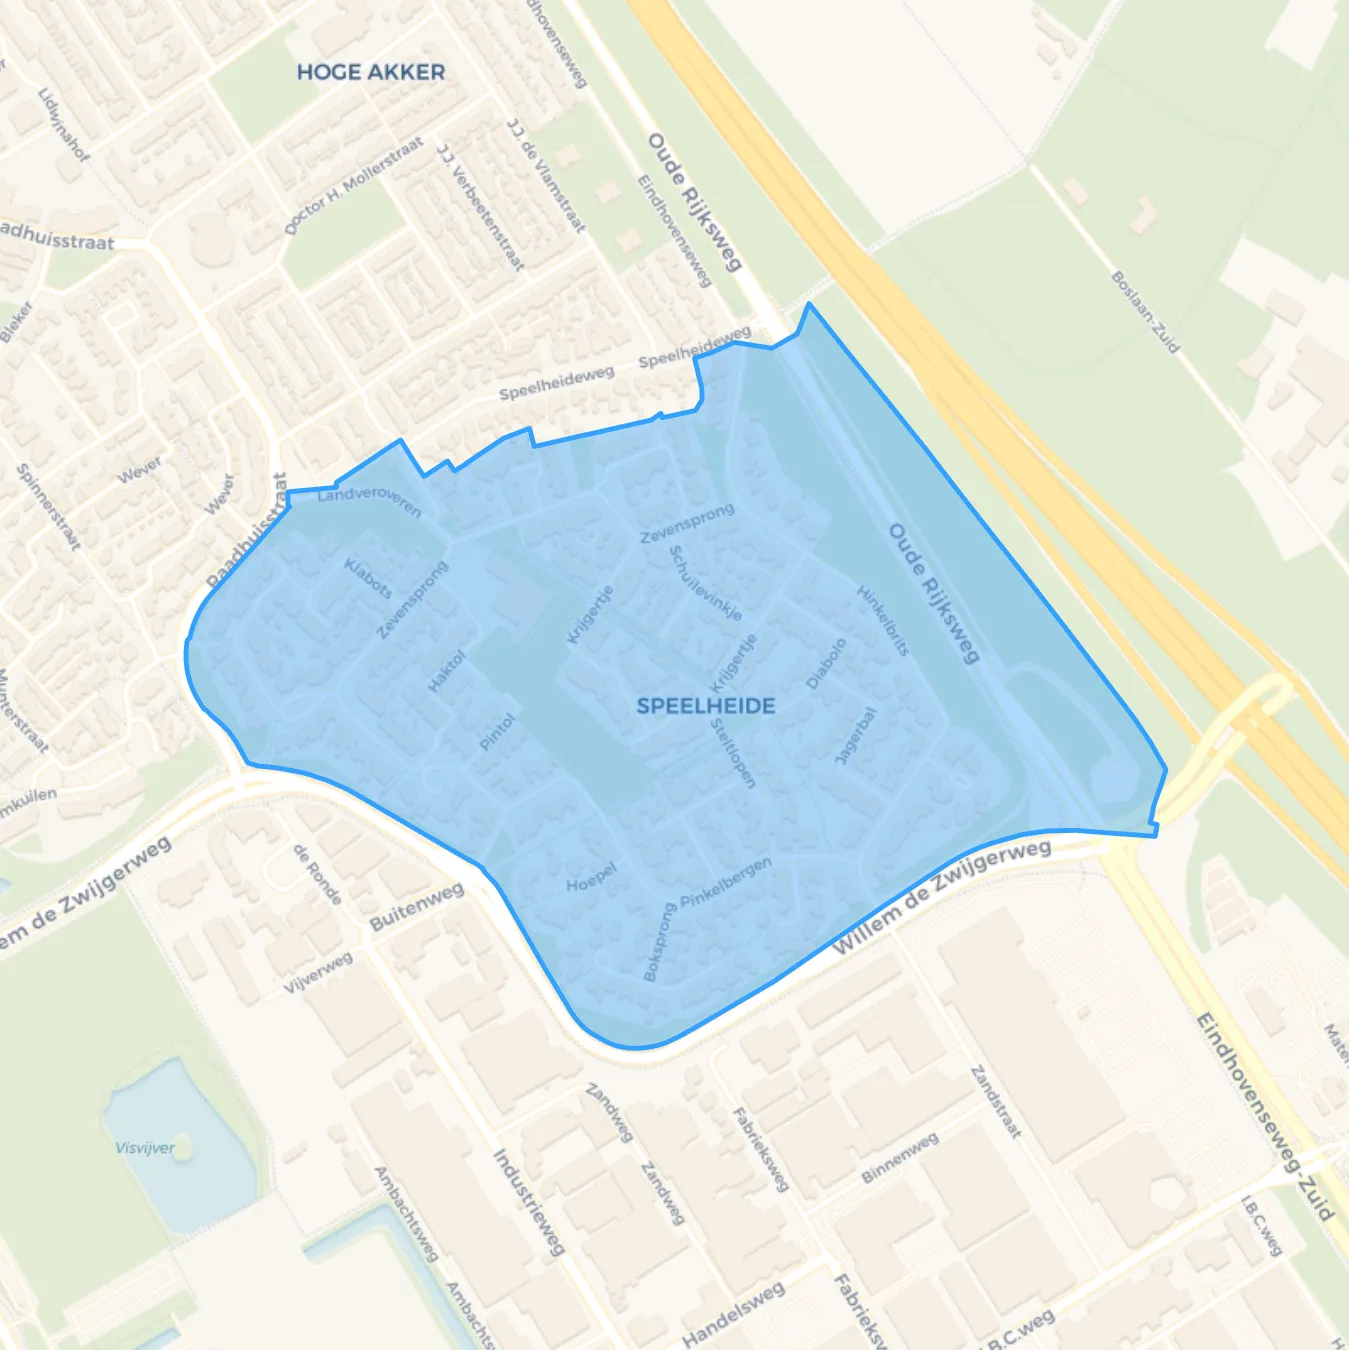
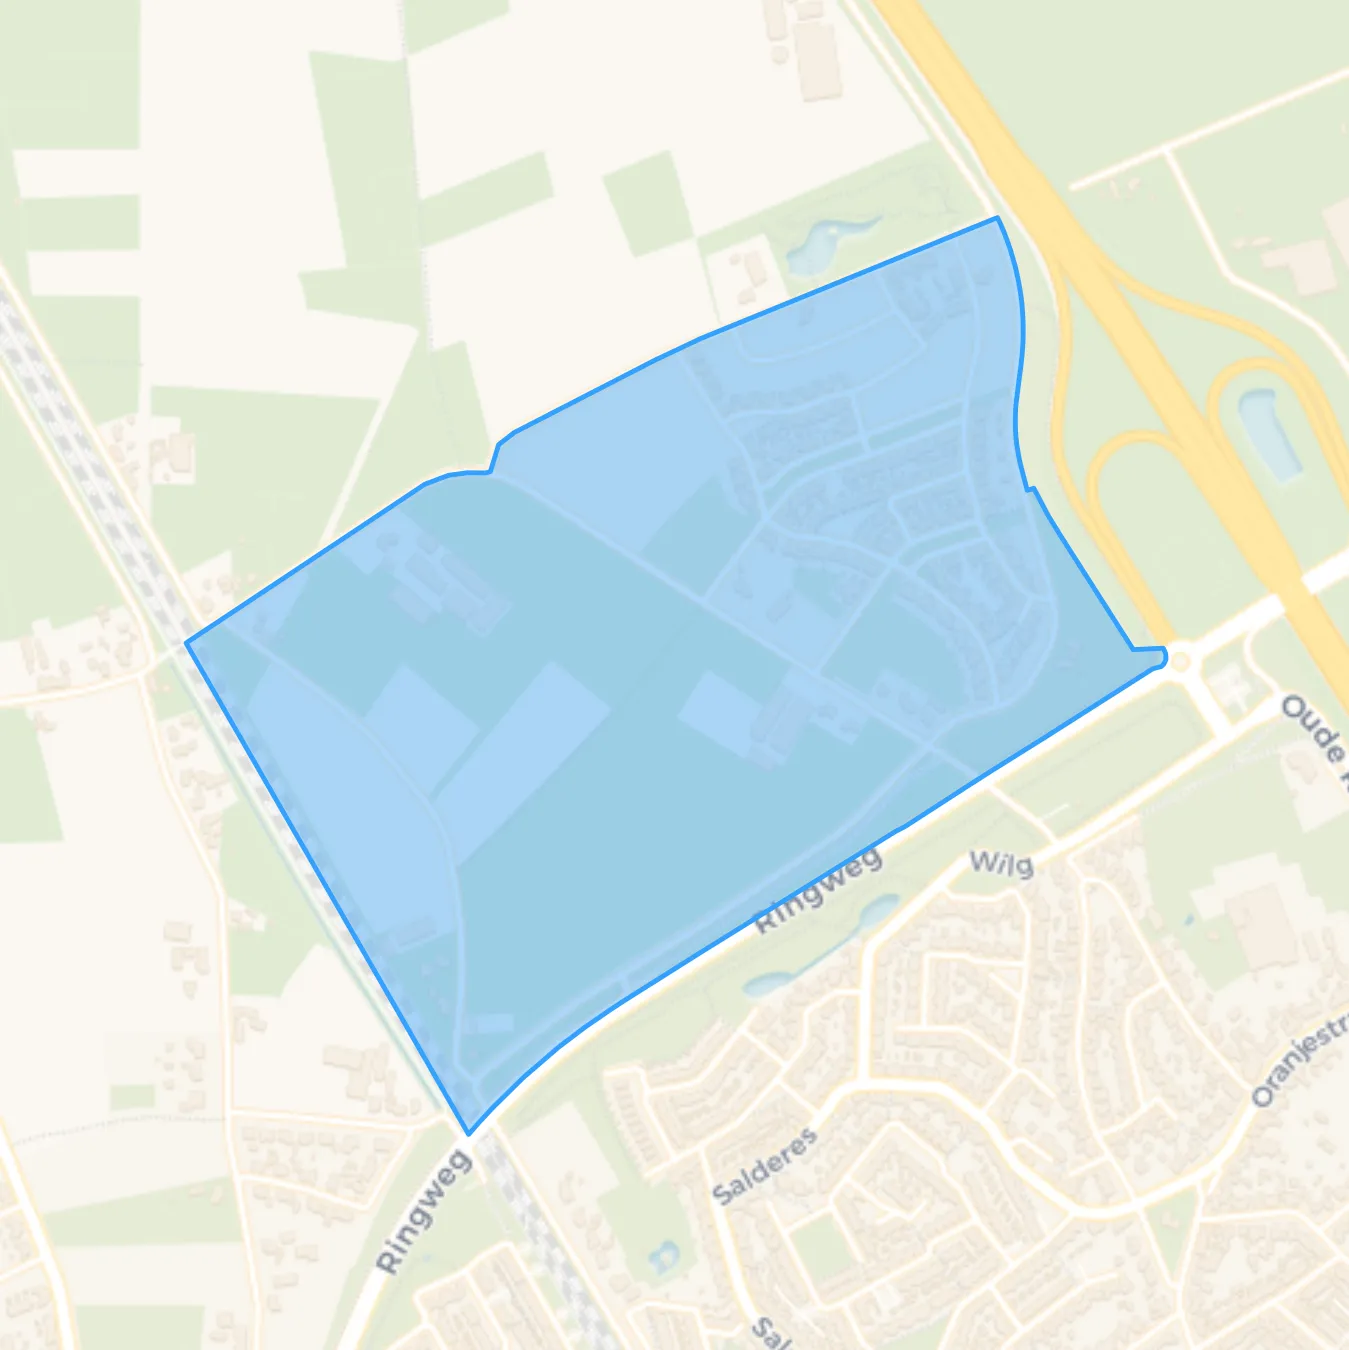
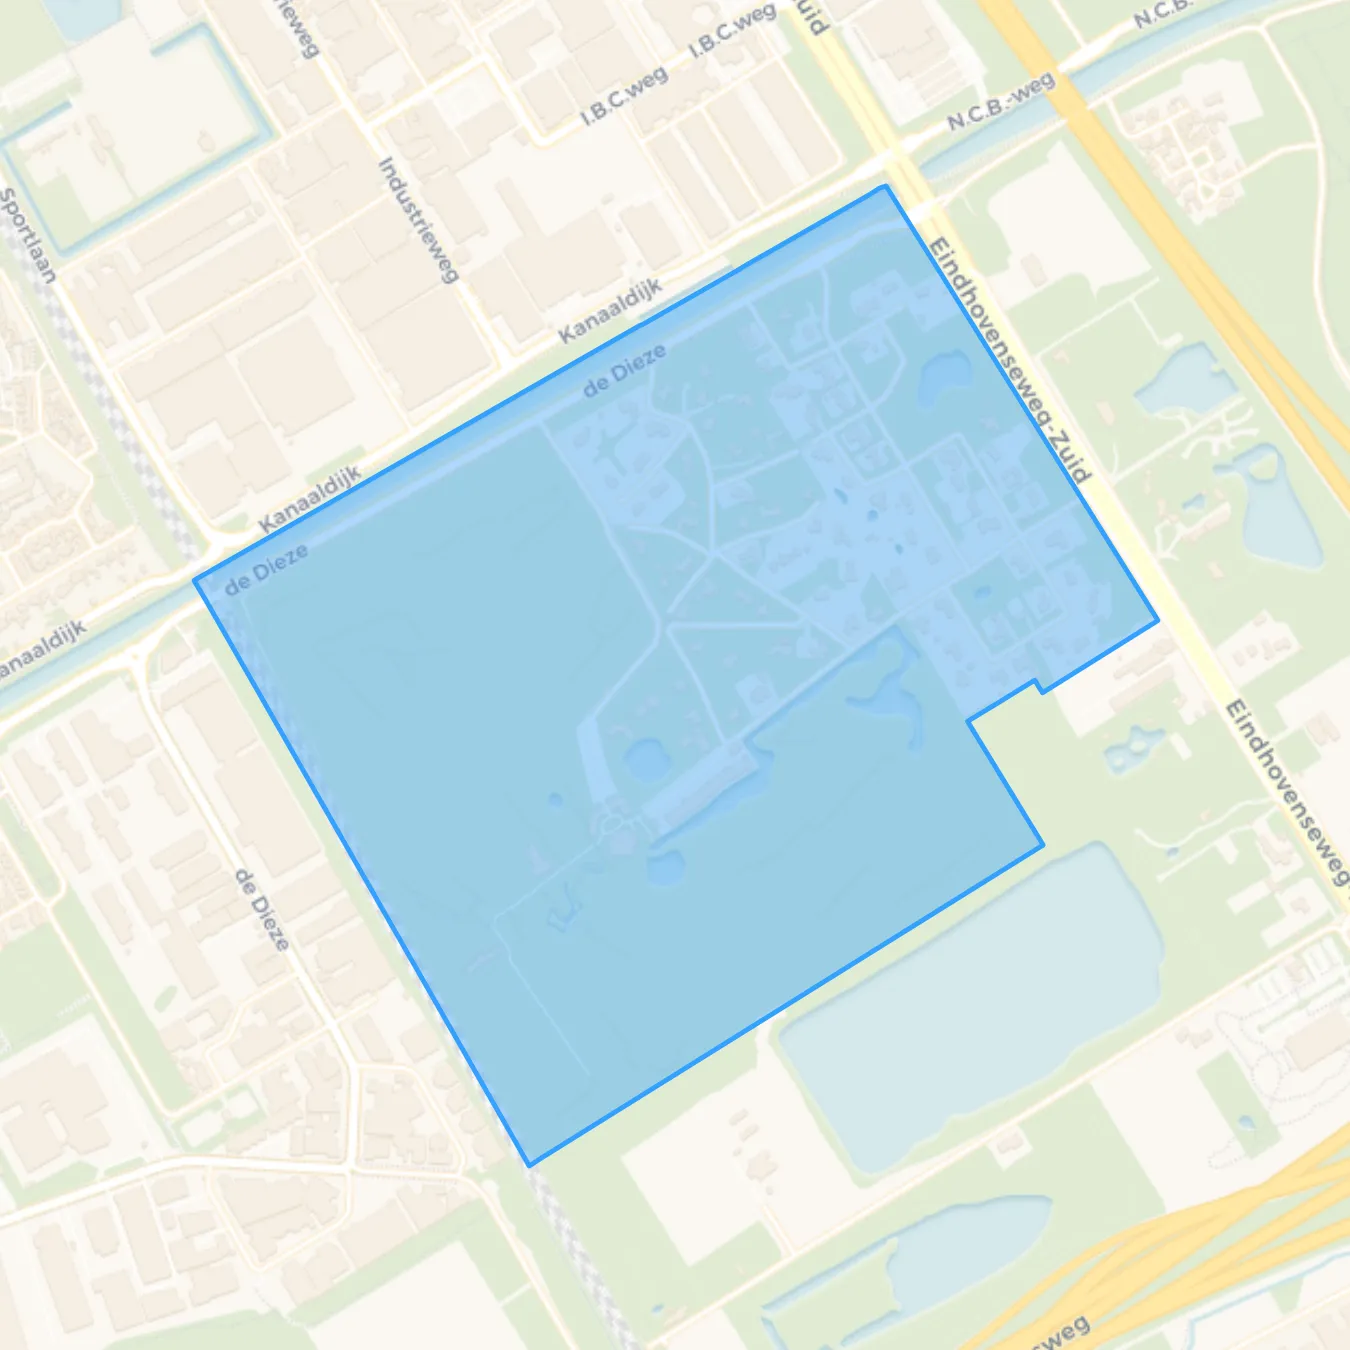
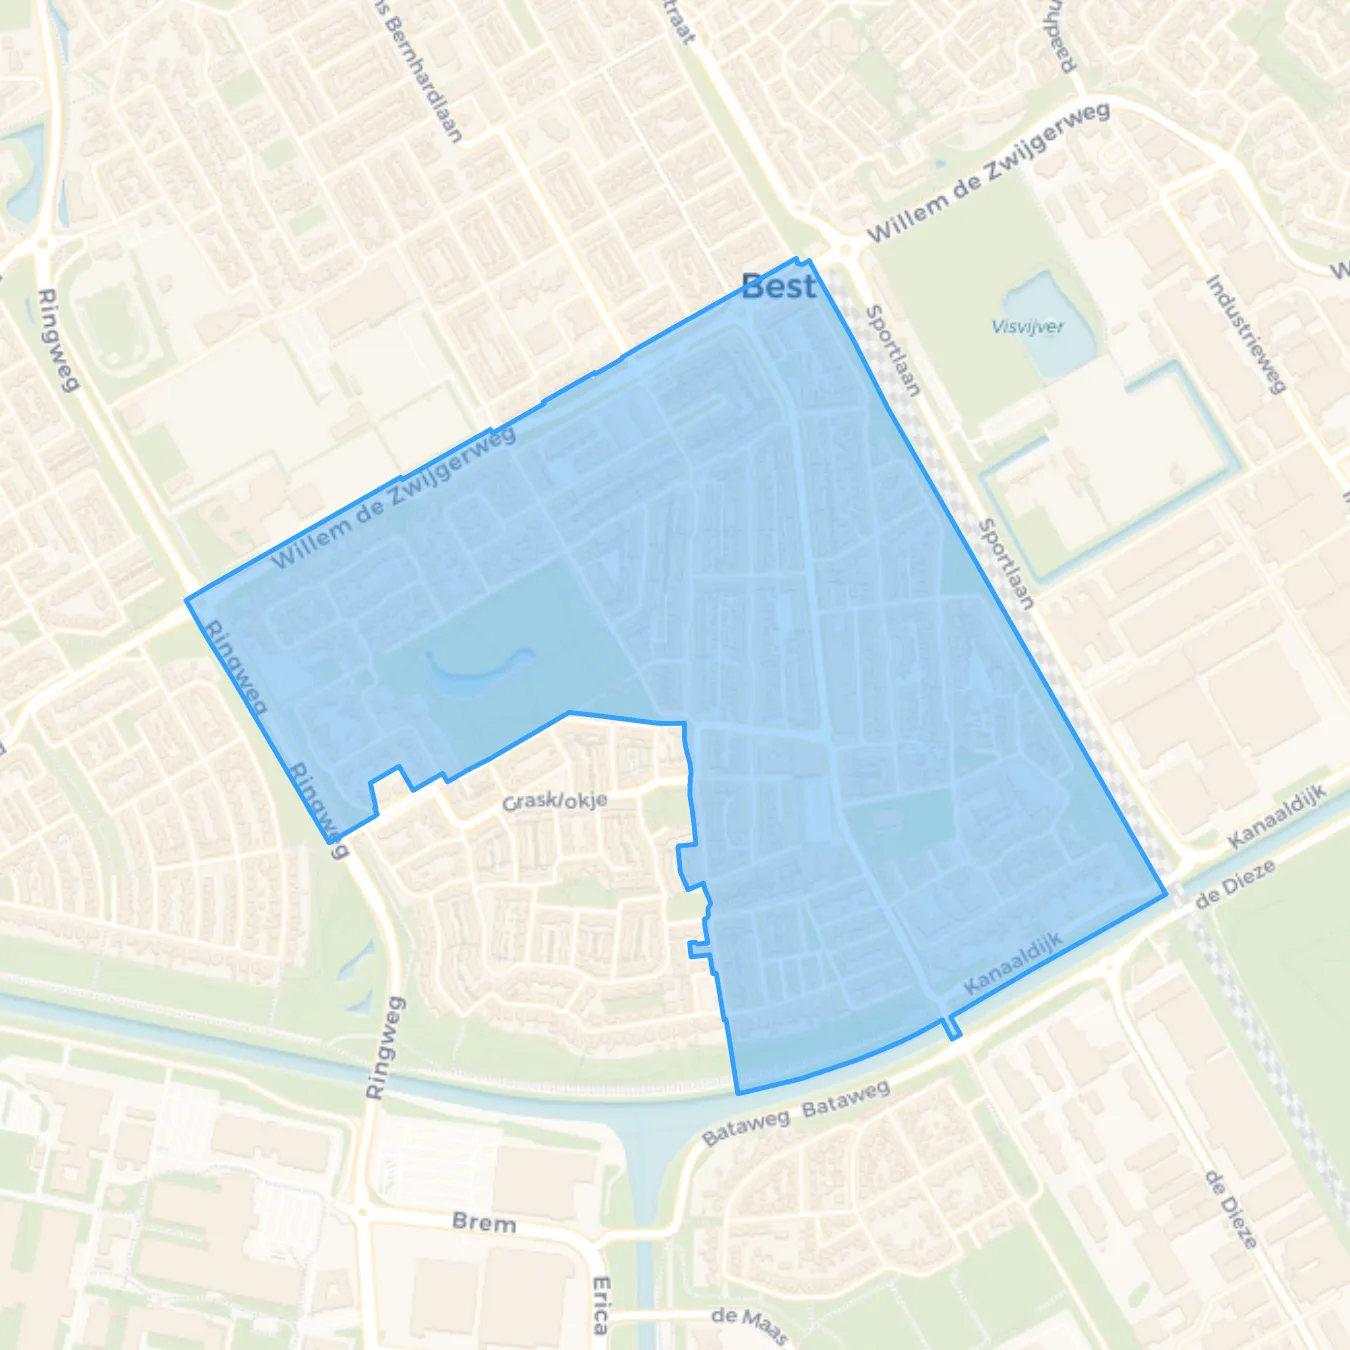
Many foreign people live in this neighbourhood. As a result, it is very diverse but not very cosy. There is not much mixing. The houses and flats are old-fashioned and the roads are very narrow.
Auto-translated to English by AIKantonnier is a quiet and tidy neighbourhood in Best with a pleasant living environment. Most amenities, such as shops, schools and sports facilities, are within short distance and easily accessible by bike or car. Accessibility via the motorway is also a big plus. The neighbourhood generally has a friendly atmosphere and is suitable for families, but also for people who like peace and quiet. Kantonnier is a cosy and close-knit neighbourhood where the community knows and helps each other. Many families live there, creating a lively and safe atmosphere. People greet each other on the street and are open to a chat. The neighbourhood feels friendly and child-friendly, making it a nice place to grow up or live quietly.
Auto-translated to English by AIIt's not busy or loud, I live in a very quiet area but sometimes it's a bit less quiet, that's normal of course. Other than that, I have nothing more to say about it, everything is fine :)
Auto-translated to English by AIGenerally a social neighbourhood. We have lived in this neighbourhood from the start and know many residents. Parking problems do arise regularly in the area because parking facilities are no longer adequate.
Auto-translated to English by AIThe neighbourhood is easily accessible by bus/train/car/bicycle. Due to construction work, the neighbourhood is becoming increasingly beautiful and people drive less fast. Occasionally there are problems with crime.
Auto-translated to English by AIIt's a pleasant and tidy neighbourhood. I would have liked a bit more of a sense of community, and the same goes for entertainment options. On the other hand, I feel very safe and it's nice and quiet, close to nature, but also to the station and the motorway.
Auto-translated to English by AIThe street in front of my house is busy on some days. And otherwise quiet, and on Sundays you can hear the church bells ringing and the cheaper fair.
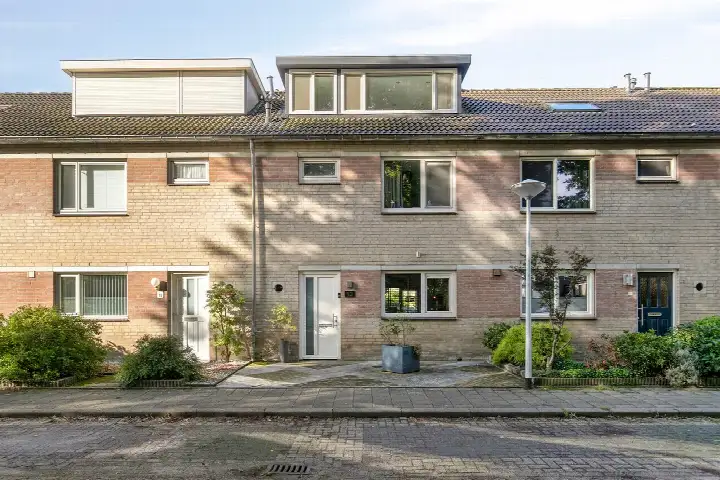
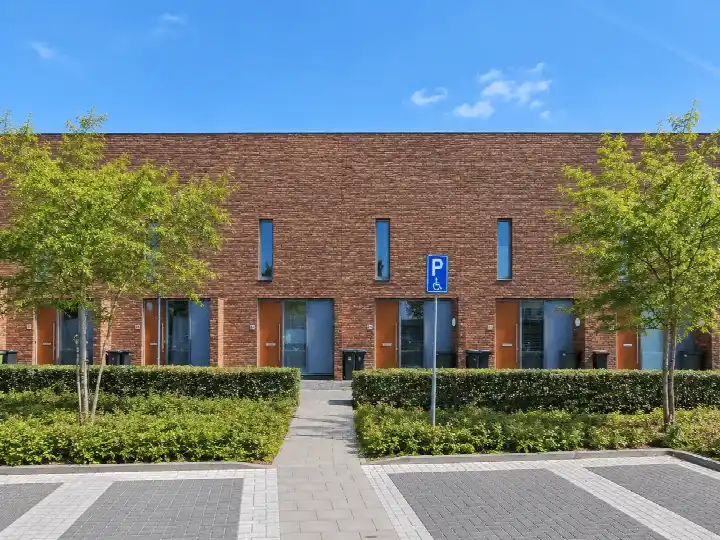
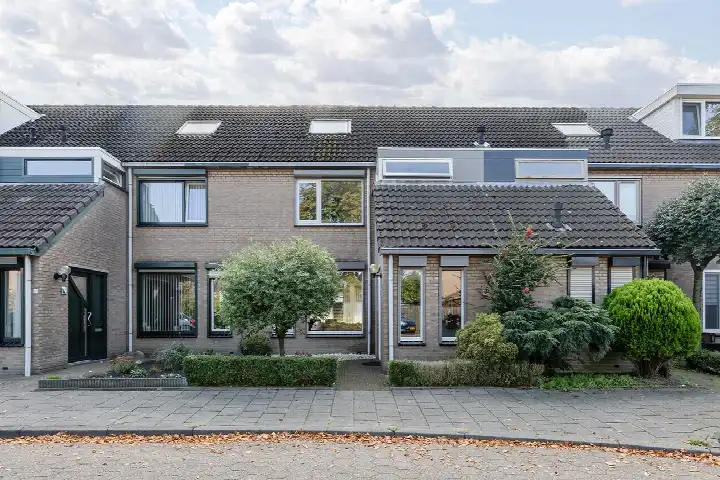
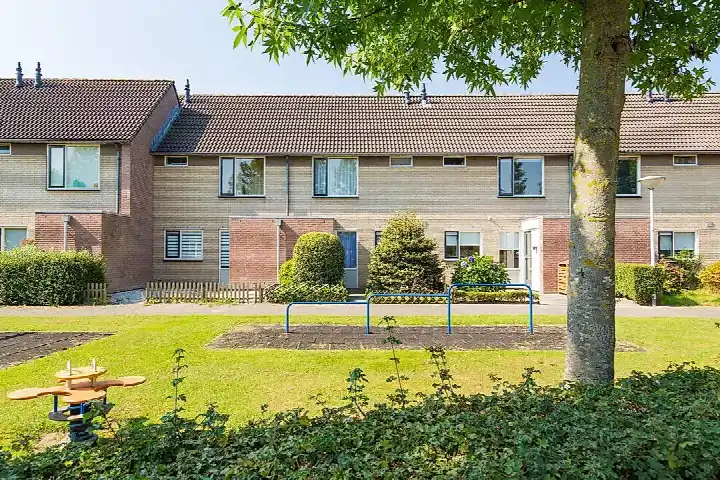
Auto-translated to English by AIThe housing stock is mainly post-war — 50% was built between 1945 and 1990.
Over the past year a home for sale in Best was listed for an average of €571,933 (€4,097 per m²).
A rental home in Best cost an average of €1,621 per month (€17 per m²). That is 25% below the national average.
Residents give Best a 7.7 out of 10 based on 7 reviews. Especially amenities (9.0) scores well; community (6.4) receives the lowest rating.
Gemeente Best has 31,652 residents. Many families: 36% of the households have children.
The housing supply in Best is remarkably efficient: 68% has an A, A+ or B label. The average natural gas consumption per household is 860 m³ per year.
From Best you can on average reach a supermarket at 0.8 km, a GP at 1.0 km, a railway station at 1.6 km, a primary school at 0.7 km (as the crow flies, source: CBS).
Right now you will find 180 homes for sale and 20 homes for rent in Best.