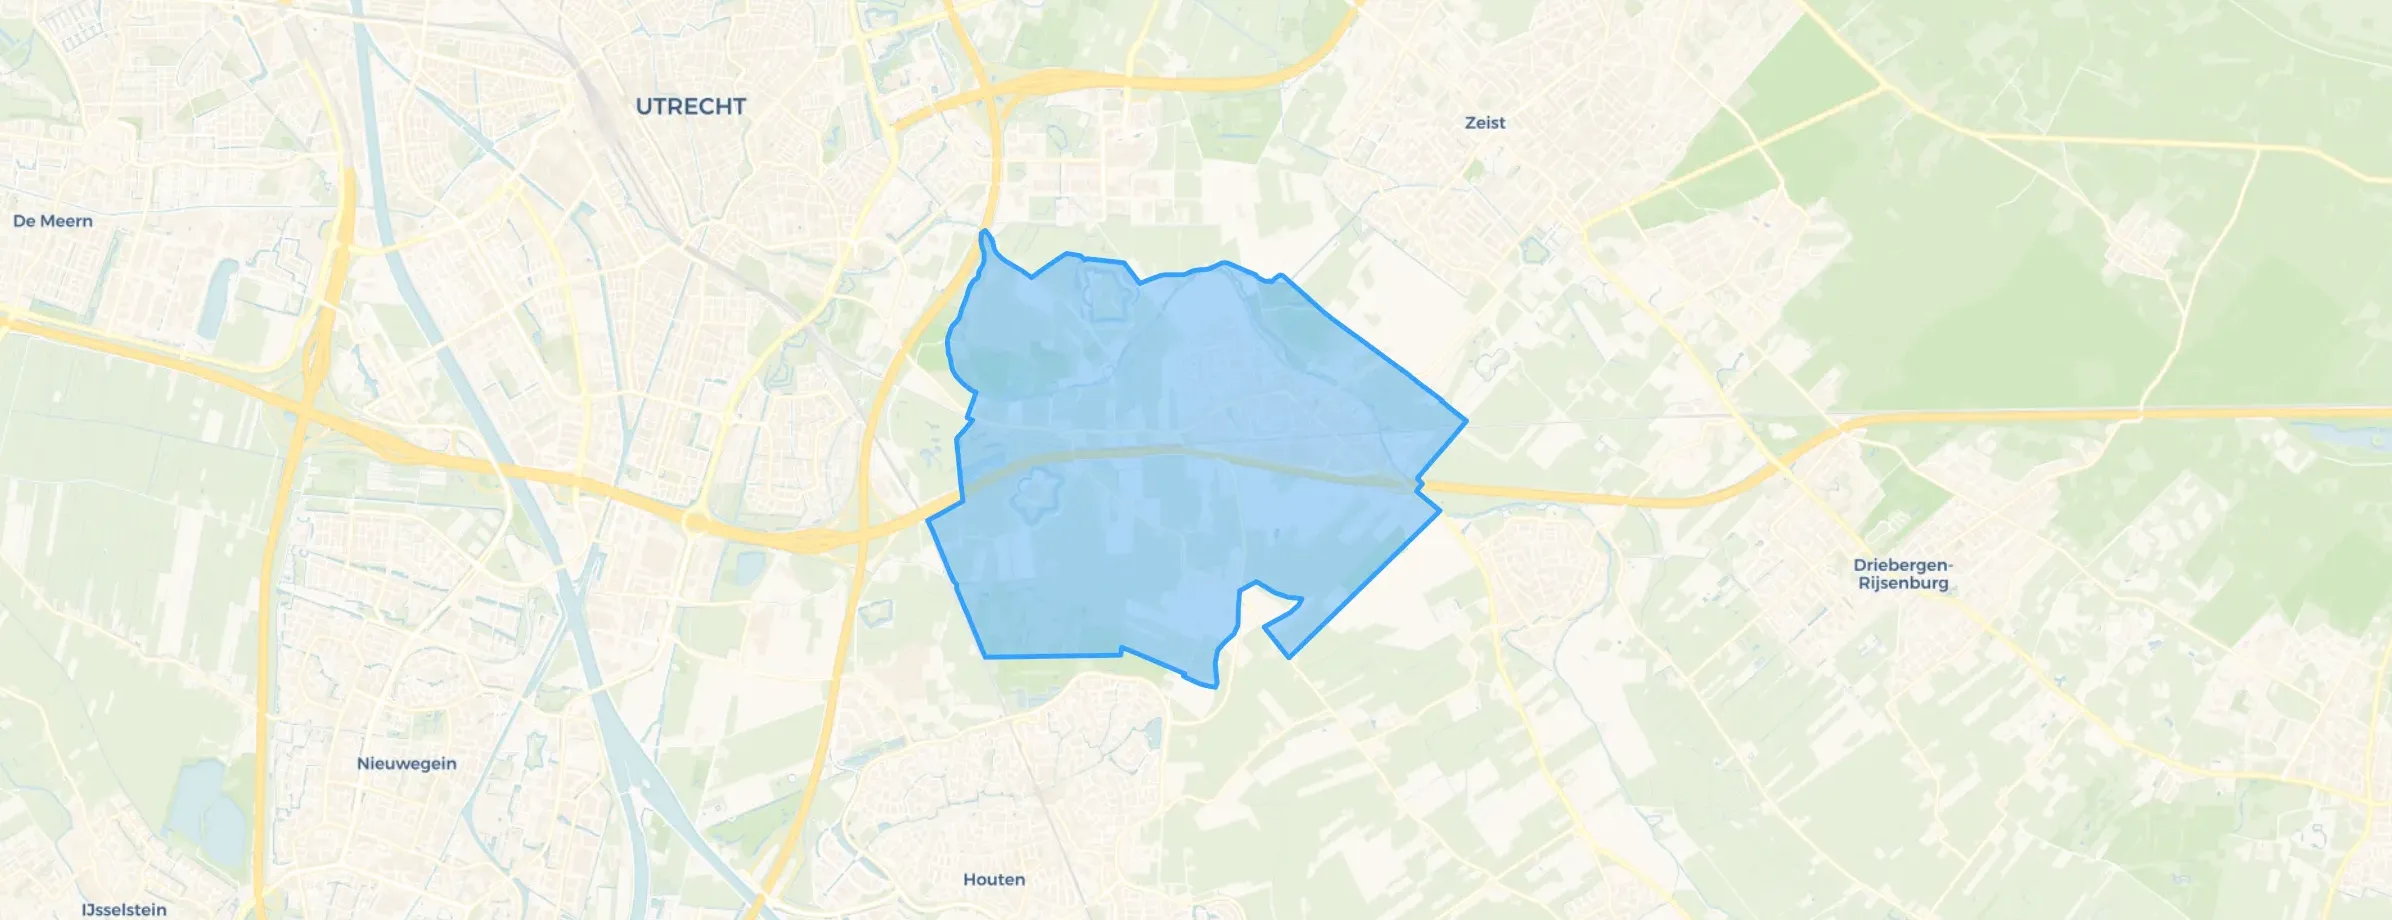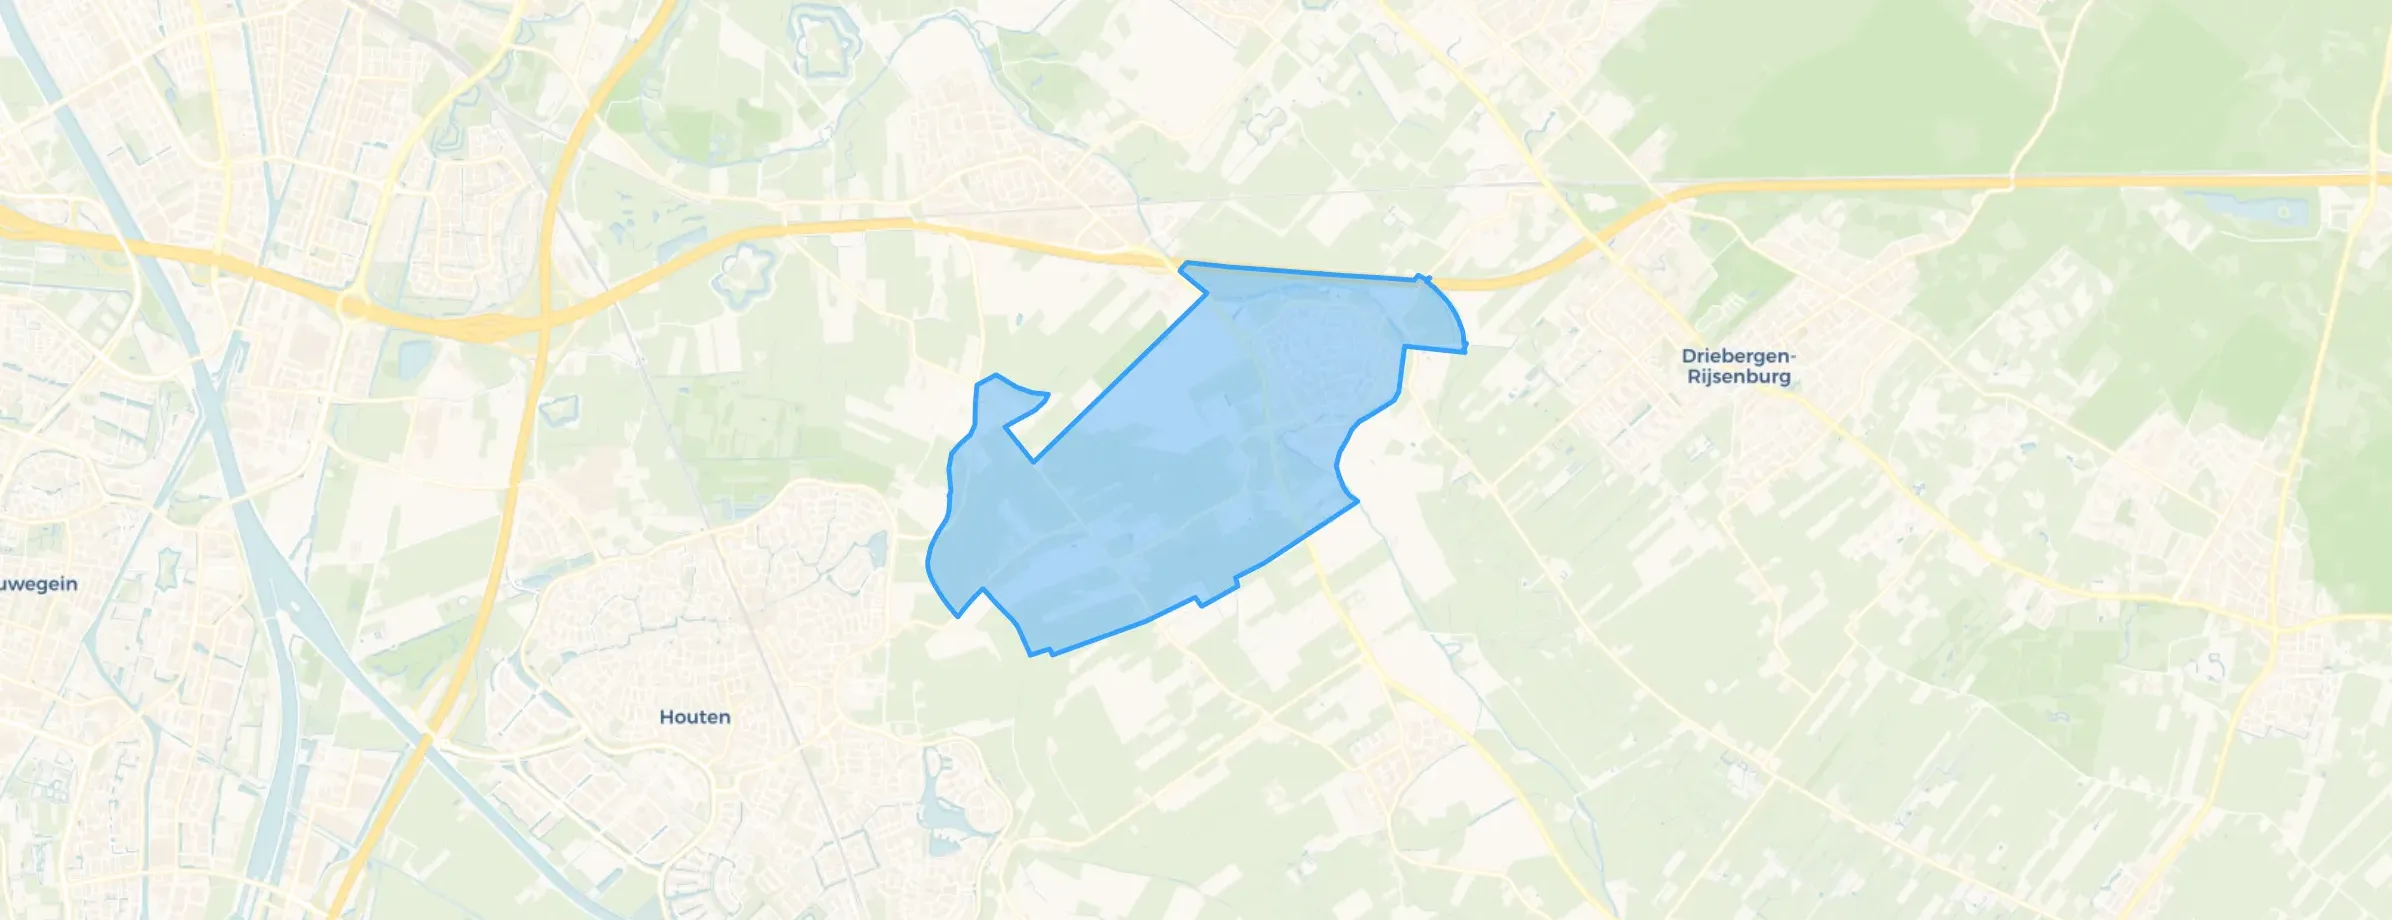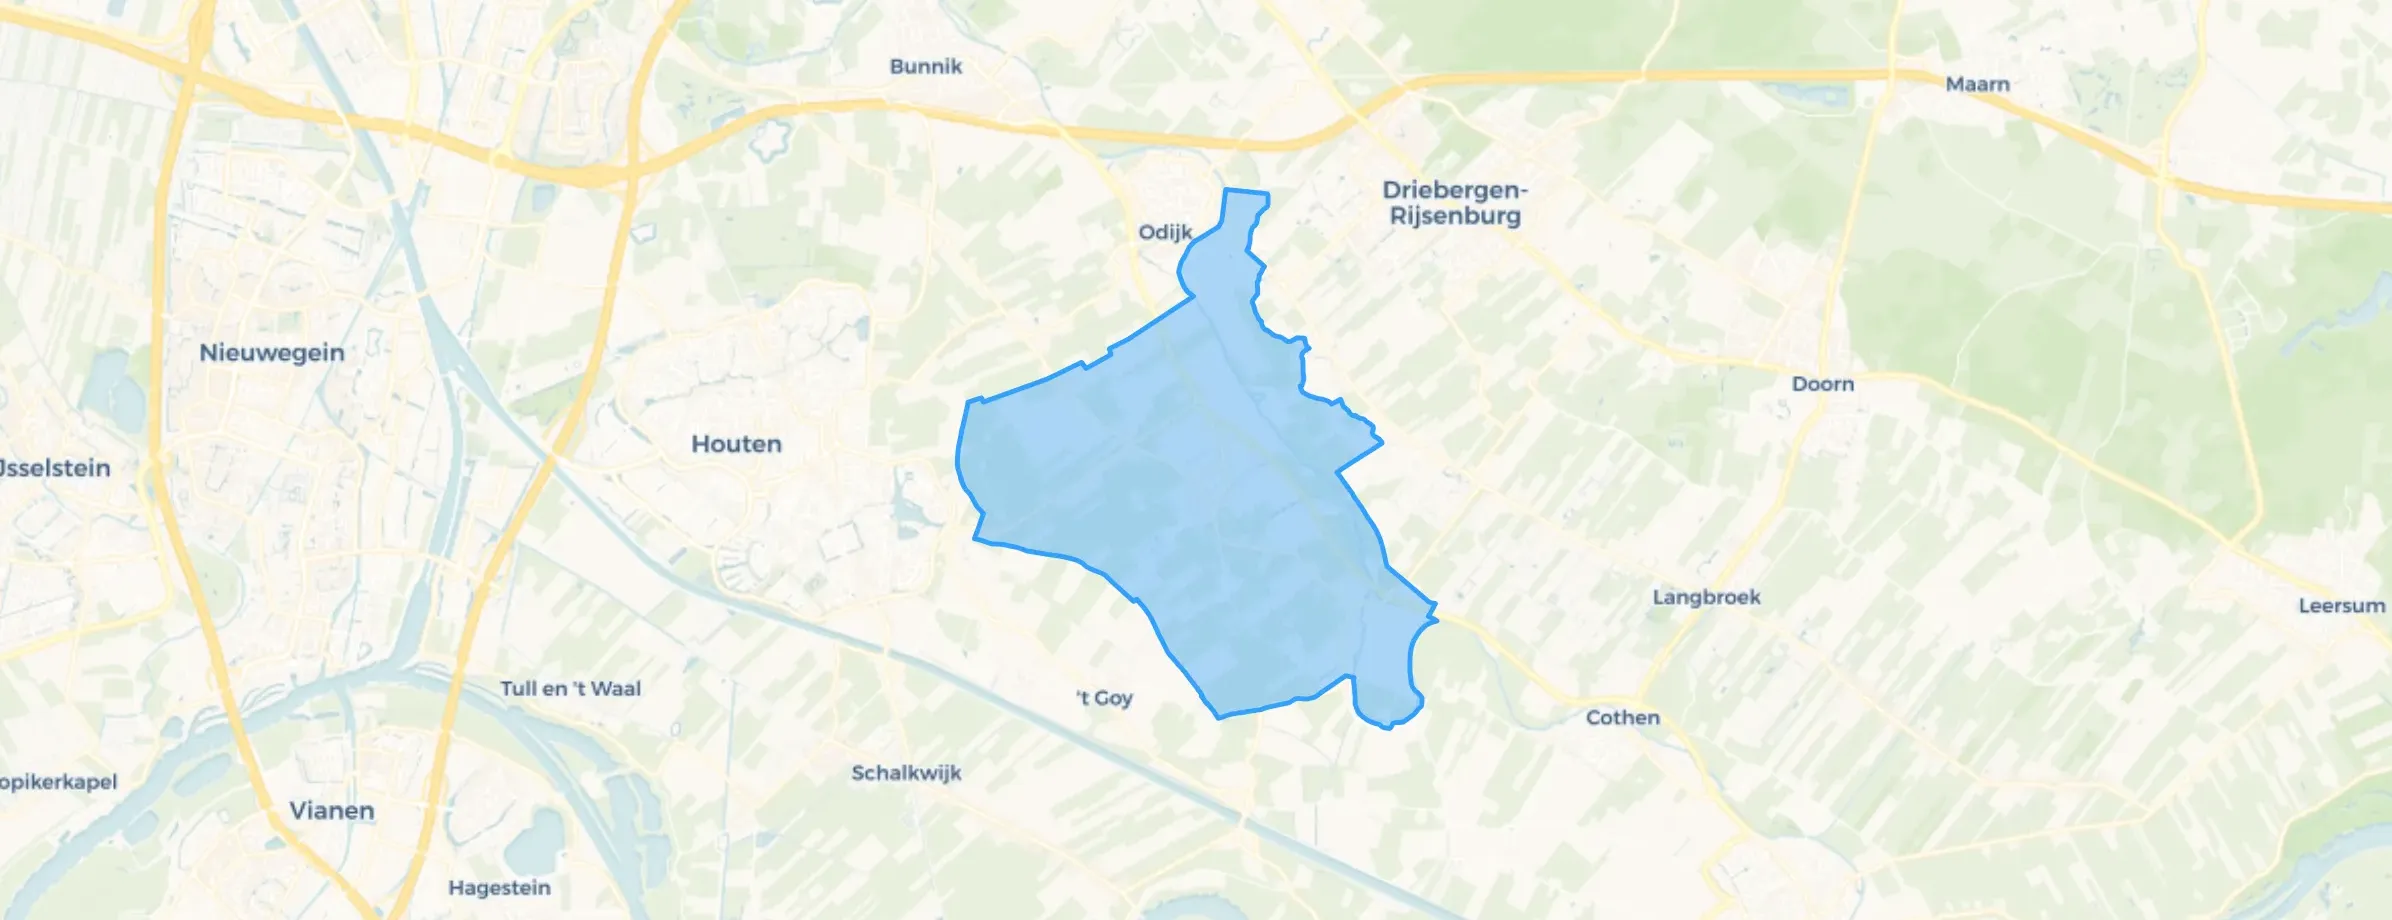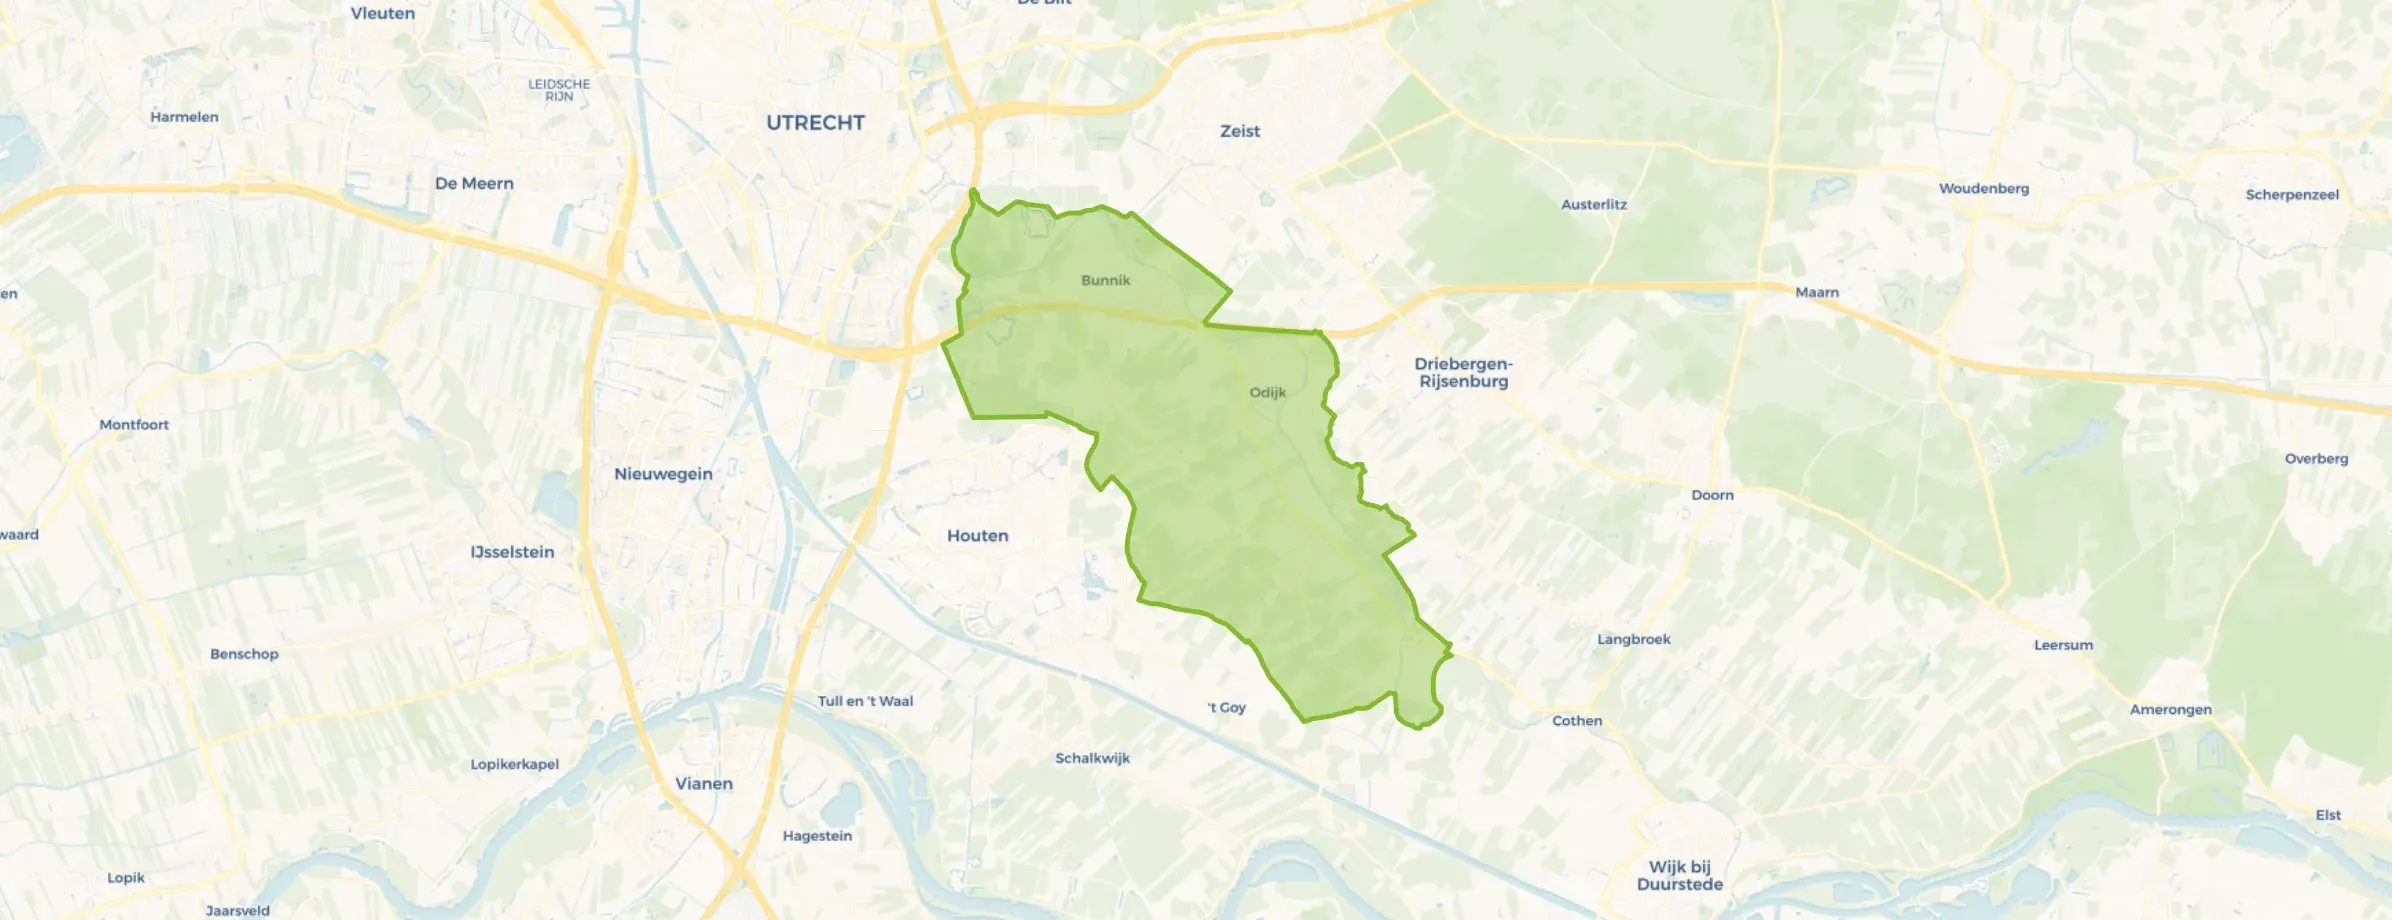
Municipality in Utrecht
Bunnik is located in the province of Utrecht The municipality has a total area of 3.757 hectares, of which 3.693 hectares are land and 64 hectares are water. The municipality is coded as GM0312. The postcode area is 3981AA-3985SX.
Bunnik has 16.108 residents. Of these, 49,4% are men and 50,6% are women. Most residents are 45 to 65 years (27,7%). The other age groups are 22,6% for '65 years or older', 21,1% for '25 to 45 years', 17,9% for '0 to 15 years' and 10,7% for '15 to 25 years'. Of the residents, 47,8% is unmarried, 41,2% is married, 5,9% is divorced and 5,1% is widowed. 13.356 residents originate from the Netherlands, 1.048 come from Europe and 1.704 come from countries outside Europe.
There are 6.946 households in Bunnik. 32,9% of these are single-person households, 30,9% households without children and 36,2% households with children. The average household size is 2,3 persons.
In Bunnik there are 12.400 income recipients. The average income per income recipient is €44.400, which is €8.600 (24%) higher than the national average of €35.800. Per resident, the average income is €35.600, which is €6.400 (22%) higher than the national average of €29.200. Most residents of Bunnik are highly educated. 50,4% have a university or higher professional education (HBO/WO), 32,4% have an intermediate education (HAVO, VWO or MBO 2-4) and 17,2% have a lower education (VMBO or MBO 1).
Of the 16.108 residents, around 69% are in paid employment, which amounts to 11.115 people. This is 4% higher than the national average of 65%. The majority of workers are in salaried employment (81%), while 19% are self-employed. In Bunnik, 25% of residents receive a benefit. The largest group is those receiving a state pension (AOW). 3.240 people receive this benefit.
In Bunnik there are 6.764 homes with an average assessed value (WOZ) of €530.000. Of these, around 97% are occupied and 3% unoccupied. Most homes are owner-occupied. This amounts to 26% rental homes and 74% owner-occupied homes. Of the homes, 74% privately owned, 16% owned by housing associations and 10% owned by other landlords. The most common construction periods in Bunnik are 1950-1970 (28%) and 1970-1980 (19%).
There are currently no homes for sale in Bunnik. The most recently listed home is Prinses Beatrixstraat 3 by Halbertsma van den Boom op Funda. No homes were sold in Bunnik over the past year.
There are currently no homes for rent in Bunnik. The most recent home is Dorpsstraat 40G, offered by Rotsvast. No homes were let in Bunnik over the past year.
No recent rental data available for Bunnik.
In Bunnik there are 6.997 addresses with a registered energy label. The most common labels are C (33%), A (20%) and B (12%). On average, an address in Bunnik uses 2.830 kWh of electricity per year. This is 1% above the national average of 2.810 kWh. With an annual consumption of 1.160 m³ per address, natural gas consumption is 9% below the national average of 1.280 m³.
Very many young families with children aged 0-12. No crime, no loitering youths. No noise nuisance. 2 years ago the sewer was replaced and the streets were redesigned with lots of greenery. Several large playgrounds in the neighbourhood. Daycare. Station 3 minutes' walk (8 minutes to Utrecht Central). Bus station 400 m away towards Utrecht and towards Wijk bij Duurstede. 10 minutes' cycling to Science Park Utrecht, 15 minutes to Galgenwaard and 25 minutes to Utrecht city centre. 10 minutes to Rhijnauwen Woods, 12 minutes to Zeist centre. Walking along the Kromme Rijn (river that runs from Wijk bij Duurstede to Utrecht) 500 metres away. Shopping centre 500 metres away.
Auto-translated to English by AIToo little is being built and when something becomes available, it's not for those who have been registered for years. Clean and safe???? Pavements uneven, tiles loose or missing... weeds growing rampant. Shrubs pruned too late or not at all or forgotten, creating unsafe spots e.g. when crossing or wanting to drive onto the road. 1 supermarket, too expensive, yes the previous owner arranged that a second one cannot/may not come to Bunnik while Odijk has 2. etc etc I could list and write more things.
Auto-translated to English by AII used to play outside here often and it is very beautifully green
Auto-translated to English by AIIt's a cosy and safe neighbourhood but the people are narrow-minded
Auto-translated to English by AINext to my house you are literally run off the pavement by cars trying to pass each other. Adding a few bollards would be a solution. Even when I walk with my walker and later with my mobility scooter, I will certainly have to be careful when leaving my exit.
Auto-translated to English by AIA lot is being built and high, now looking at apartments, soon they'll know by the end of the year what I'm cooking. There is only one supermarket, an expensive AH, so you have to go to the next village to do your shopping cheaply. A lot of rubbish lies on the street, especially napkins from the ice cream shop, wheelie bins have been on the pavement for years while they have space behind the house.
Auto-translated to English by AILive here wonderfully with lots of nature around me and a beautiful stream flows past the village. Nice shops and yet I live right in the centre... only a pity about that neighbour
Auto-translated to English by AINice neighbourhood
Auto-translated to English by AI
The housing stock is mainly post-war — 60% was built between 1945 and 1990.
Over the past year a home for sale in Bunnik was listed for an average of €626,570 (€5,038 per m²). Last quarter prices rose by 6%.
A rental home in Bunnik cost an average of €1,507 per month (€17 per m²).
Residents give Bunnik a 7.9 out of 10 based on 8 reviews. Especially nature and greenery (9.1) scores well; housing (6.3) receives the lowest rating.
Gemeente Bunnik has 16,108 residents. Many families: 36% of the households have children.
The housing supply in Bunnik is remarkably efficient: 64% has an A, A+ or B label. The average natural gas consumption per household is 1,160 m³ per year.
From Bunnik you can on average reach a supermarket at 0.7 km, a GP at 0.8 km, a railway station at 3.4 km, a primary school at 0.8 km (as the crow flies, source: CBS).
Right now you will find 41 homes for sale and 15 homes for rent in Bunnik.

Buurtje.nl uses cookies to make the site work and to improve it. In doing so, we process data such as your IP address and the pages you visit.
We use this data for three purposes: running the website (functional), measuring visits so we can improve Buurtje.nl (analytics), and — if you allow it — tailoring ads to your interests (marketing).
How we handle your data is described in our privacy policy. You can change your preferences at any time via 'Cookie preferences' at the bottom of every page.
Choose per category which cookies we may place. Read more in our privacy policy.