Municipality in Zuid-Holland
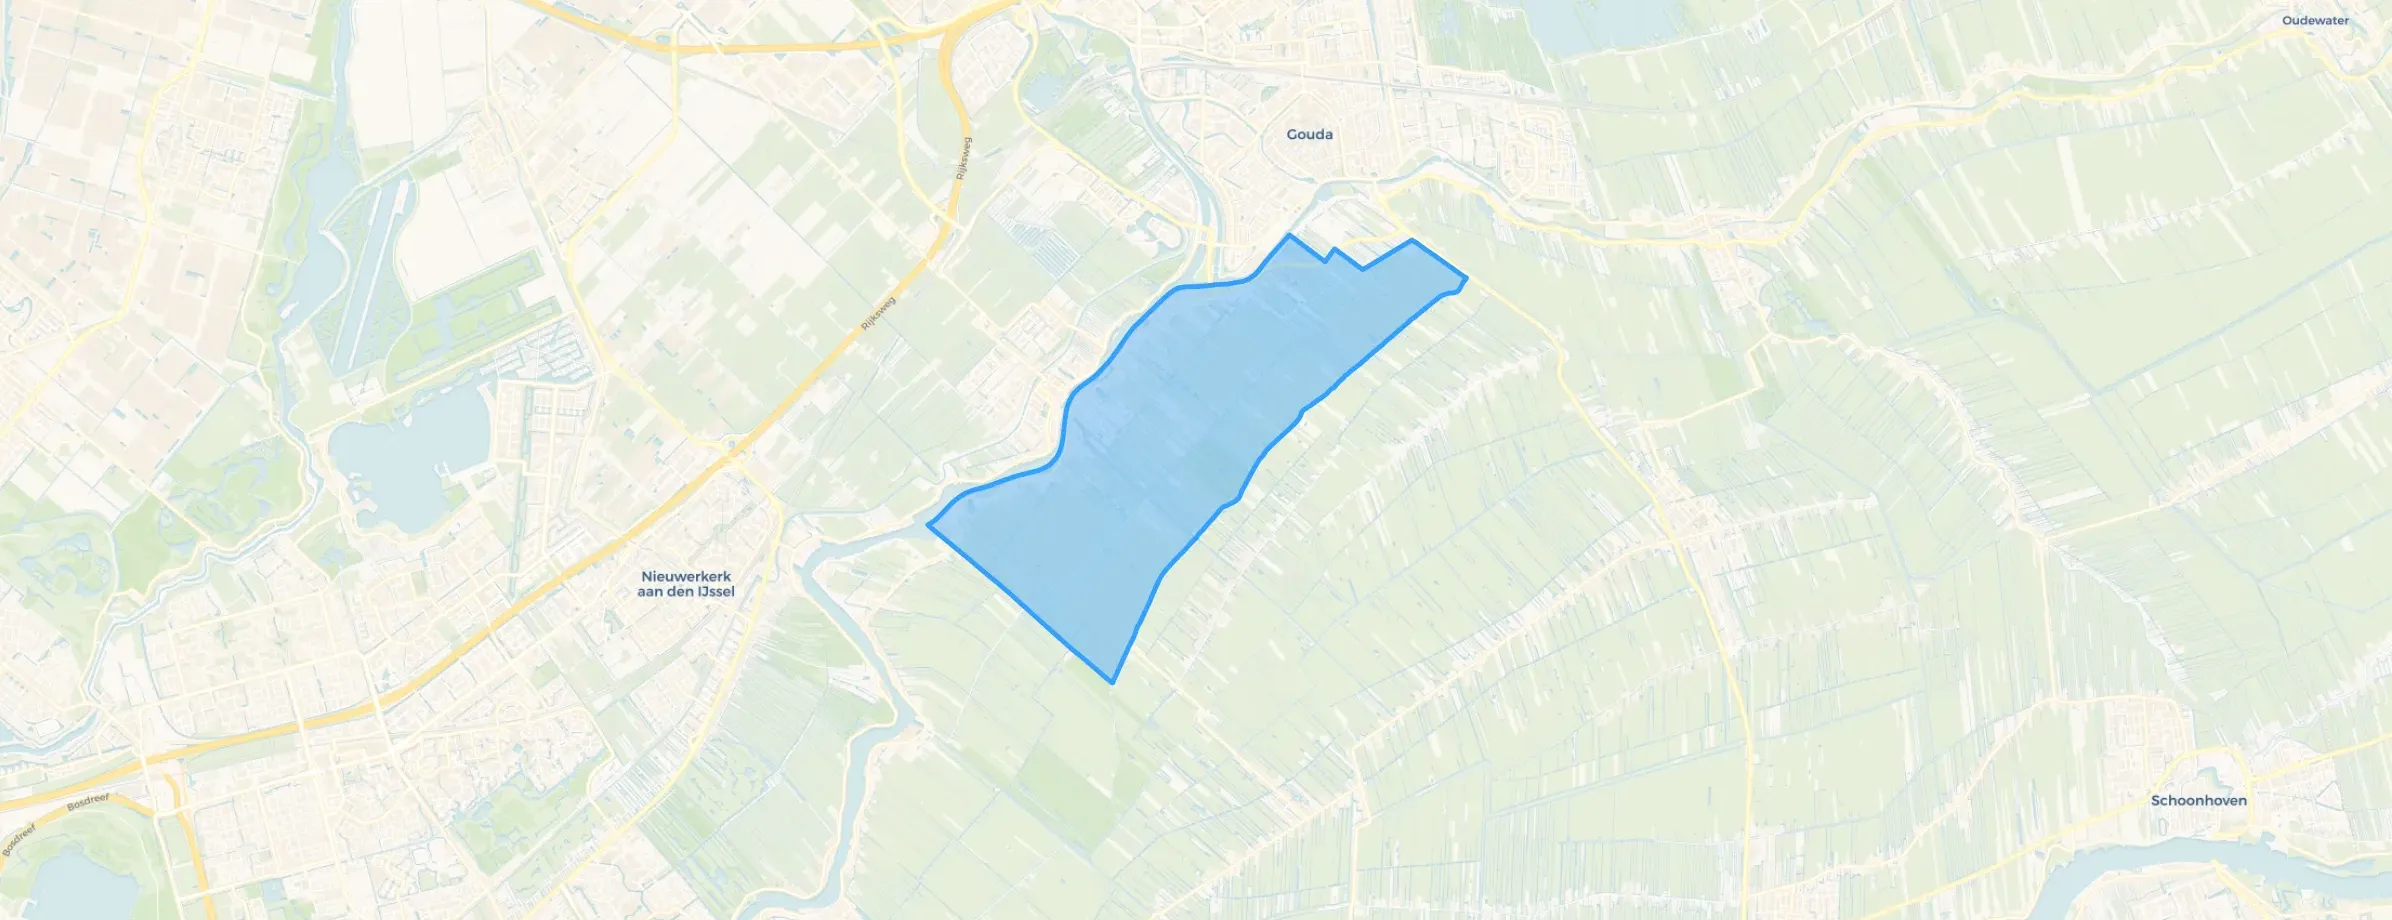
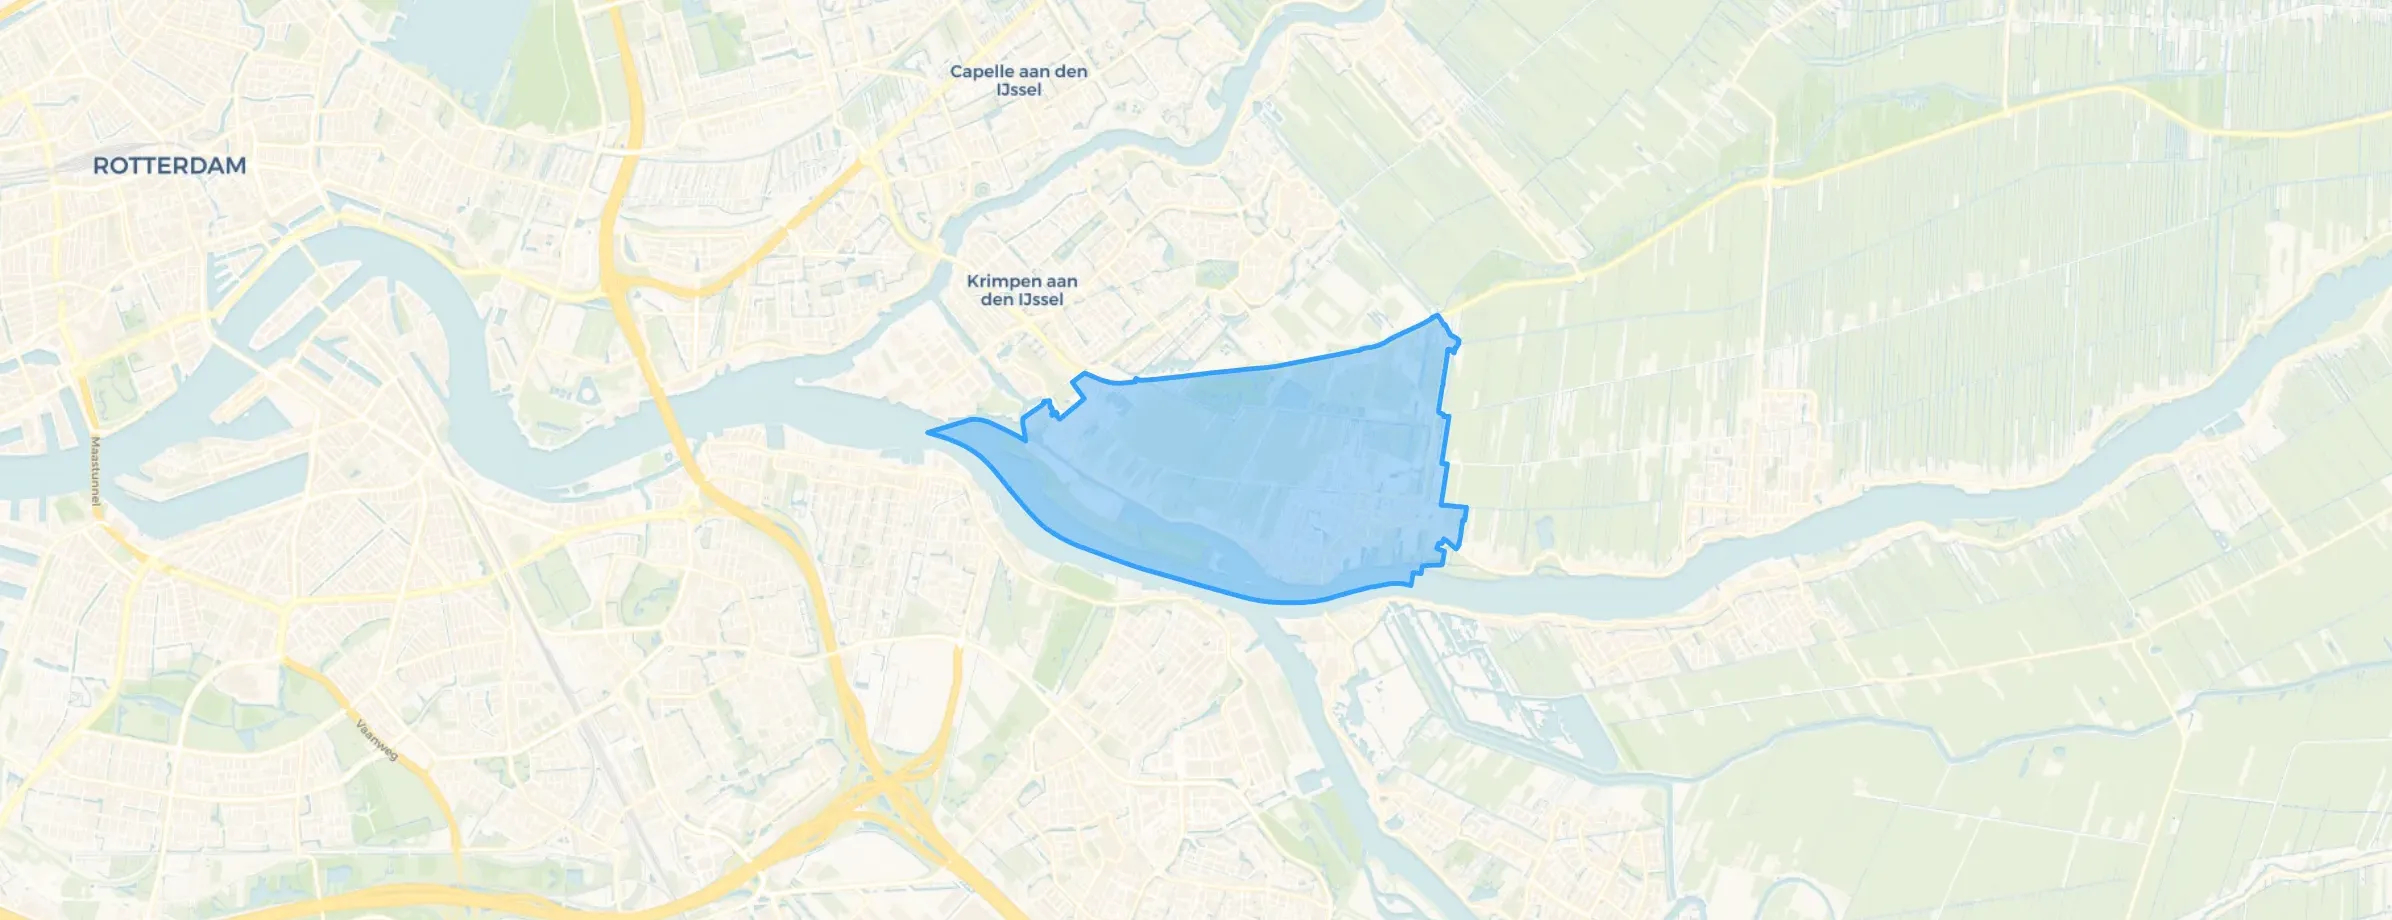
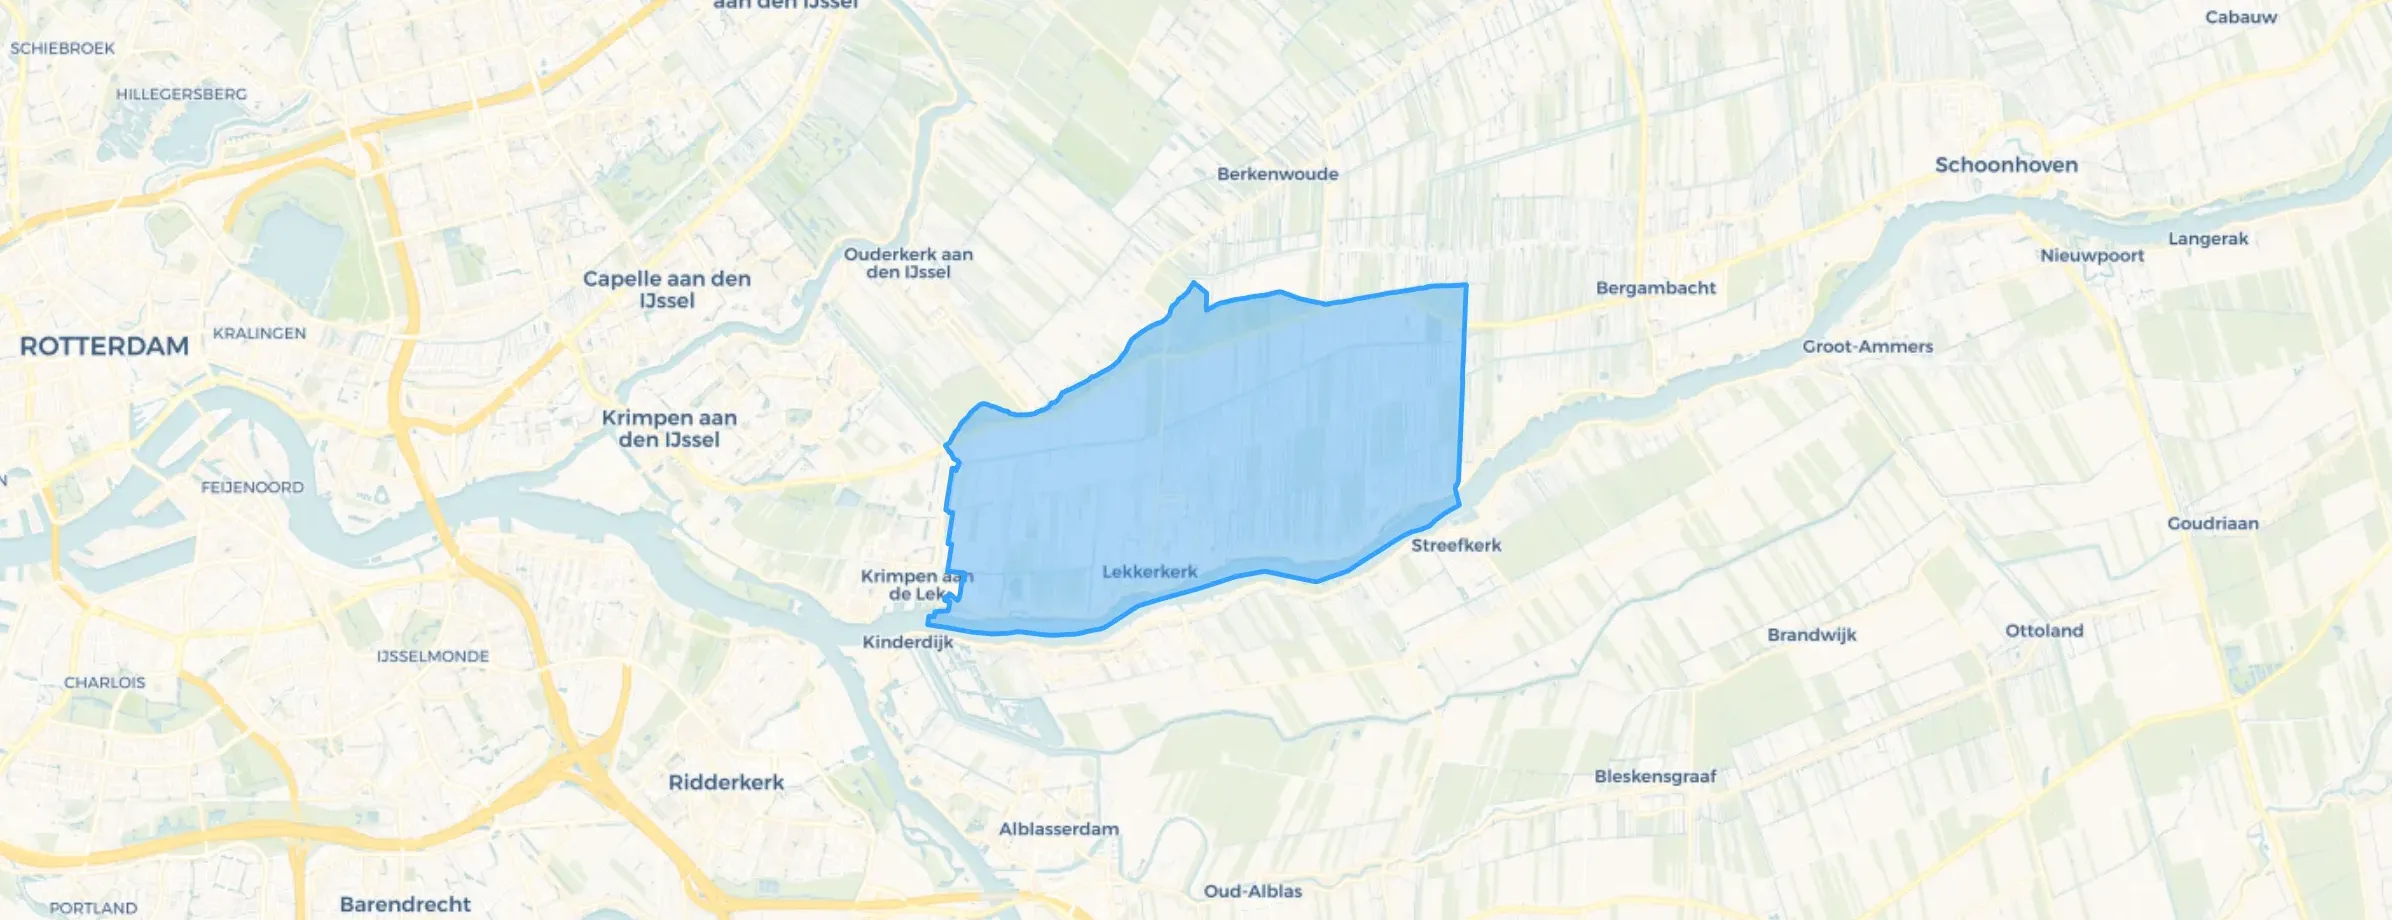
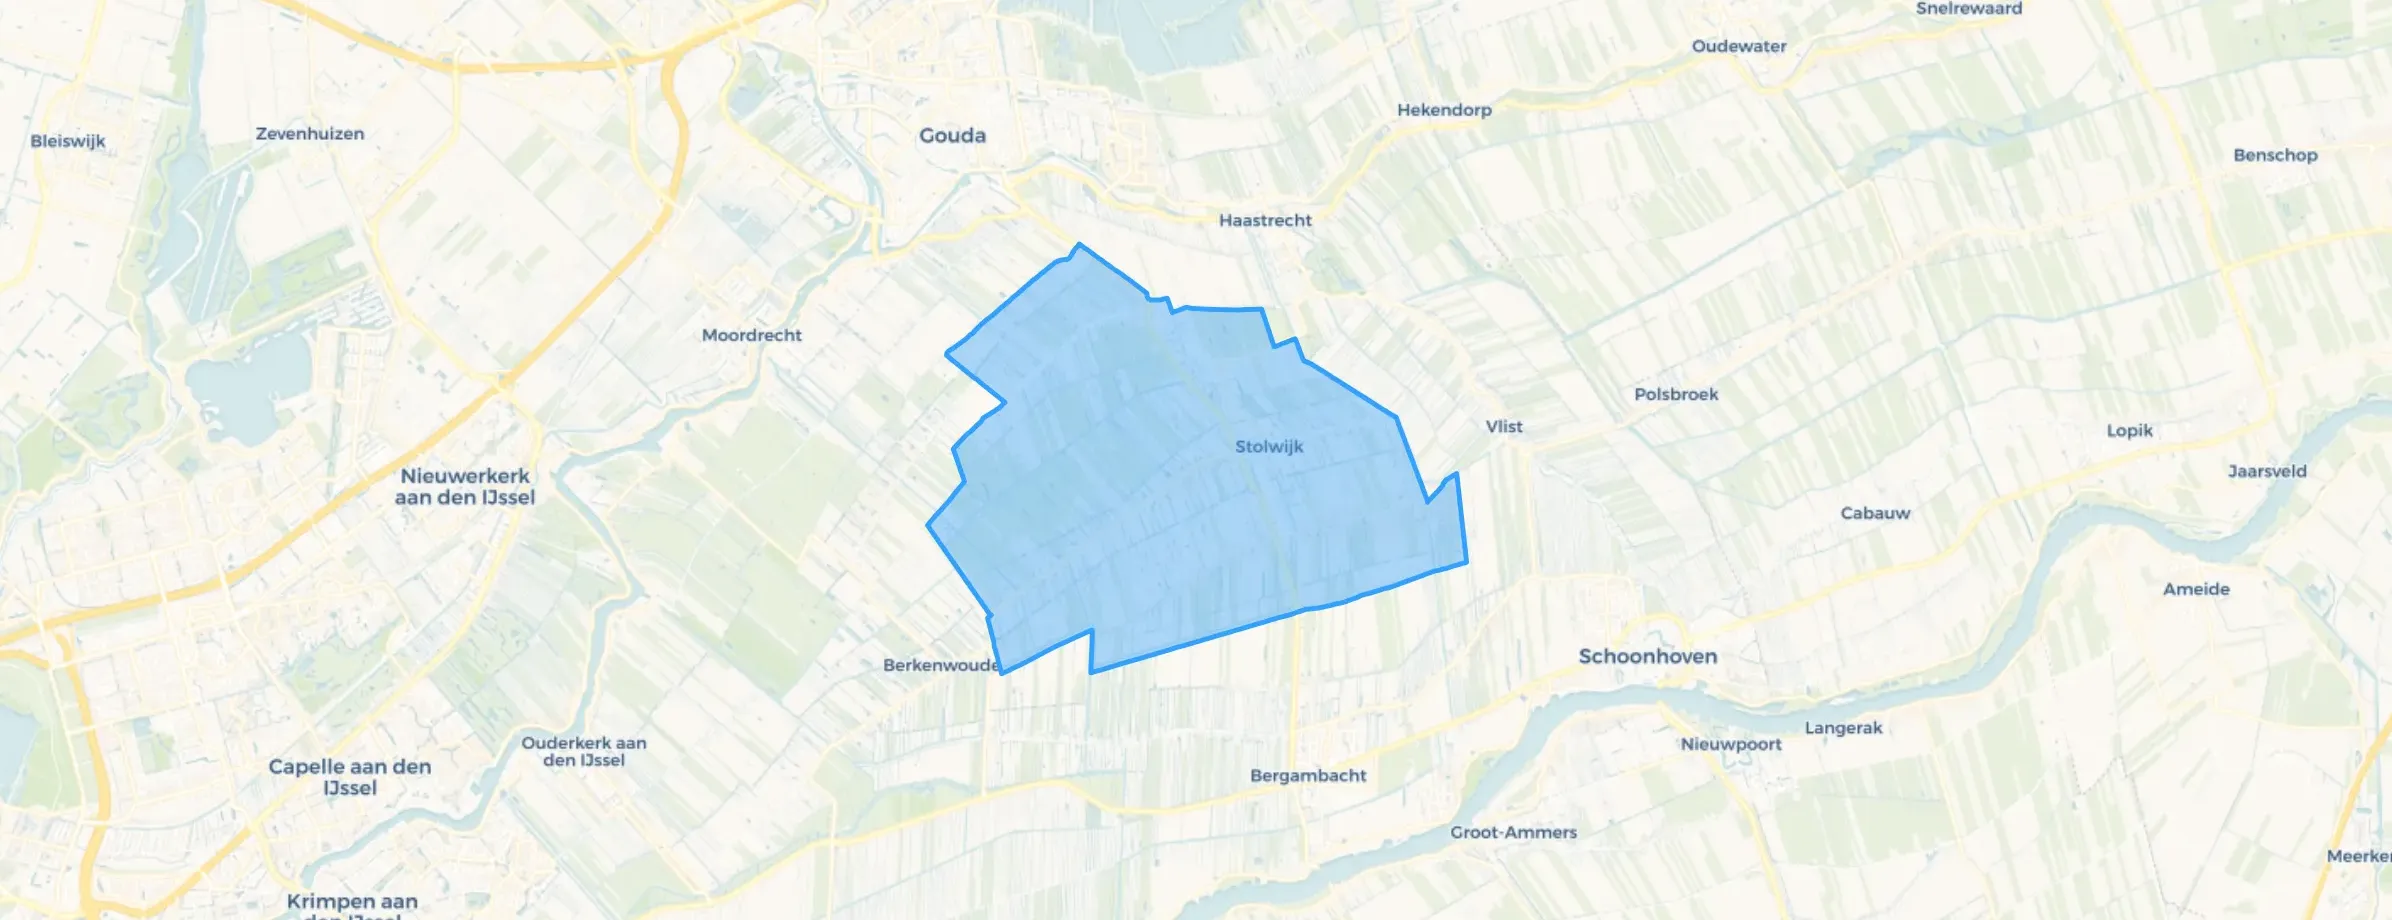
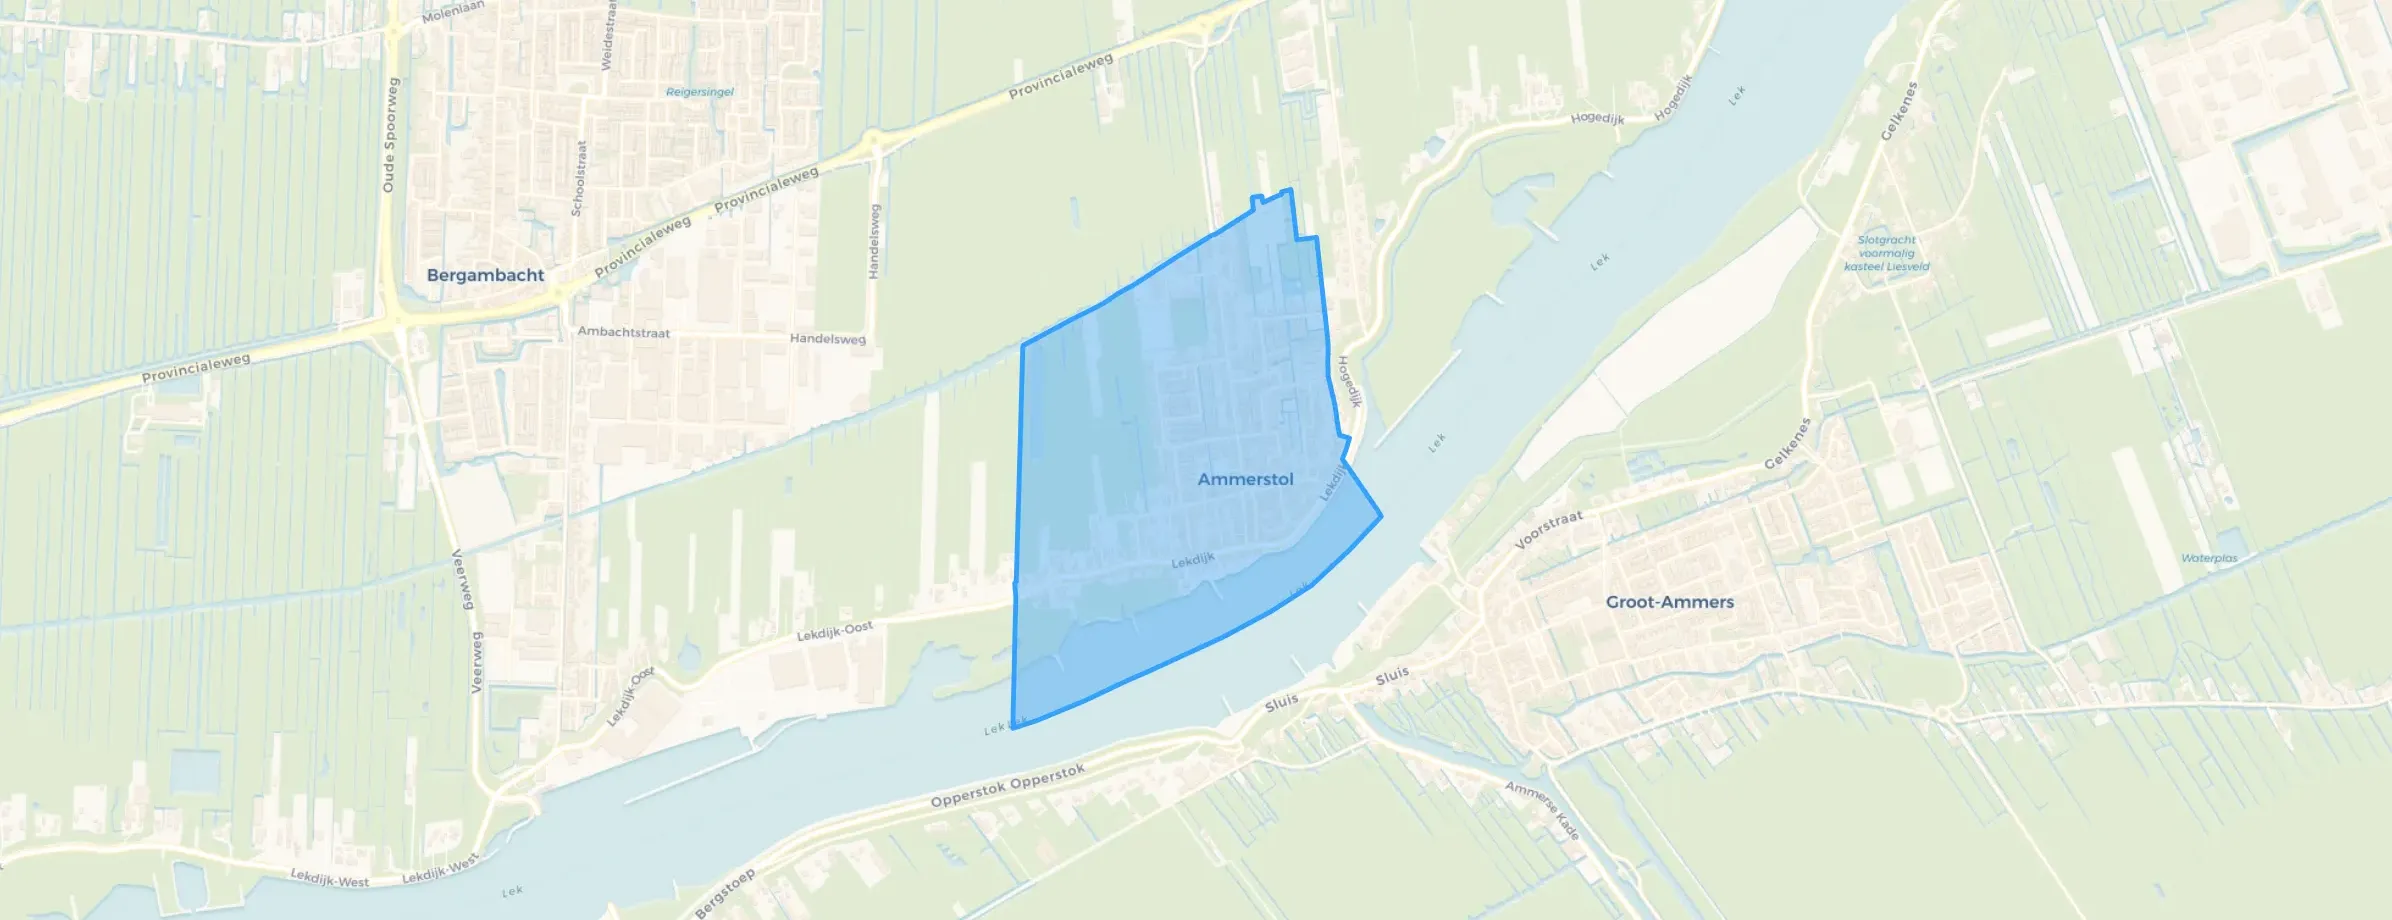
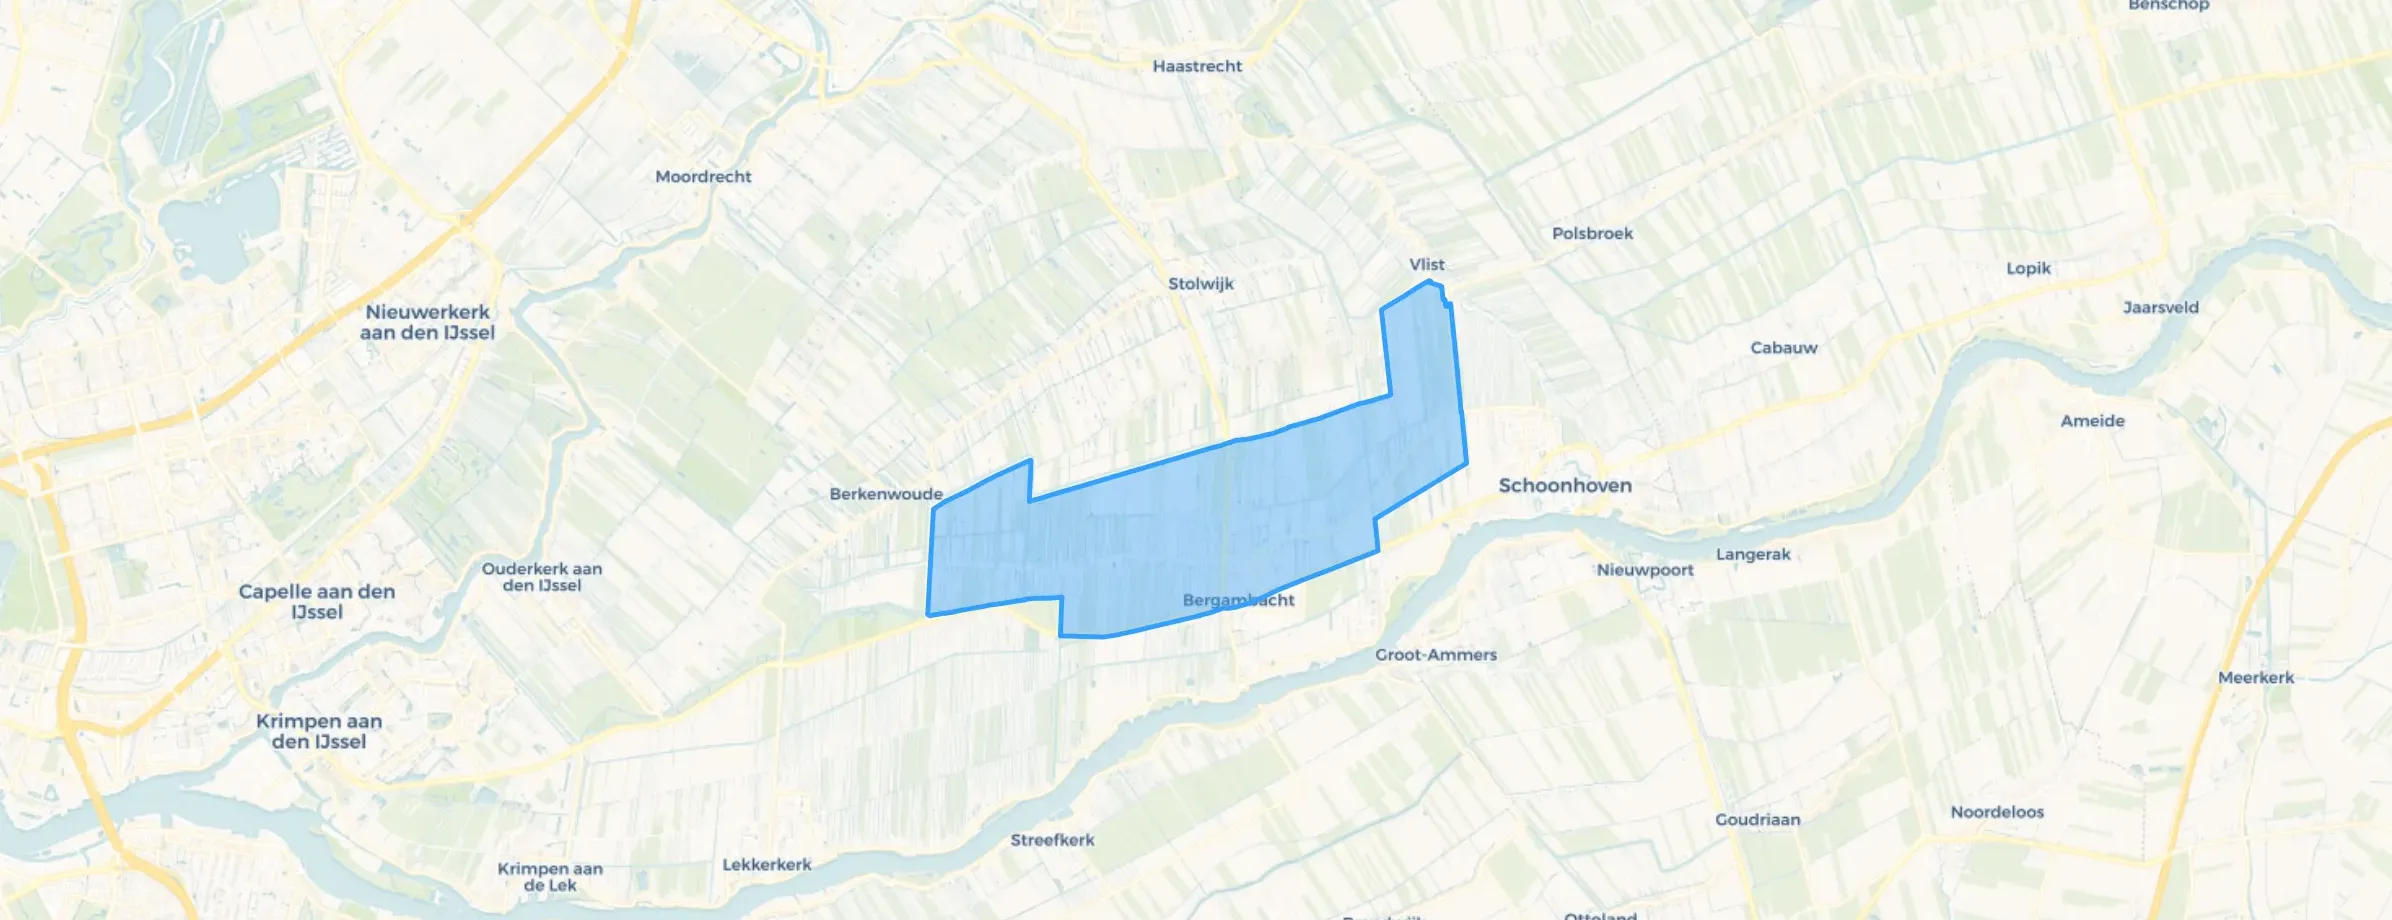
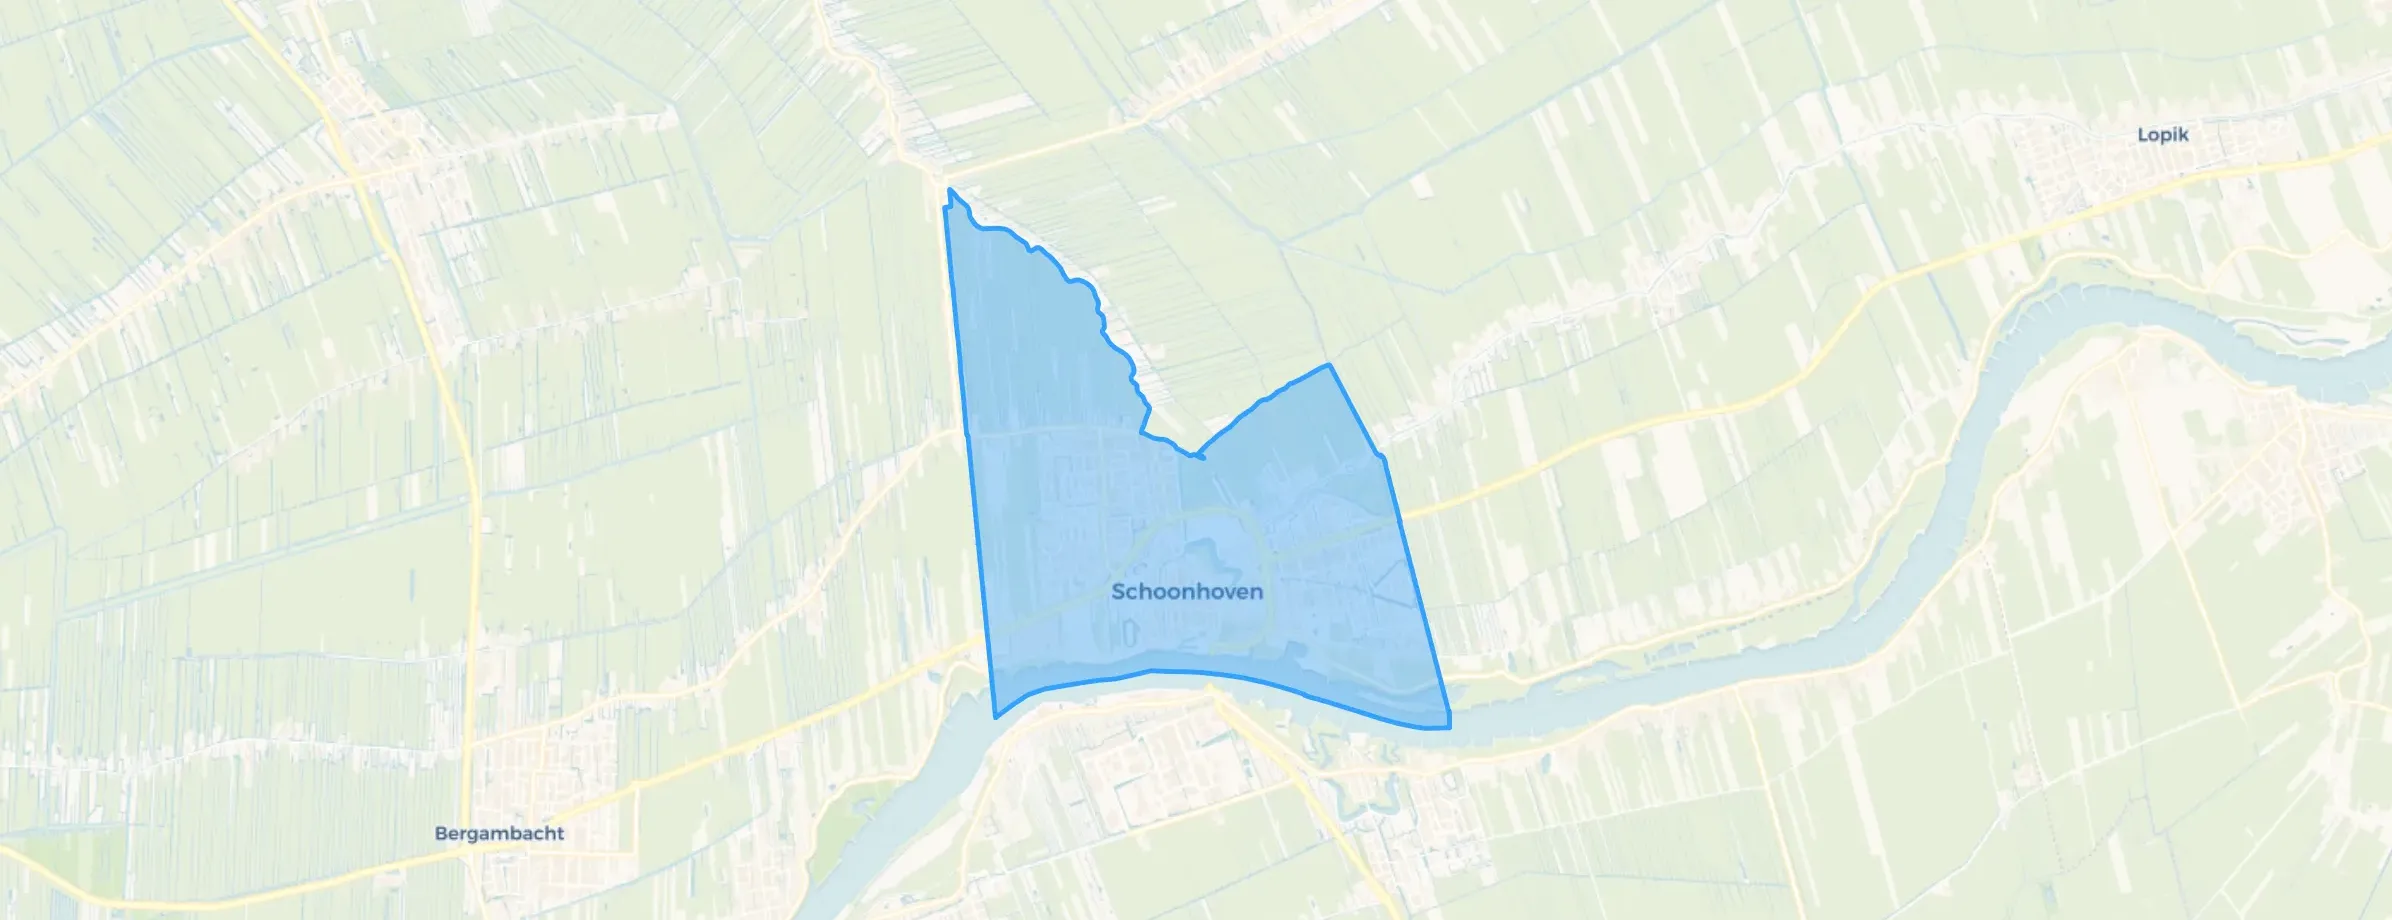
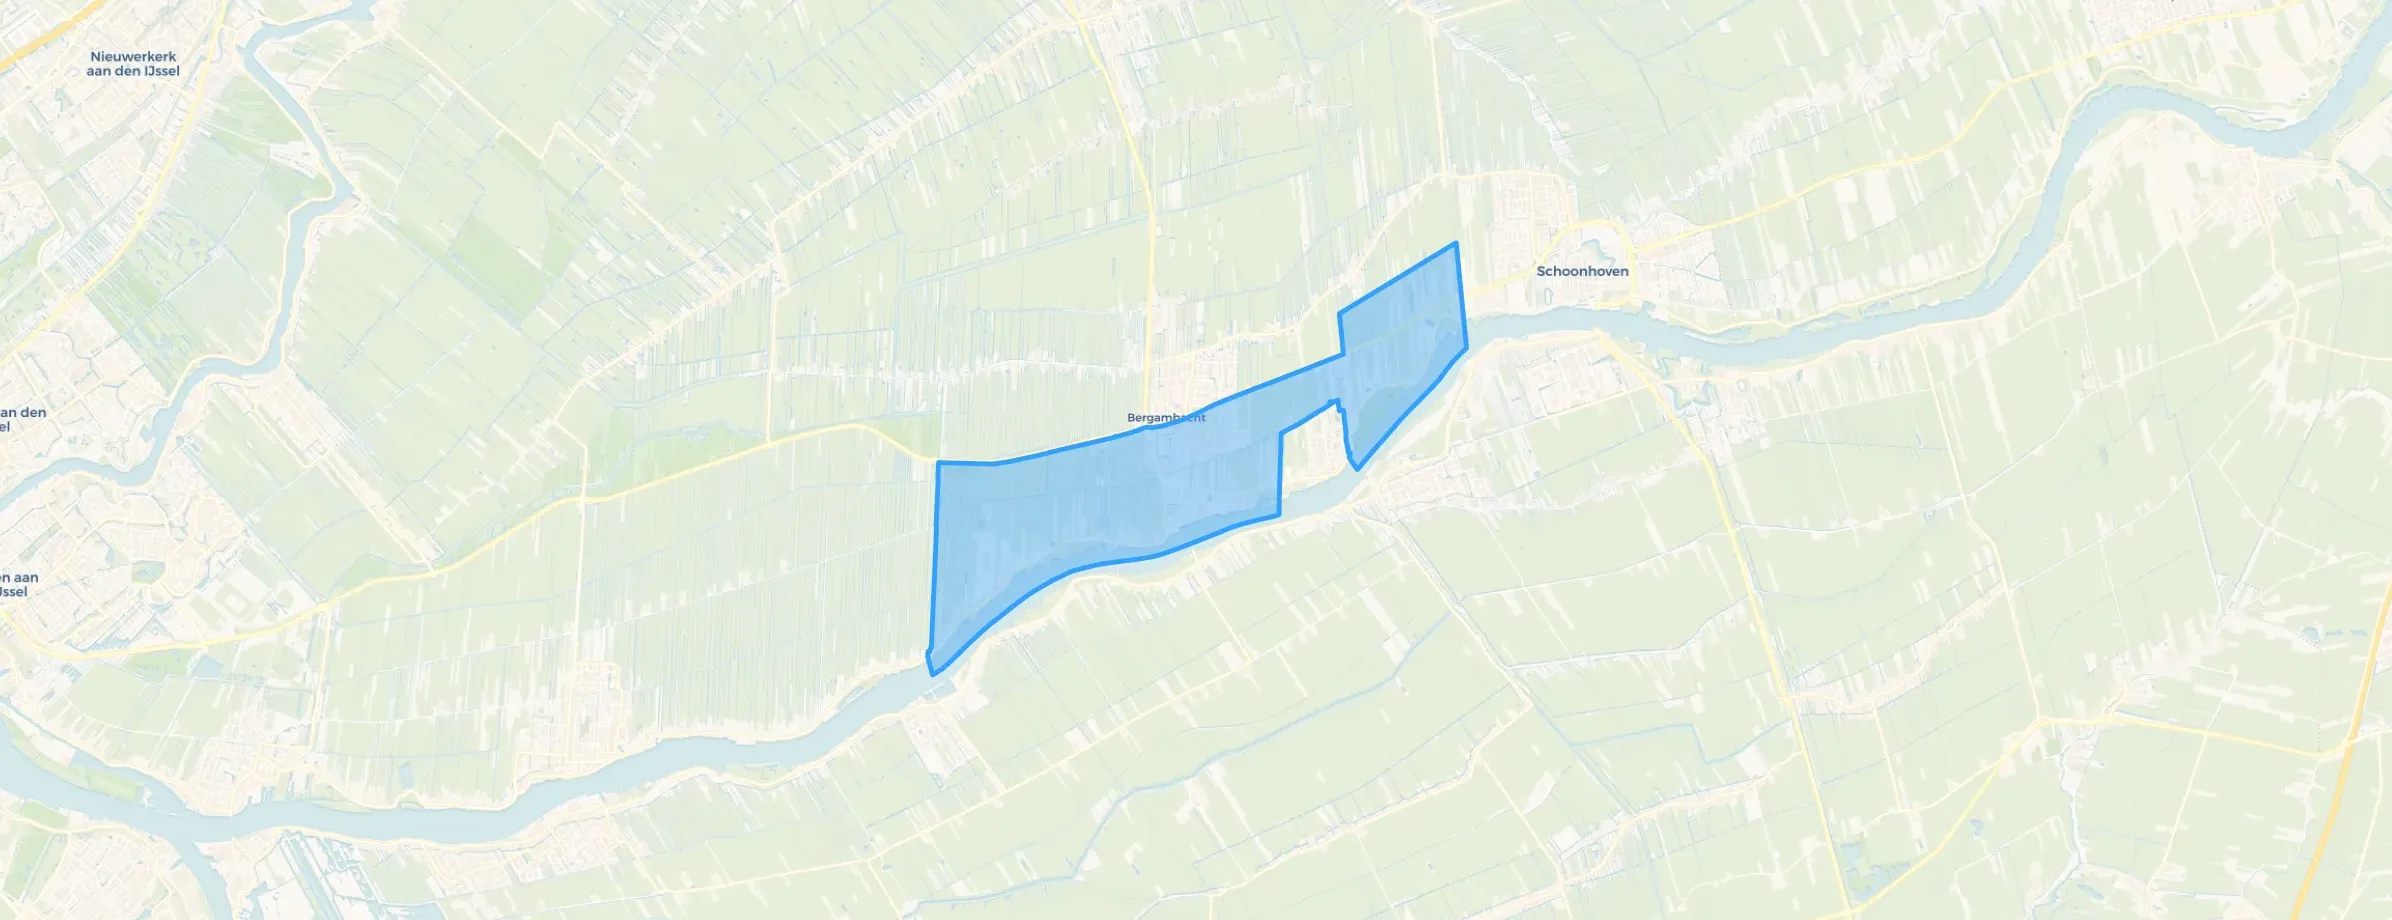
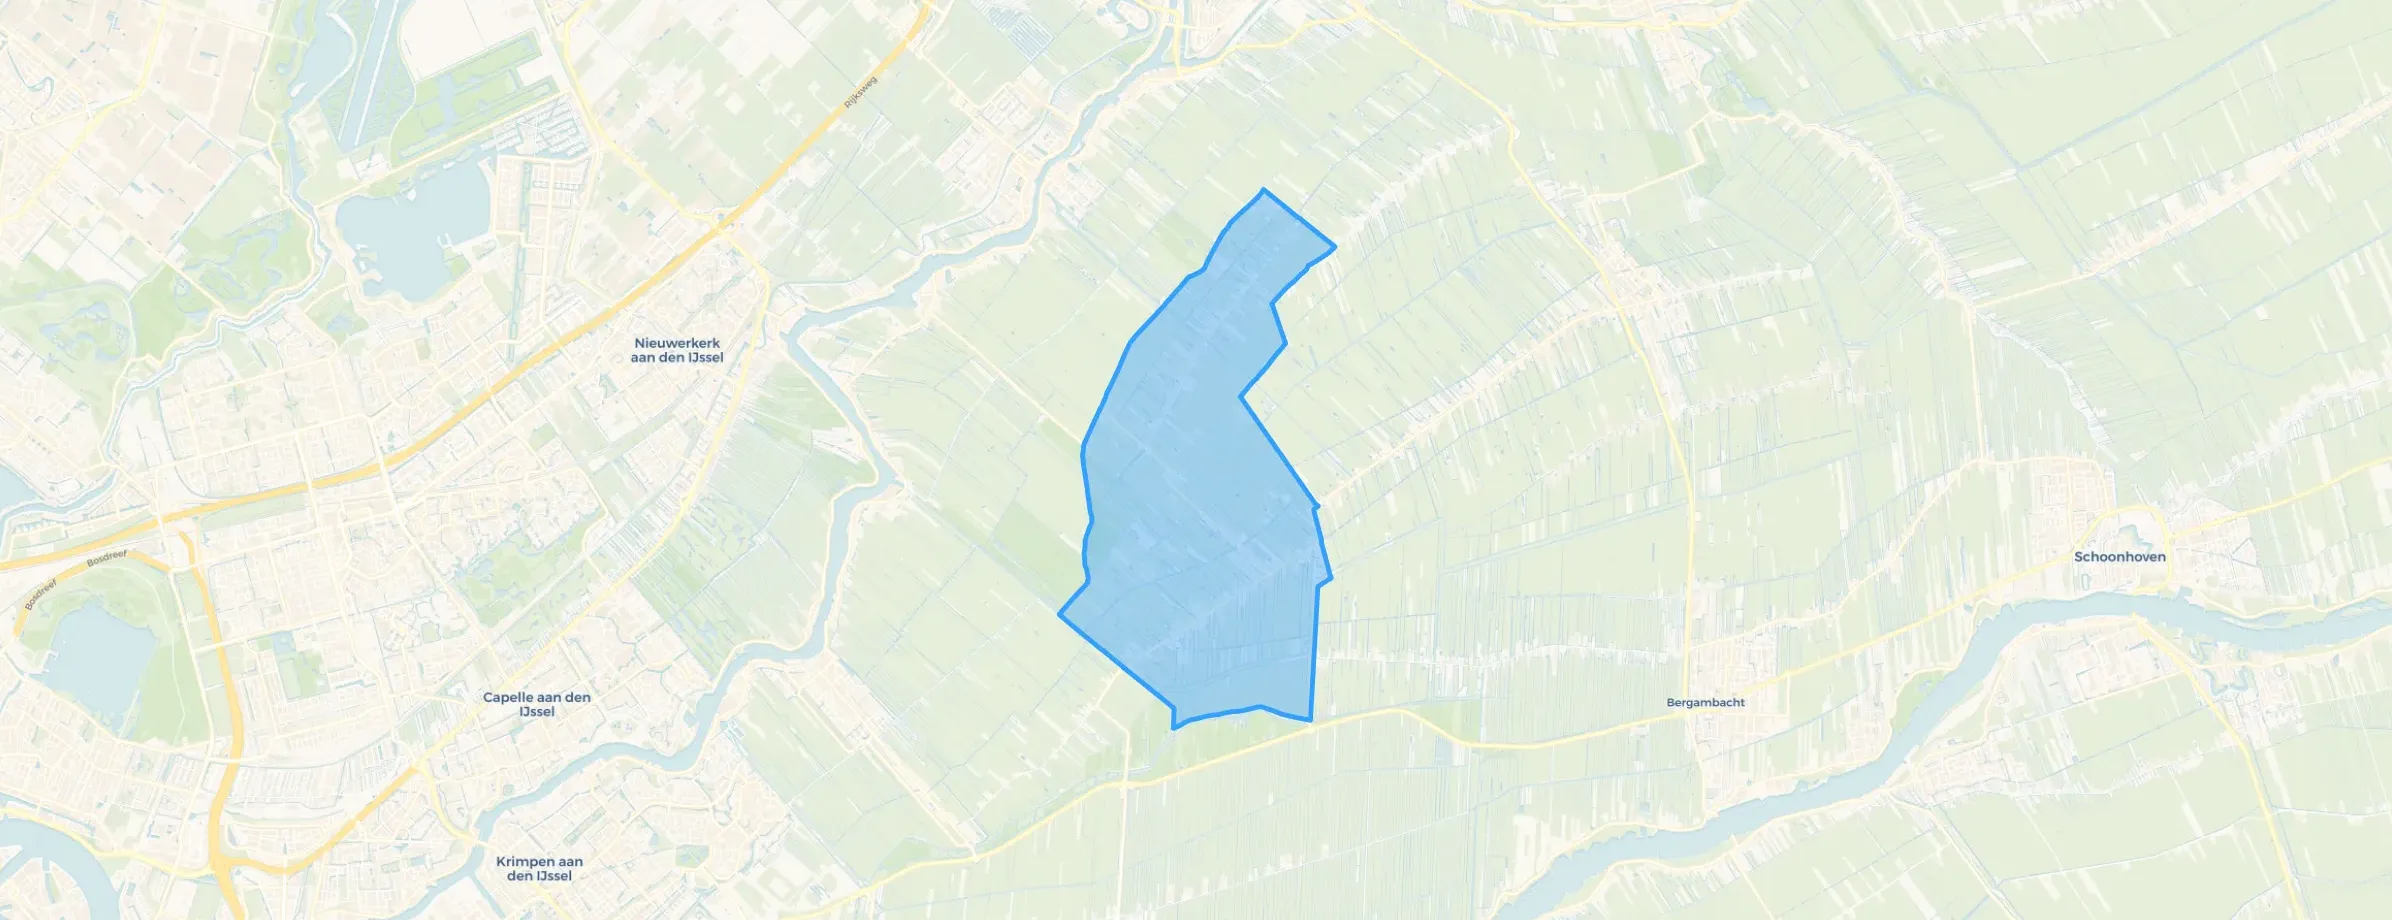
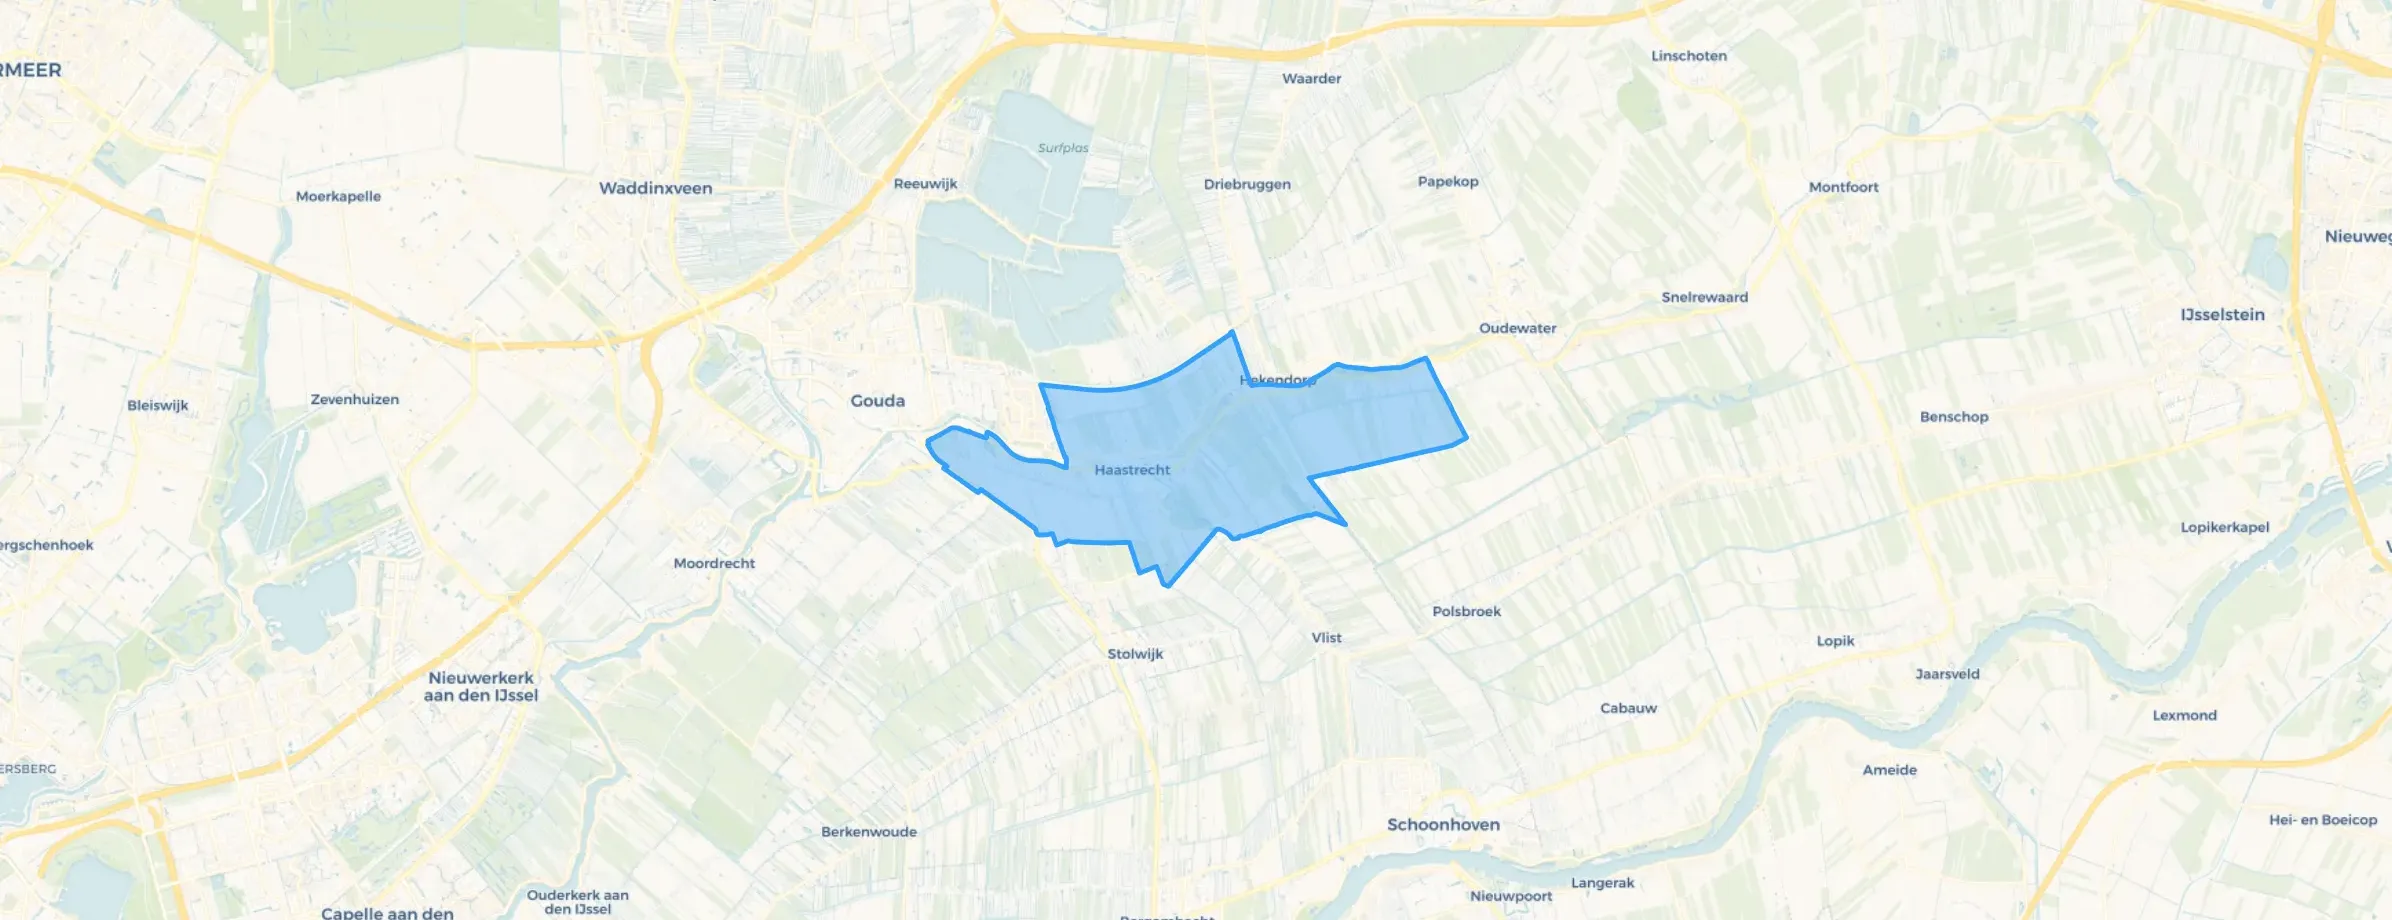
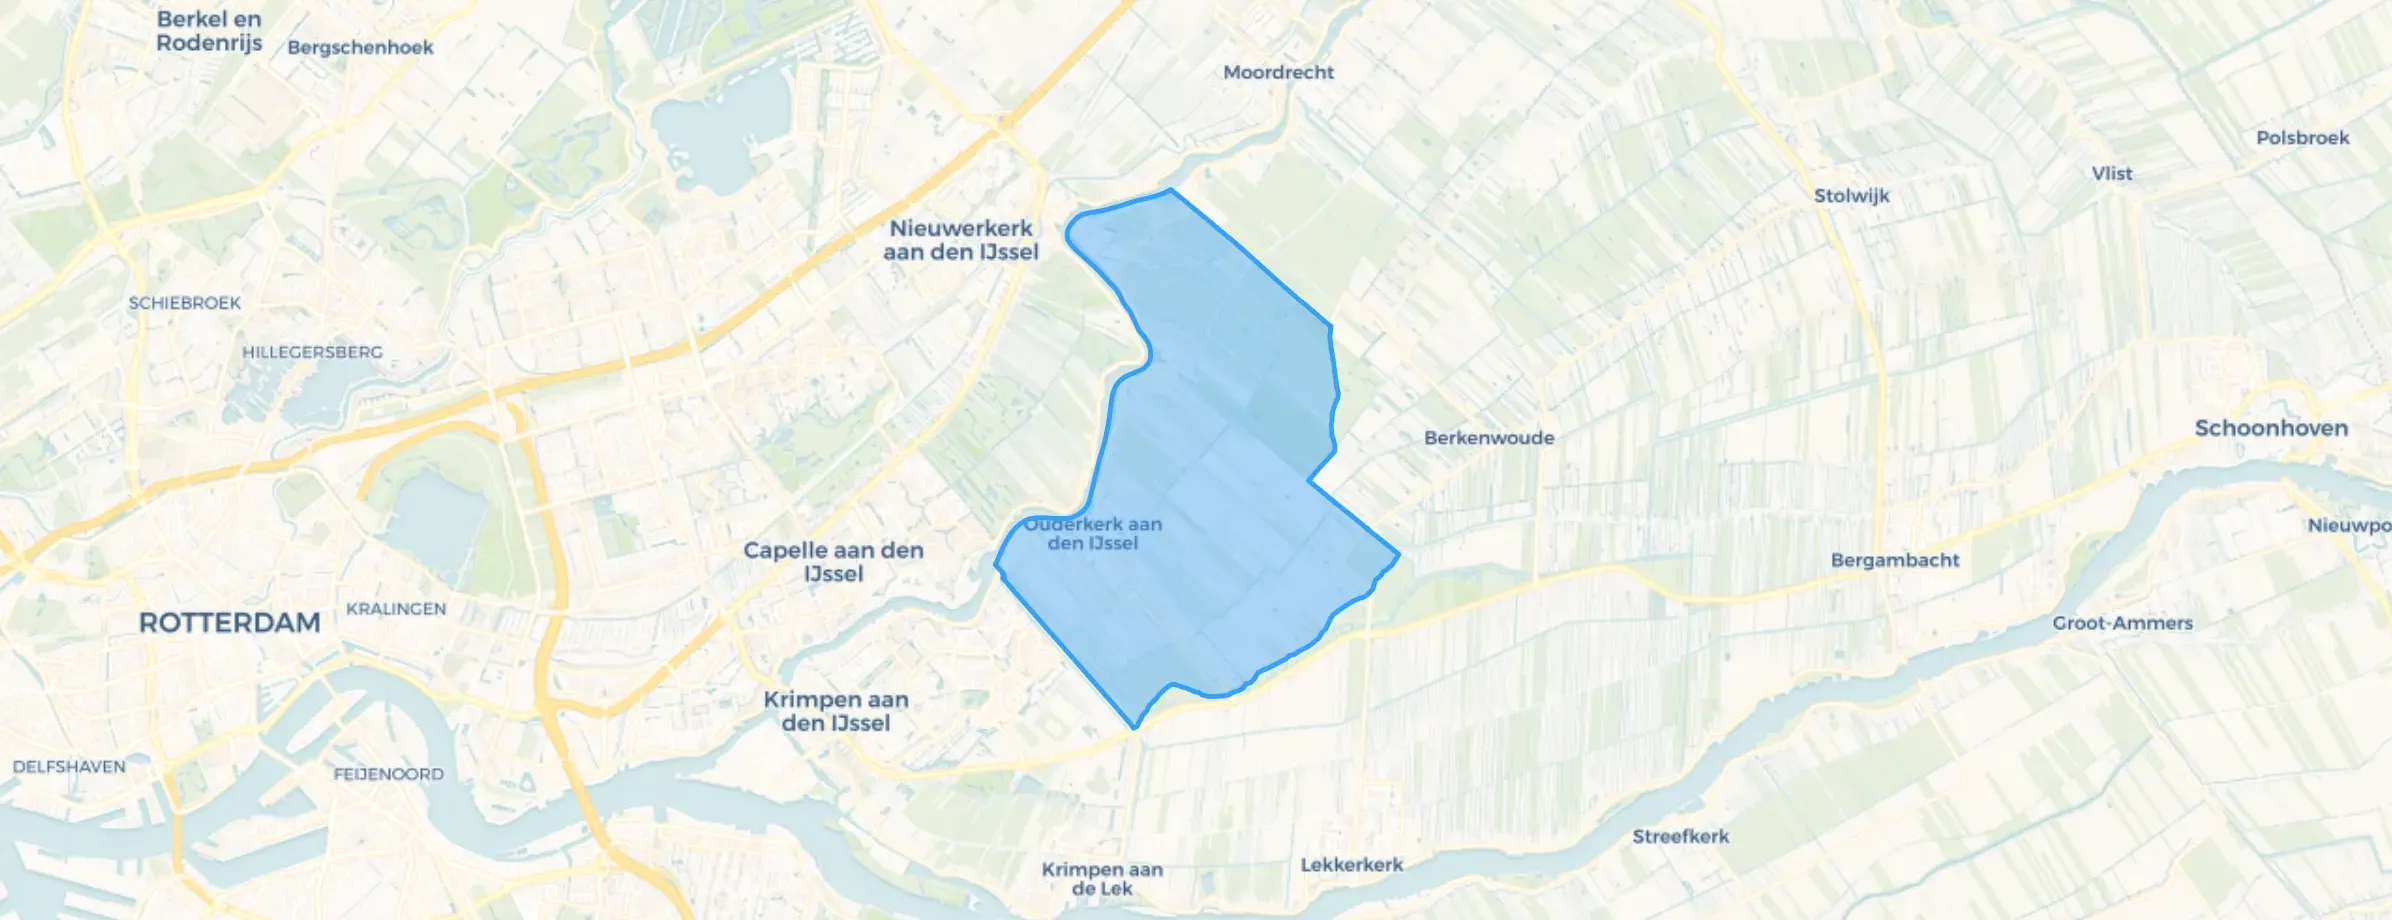
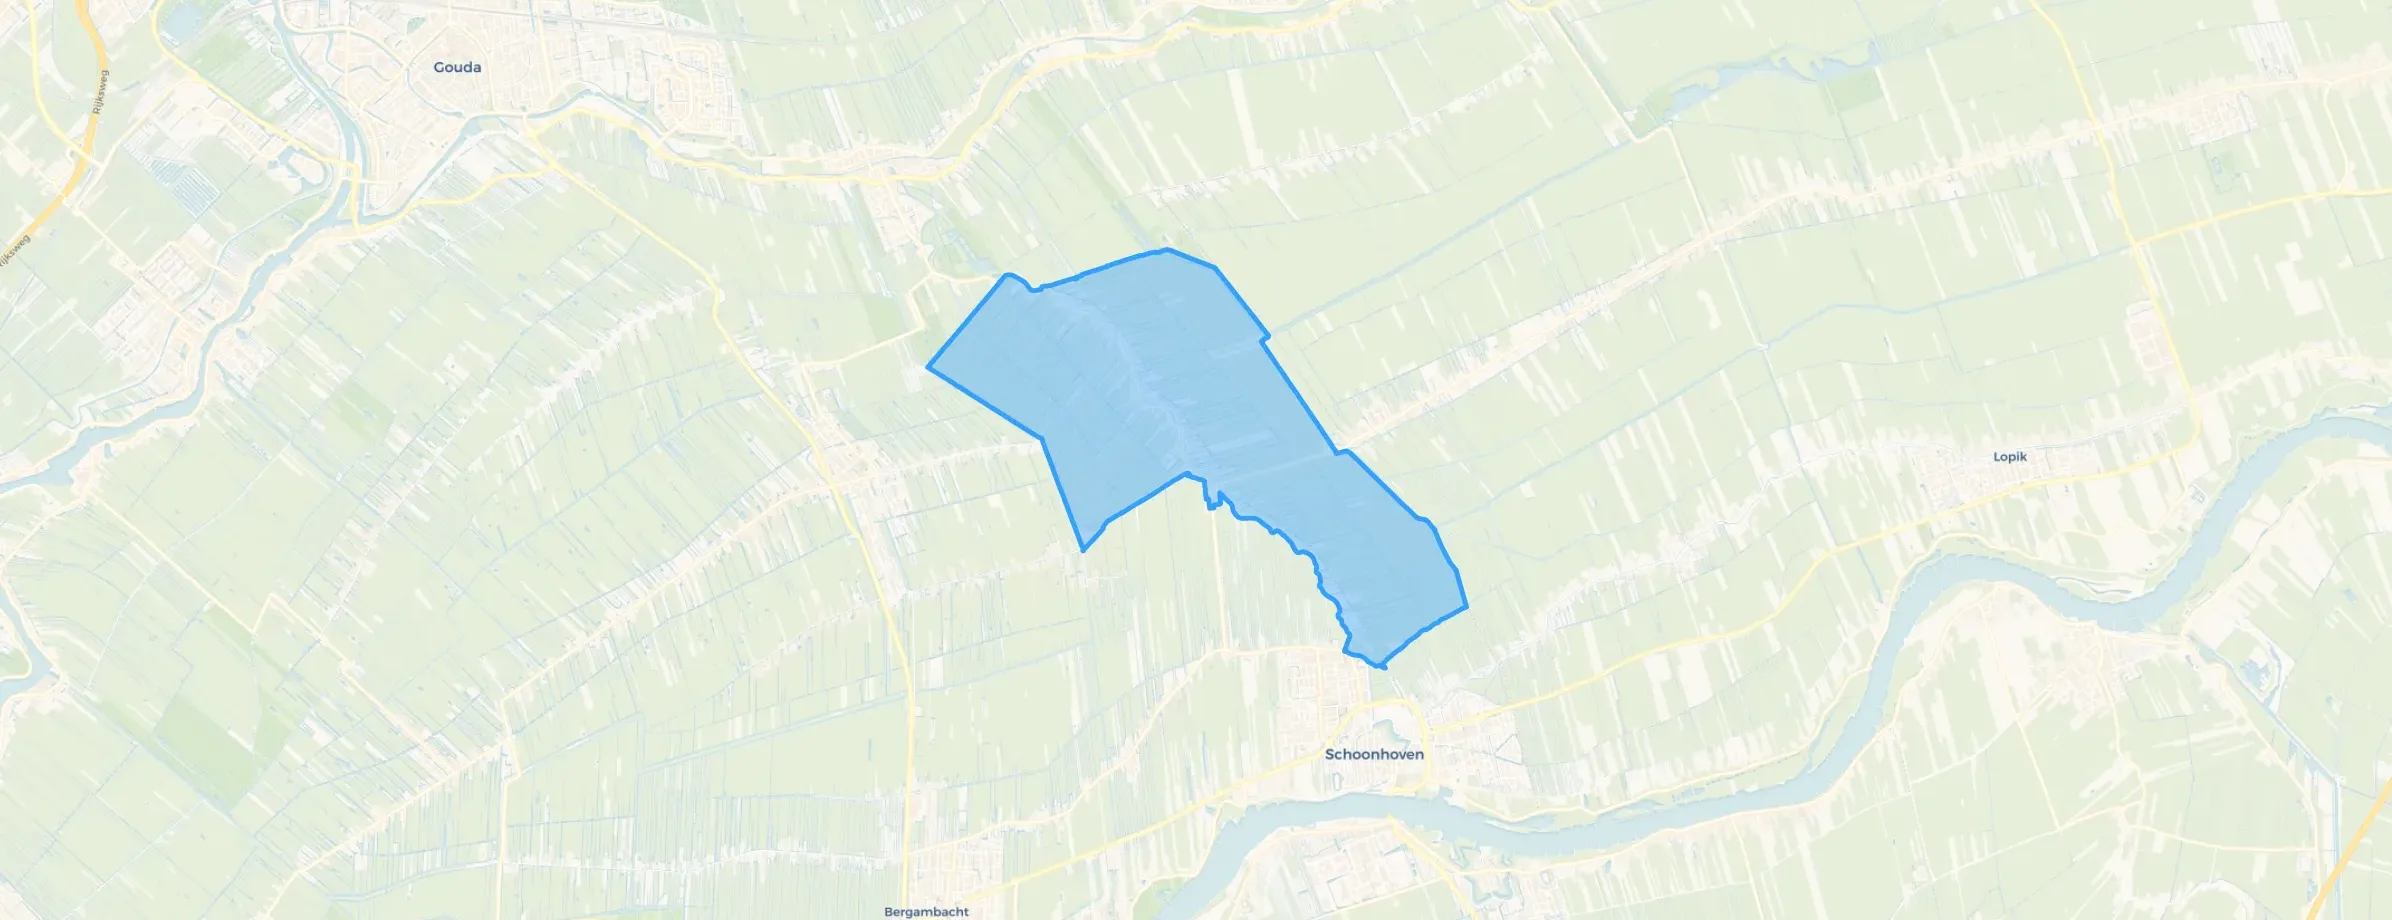
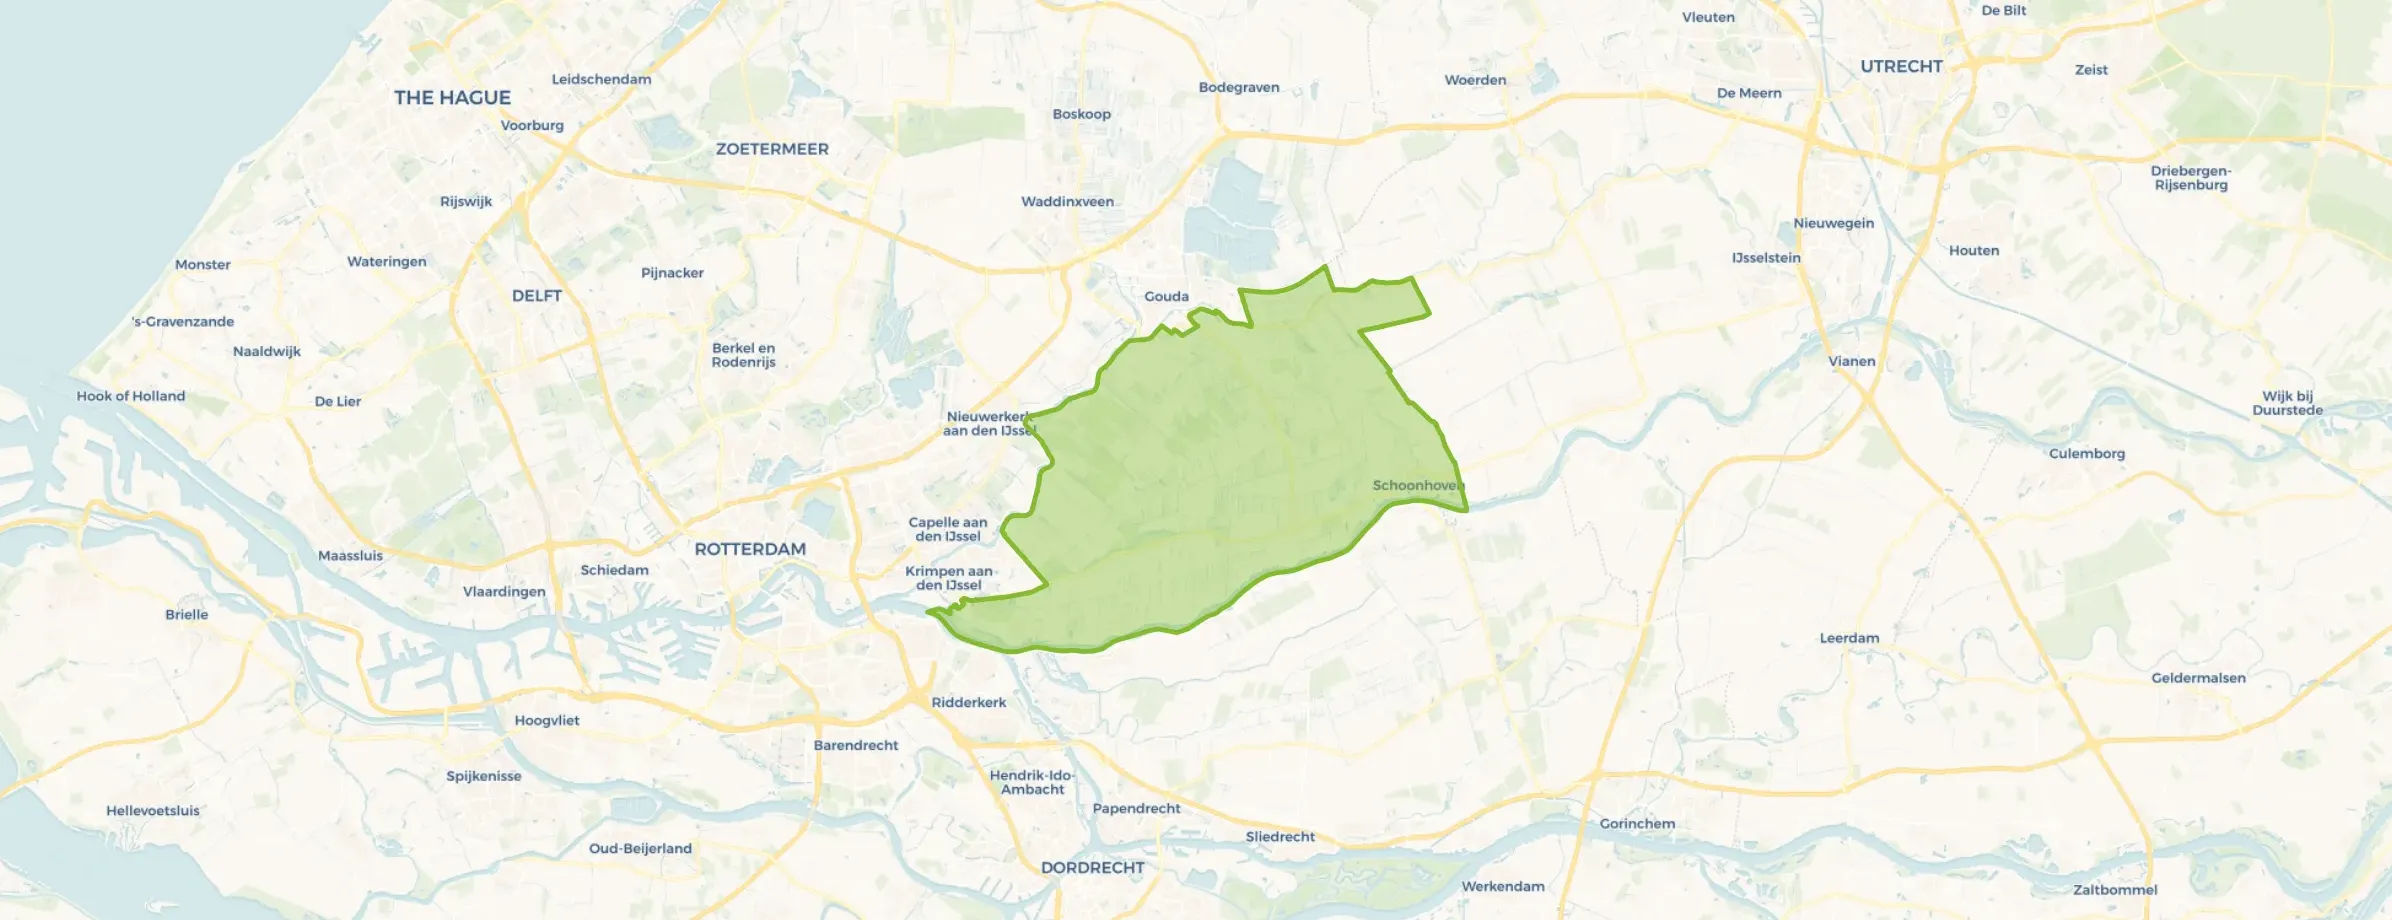
Krimpenerwaard is located in the province of Zuid-Holland The municipality has a total area of 16.131 hectares, of which 14.832 hectares are land and 1.299 hectares are water. The municipality is coded as GM1931. The postcode area is 2821AA-2941XZ.
Krimpenerwaard has 57.798 residents. Of these, 49,7% are men and 50,3% are women. Most residents are 45 to 65 years (26,3%). The other age groups are 22,6% for '65 years or older', 22,5% for '25 to 45 years', 16,4% for '0 to 15 years' and 12,1% for '15 to 25 years'. Of the residents, 44,1% is unmarried, 44,6% is married, 6,2% is divorced and 5,2% is widowed. 49.795 residents originate from the Netherlands, 2.725 come from Europe and 5.278 come from countries outside Europe.
There are 24.561 households in Krimpenerwaard. 32,1% of these are single-person households, 32,3% households without children and 35,7% households with children. The average household size is 2,3 persons. The national average is 2,1 persons.
In Krimpenerwaard there are 46.600 income recipients. The average income per income recipient is €42.000, which is €200 (0%) lower than the national average of €42.200. Per resident, the average income is €34.300, which is €600 (2%) lower than the national average of €34.900. Most residents of Krimpenerwaard are educated to an intermediate level. 44,5% have an intermediate education (HAVO, VWO or MBO 2-4), 28,4% have a lower education (VMBO or MBO 1) and 27,1% have a university or higher professional education (HBO/WO).
Of the 57.798 residents, around 76% are in paid employment, which amounts to 43.926 people. This is 4% higher than the national average of 72%. The majority of workers are in salaried employment (81%), while 19% are self-employed. In Krimpenerwaard, 26% of residents receive a benefit. The largest group is those receiving a state pension (AOW). 11.790 people receive this benefit.
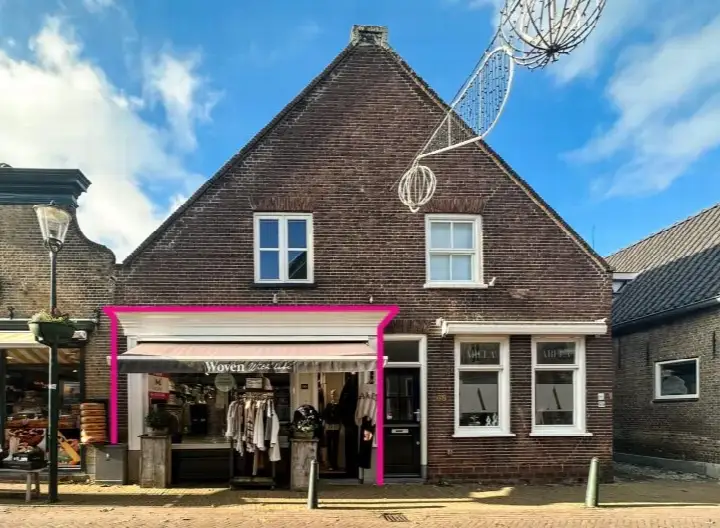
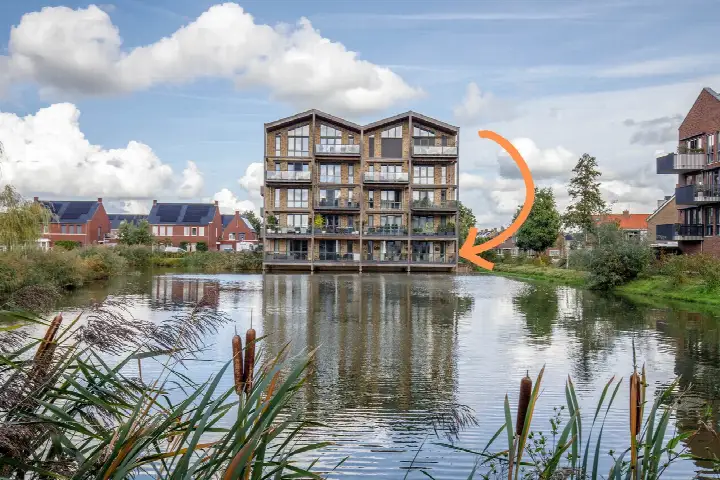
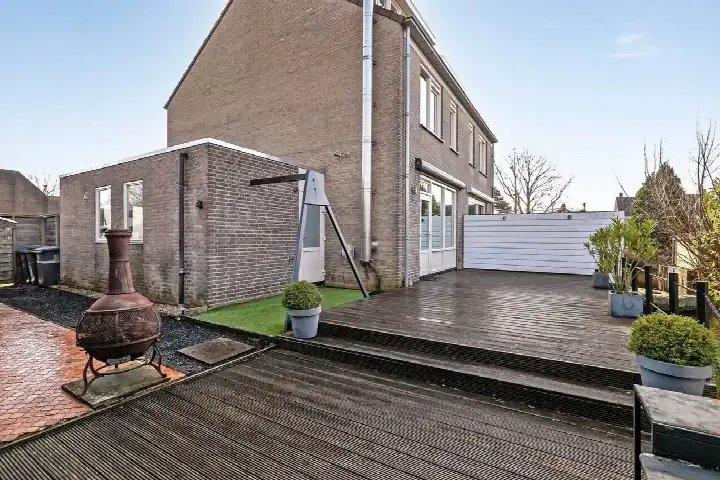
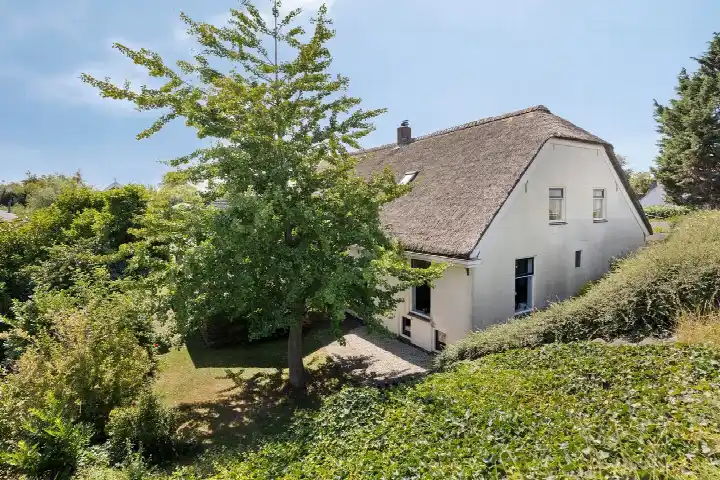
In Krimpenerwaard there are 24.661 homes with an average assessed value (WOZ) of €414.000. Of these, around 96% are occupied and 4% unoccupied. Most homes are owner-occupied. This amounts to 33% rental homes and 67% owner-occupied homes. Of the homes, 67% privately owned, 26% owned by housing associations and 7% owned by other landlords. The most common construction periods in Krimpenerwaard are 1970-1980 (19%) and 1950-1970 (18%).
There are currently no homes for sale in Krimpenerwaard. The most recently listed home is De Hoop 41 by Van Egmond Makelaardij op Funda. No homes were sold in Krimpenerwaard over the past year.
There are currently no homes for rent in Krimpenerwaard. The most recent home is Hoofdstraat 66, offered by ML2 Vastgoed. No homes were let in Krimpenerwaard over the past year.
No recent rental data available for Krimpenerwaard.
In Krimpenerwaard there are 15.174 addresses with a registered energy label. The most common labels are A (28%), C (23%) and B (15%). On average, an address in Krimpenerwaard uses 2.680 kWh of electricity per year. This is 5% above the national average of 2.550 kWh. Natural gas consumption, at 860 m³ per year, is 8% above the national average of 800 m³.
Have lived there for 42 years with full satisfaction! Only recently nothing has been done about the front and back gardens of various houses!
Auto-translated to English by AIThe neighbourhood was always good! But a lot of people are moving away, so we'll have to wait and see what the future brings.
Auto-translated to English by AIPeople know each other and help each other, without constantly dropping by or violating each other's privacy. The houses are all about 100 years old or even older and belong to the historic village centre. The village has a lively, extensive shopping street where regular fairs and other events are organised. Here there are no large chain stores but mostly specialist quality shops that have often been run by the same family for generations. It is pleasant to live in Bergambacht
Auto-translated to English by AII mainly like the neighbourhood because I grew up here and still live here. That's why I know everything, and it's not a big neighbourhood either, which I also like. The people are okay, not a stingy neighbourhood or anything. Just few facilities for young people, like nice shops. I do think it's a shame that there is apparently one man who buys up a lot and then makes boring things out of it, like boring clothing stores for older people. As a result, the neighbourhood really becomes more for the elderly. Still, I am happy to live here because it is small and, for me, quite manageable, and it has the basics, and that's the most important thing. Accessibility by car to this neighbourhood is fine, but by public transport it's really poorly arranged. Sometimes you have to wait so long, for example at Capelse brug, for a bus here. So the public transport connection here could really be better.
Auto-translated to English by AIFine neighbourhood
Auto-translated to English by AICosiness
Auto-translated to English by AILovely to live here. Everything you need is nearby, the houses and surroundings are beautiful. The only downside is that it's almost impossible to find a home.
Auto-translated to English by AIStolwijk is nice to live in. However, there is very little to no opportunity to move on to an affordable 55+ home. Apartments are very scarce and terribly expensive, over €400,000, which is not feasible for us.
Auto-translated to English by AIOver the past year a home for sale in Krimpenerwaard was listed for an average of €566,617 (€4,703 per m²). Last quarter prices fell by 14%.
A rental home in Krimpenerwaard cost an average of €1,922 per month (€15 per m²). That is 11% below the national average.
Residents give Krimpenerwaard a 7.4 out of 10 based on 11 reviews. Especially safety (7.9) scores well; amenities (6.8) receives the lowest rating.
Gemeente Krimpenerwaard has 57,798 residents. Many families: 36% of the households have children.
From Krimpenerwaard you can on average reach a supermarket at 1.1 km, a GP at 1.3 km, a railway station at 10.9 km, a primary school at 0.8 km (as the crow flies, source: CBS).
Right now you will find 277 homes for sale and 12 homes for rent in Krimpenerwaard.