Municipality in Zuid-Holland
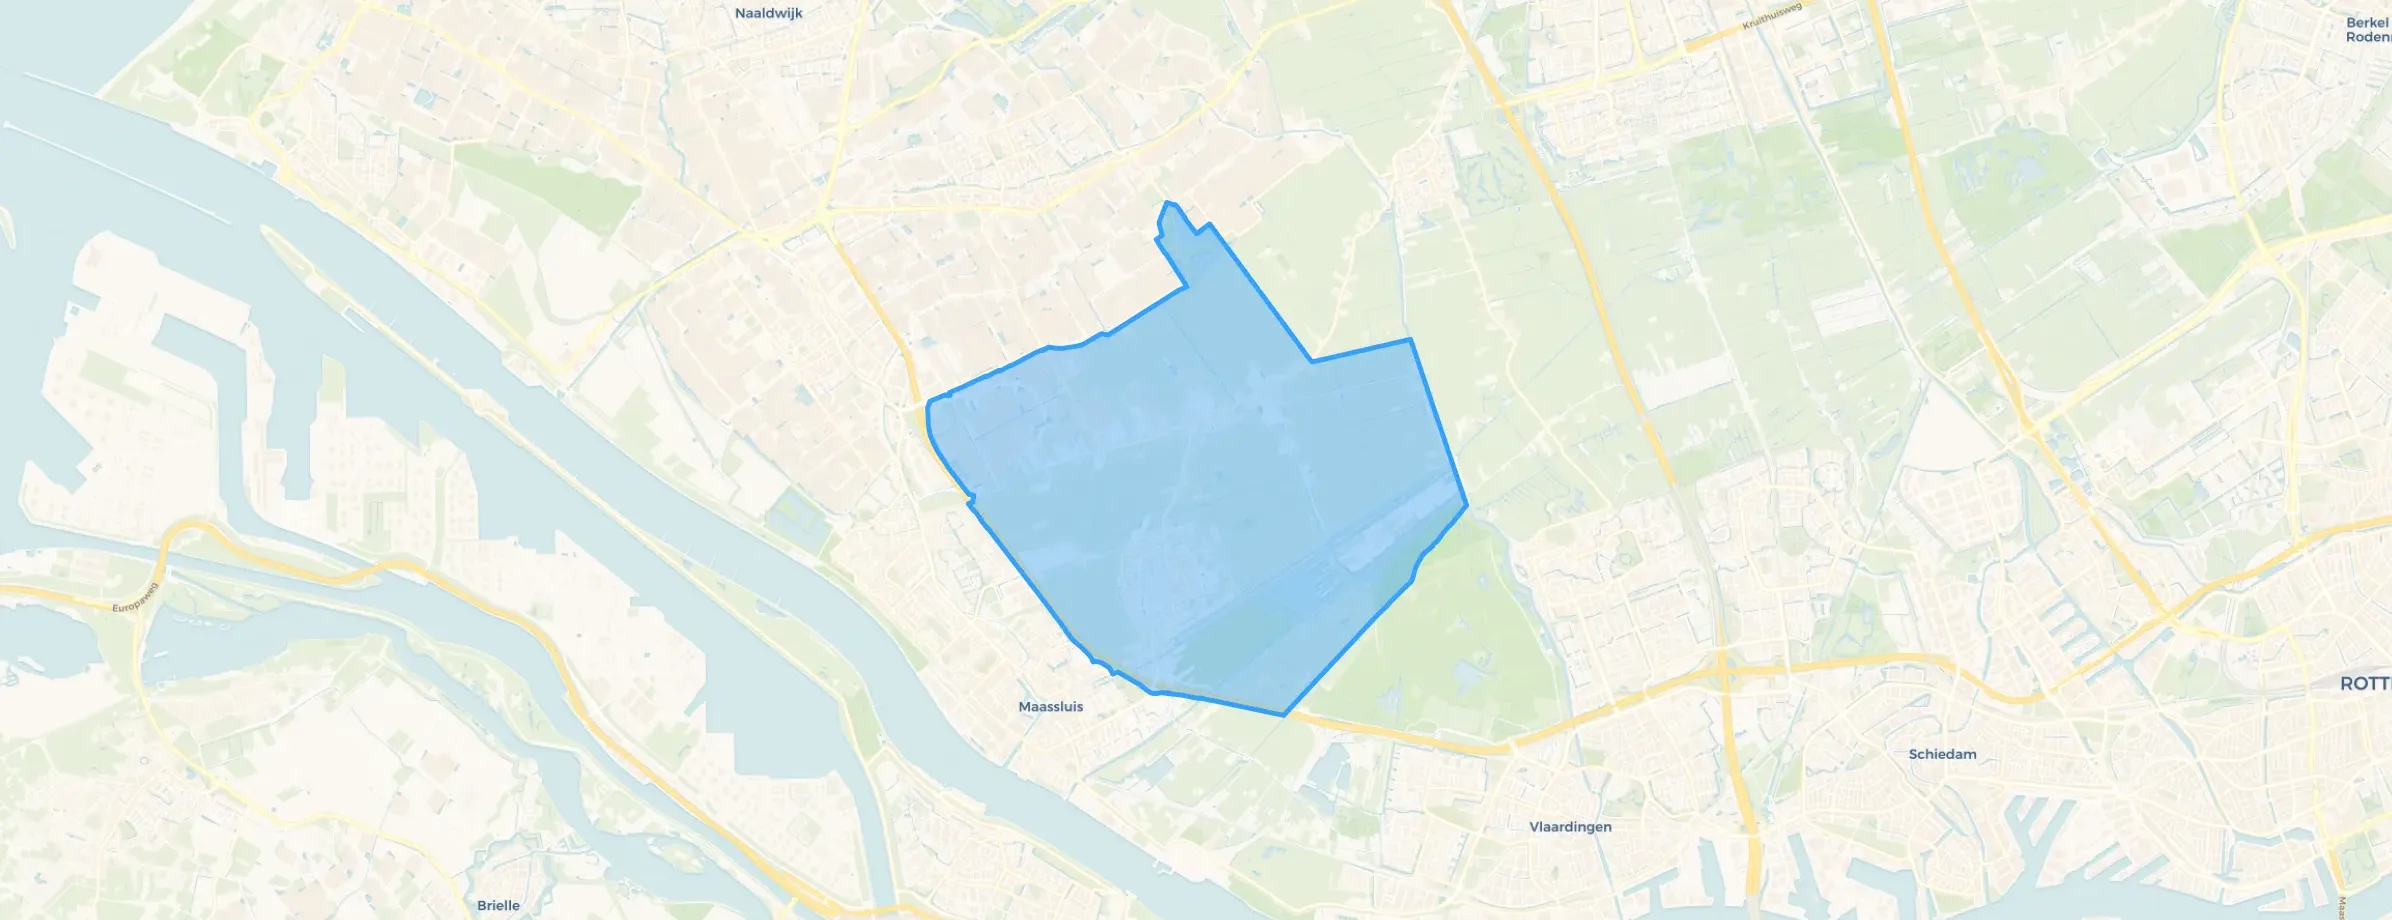
Midden-Delfland is located in the province of Zuid-Holland The municipality has a total area of 4.938 hectares, of which 4.719 hectares are land and 219 hectares are water. The municipality is coded as GM1842. The postcode area is 2635AC-3155XK.
Midden-Delfland has 19.423 residents. Of these, 50,0% are men and 50,0% are women. Most residents are 45 to 65 years (28,5%). The other age groups are 22,1% for '65 years or older', 21,2% for '25 to 45 years', 16,5% for '0 to 15 years' and 11,7% for '15 to 25 years'. Of the residents, 44,6% is unmarried, 45,0% is married, 5,7% is divorced and 4,6% is widowed. 16.317 residents originate from the Netherlands, 1.089 come from Europe and 2.017 come from countries outside Europe.
There are 8.128 households in Midden-Delfland. 28,8% of these are single-person households, 32,2% households without children and 39,0% households with children. The average household size is 2,4 persons. The national average is 2,1 persons.
In Midden-Delfland there are 15.800 income recipients. The average income per income recipient is €47.600, which is €5.400 (13%) higher than the national average of €42.200. Per resident, the average income is €39.100, which is €4.200 (12%) higher than the national average of €34.900. Most residents of Midden-Delfland are educated to an intermediate level. 39,7% have an intermediate education (HAVO, VWO or MBO 2-4), 37,6% have a university or higher professional education (HBO/WO) and 22,8% have a lower education (VMBO or MBO 1).
Of the 19.423 residents, around 77% are in paid employment, which amounts to 14.956 people. This is 5% higher than the national average of 72%. The majority of workers are in salaried employment (81%), while 19% are self-employed. In Midden-Delfland, 24% of residents receive a benefit. The largest group is those receiving a state pension (AOW). 3.860 people receive this benefit.
In Midden-Delfland there are 8.145 homes with an average assessed value (WOZ) of €496.000. Of these, around 97% are occupied and 3% unoccupied. Most homes are owner-occupied. This amounts to 27% rental homes and 73% owner-occupied homes. Of the homes, 73% privately owned, 22% owned by housing associations and 5% owned by other landlords. The most common construction periods in Midden-Delfland are 1990-2000 (18%) and 1950-1970 (17%).
There are currently no homes for sale in Midden-Delfland. The most recently listed home is Voordijkshoorn 2 by MORRIS NVM makelaars l taxateurs op Funda. No homes were sold in Midden-Delfland over the past year.
There are currently no homes for rent in Midden-Delfland. The most recent home is Goudappel 54, offered by www.woonnet-haaglanden.nl. No homes were let in Midden-Delfland over the past year.
No recent rental data available for Midden-Delfland.
In Midden-Delfland there are 4.746 addresses with a registered energy label. The most common labels are A (34%), B (21%) and C (21%). On average, an address in Midden-Delfland uses 2.710 kWh of electricity per year. This is 6% above the national average of 2.550 kWh. Natural gas consumption in this neighbourhood, at 800 m³ per year, exactly matches the national average.
We were immediately taken into the community
Auto-translated to English by AIVaried but generally good.. we have many loose dogs here, something needs to be done about that, but otherwise it's nice and the communication is okay. Also regarding public transport, there is room for improvement. Ground containers, who thought that a full rubbish bag barely fits through the flap? A national dilemma, but in a village in the municipality of Midden Delfland it's very annoying when the waste blows across the polder.
Auto-translated to English by AIGrew up in a warm environment
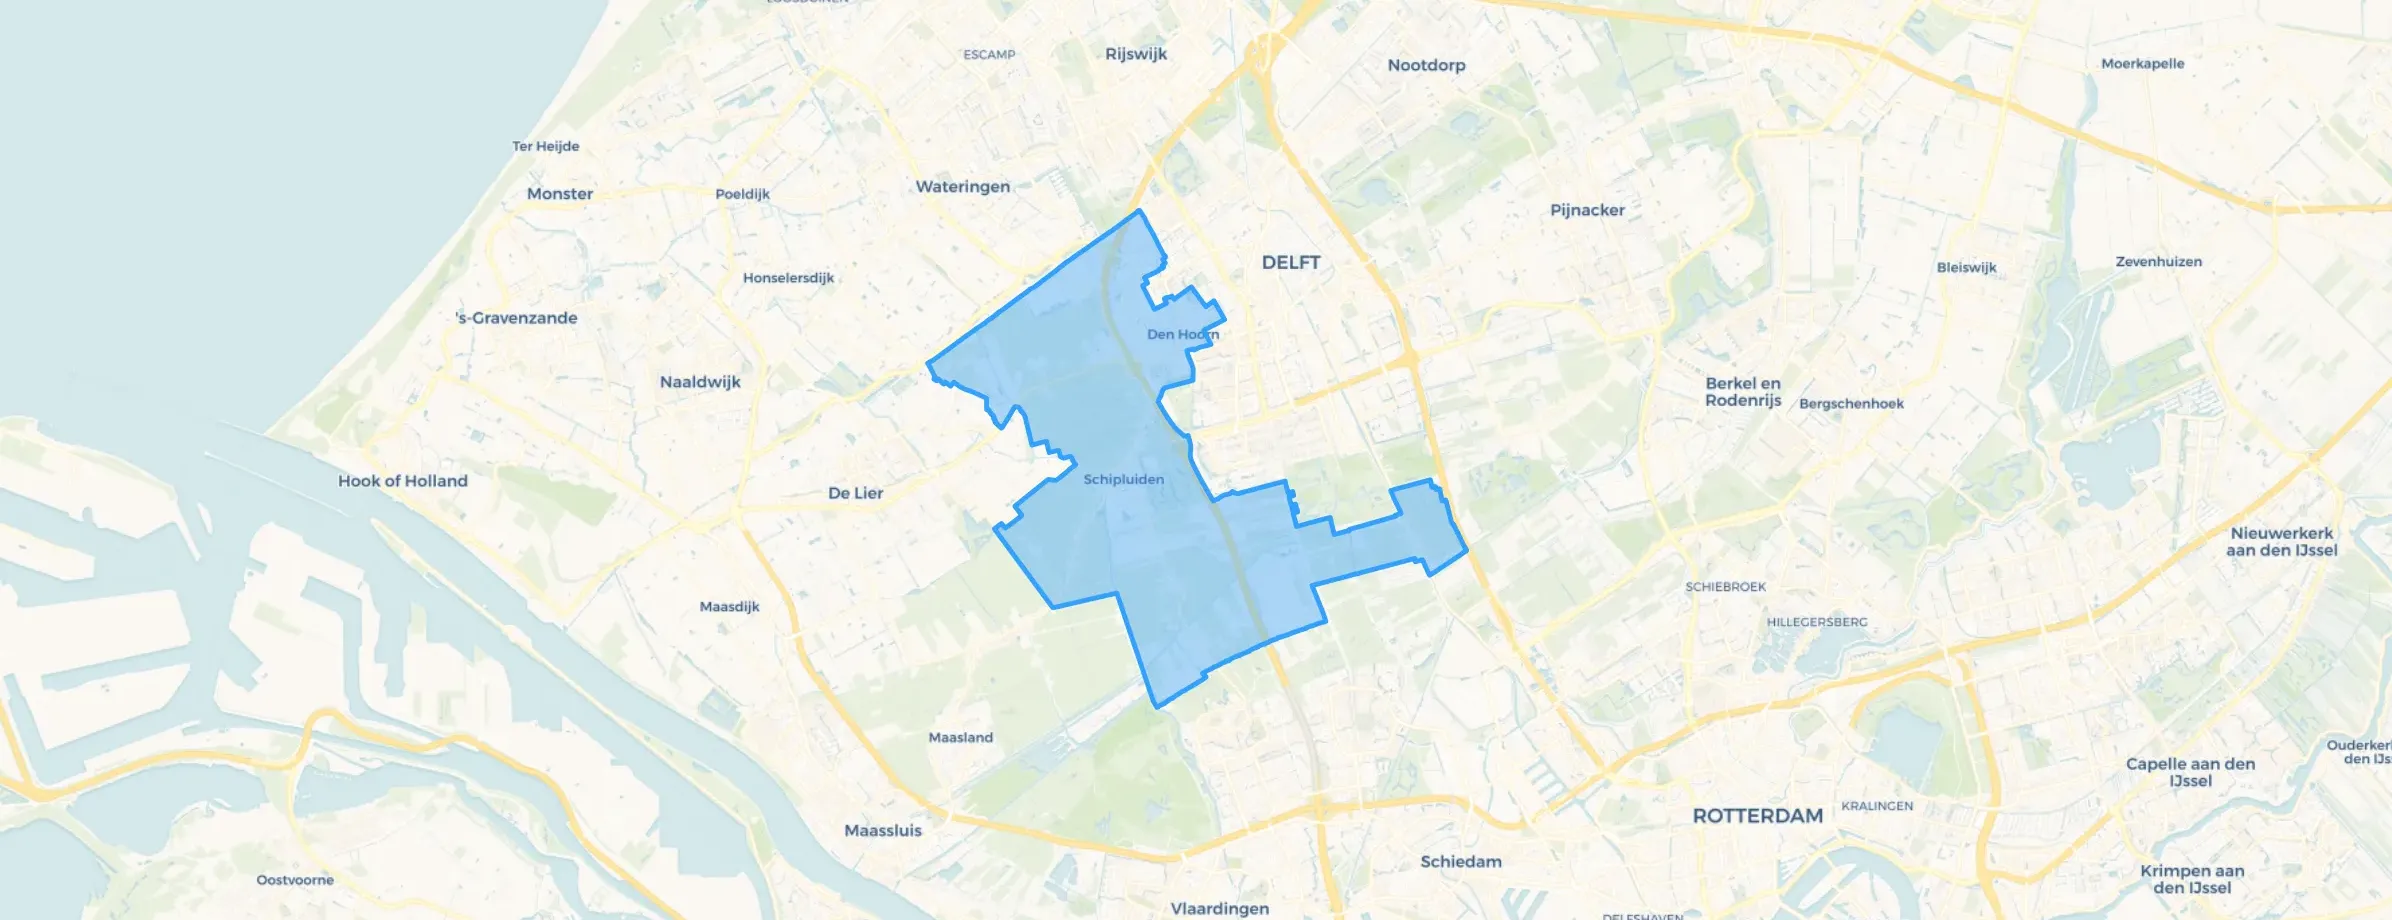
Auto-translated to English by AIDen Hoorn has been a village for centuries, since 1100 Den Hoorn has been a village; previously it fell under the municipality of Schipluiden and since the formation of the municipality of Midden-Delfland our village falls under that. Den Hoorn is still quite a bit larger than the indicated part on the map, with about 5 or 6 (for the local population) identifiable village parts/neighbourhoods.
Auto-translated to English by AIOver the past year a home for sale in Midden-Delfland was listed for an average of €616,609 (€4,904 per m²). Last quarter prices fell by 7%.
A rental home in Midden-Delfland cost an average of €2,306 per month (€17 per m²).
Residents give Midden-Delfland a 7.9 out of 10 based on 4 reviews. Safety stands out with a 8.8; accessibility lags behind with a 6.5.
Gemeente Midden-Delfland has 19,423 residents. Many families: 39% of the households have children.
The housing supply in Midden-Delfland is remarkably efficient: 58% has an A, A+ or B label. The average natural gas consumption per household is 800 m³ per year.
From Midden-Delfland you can on average reach a supermarket at 0.8 km, a GP at 0.9 km, a railway station at 6.4 km, a primary school at 0.7 km (as the crow flies, source: CBS).
Right now you will find 87 homes for sale and 5 homes for rent in Midden-Delfland.