Municipality in Zuid-Holland
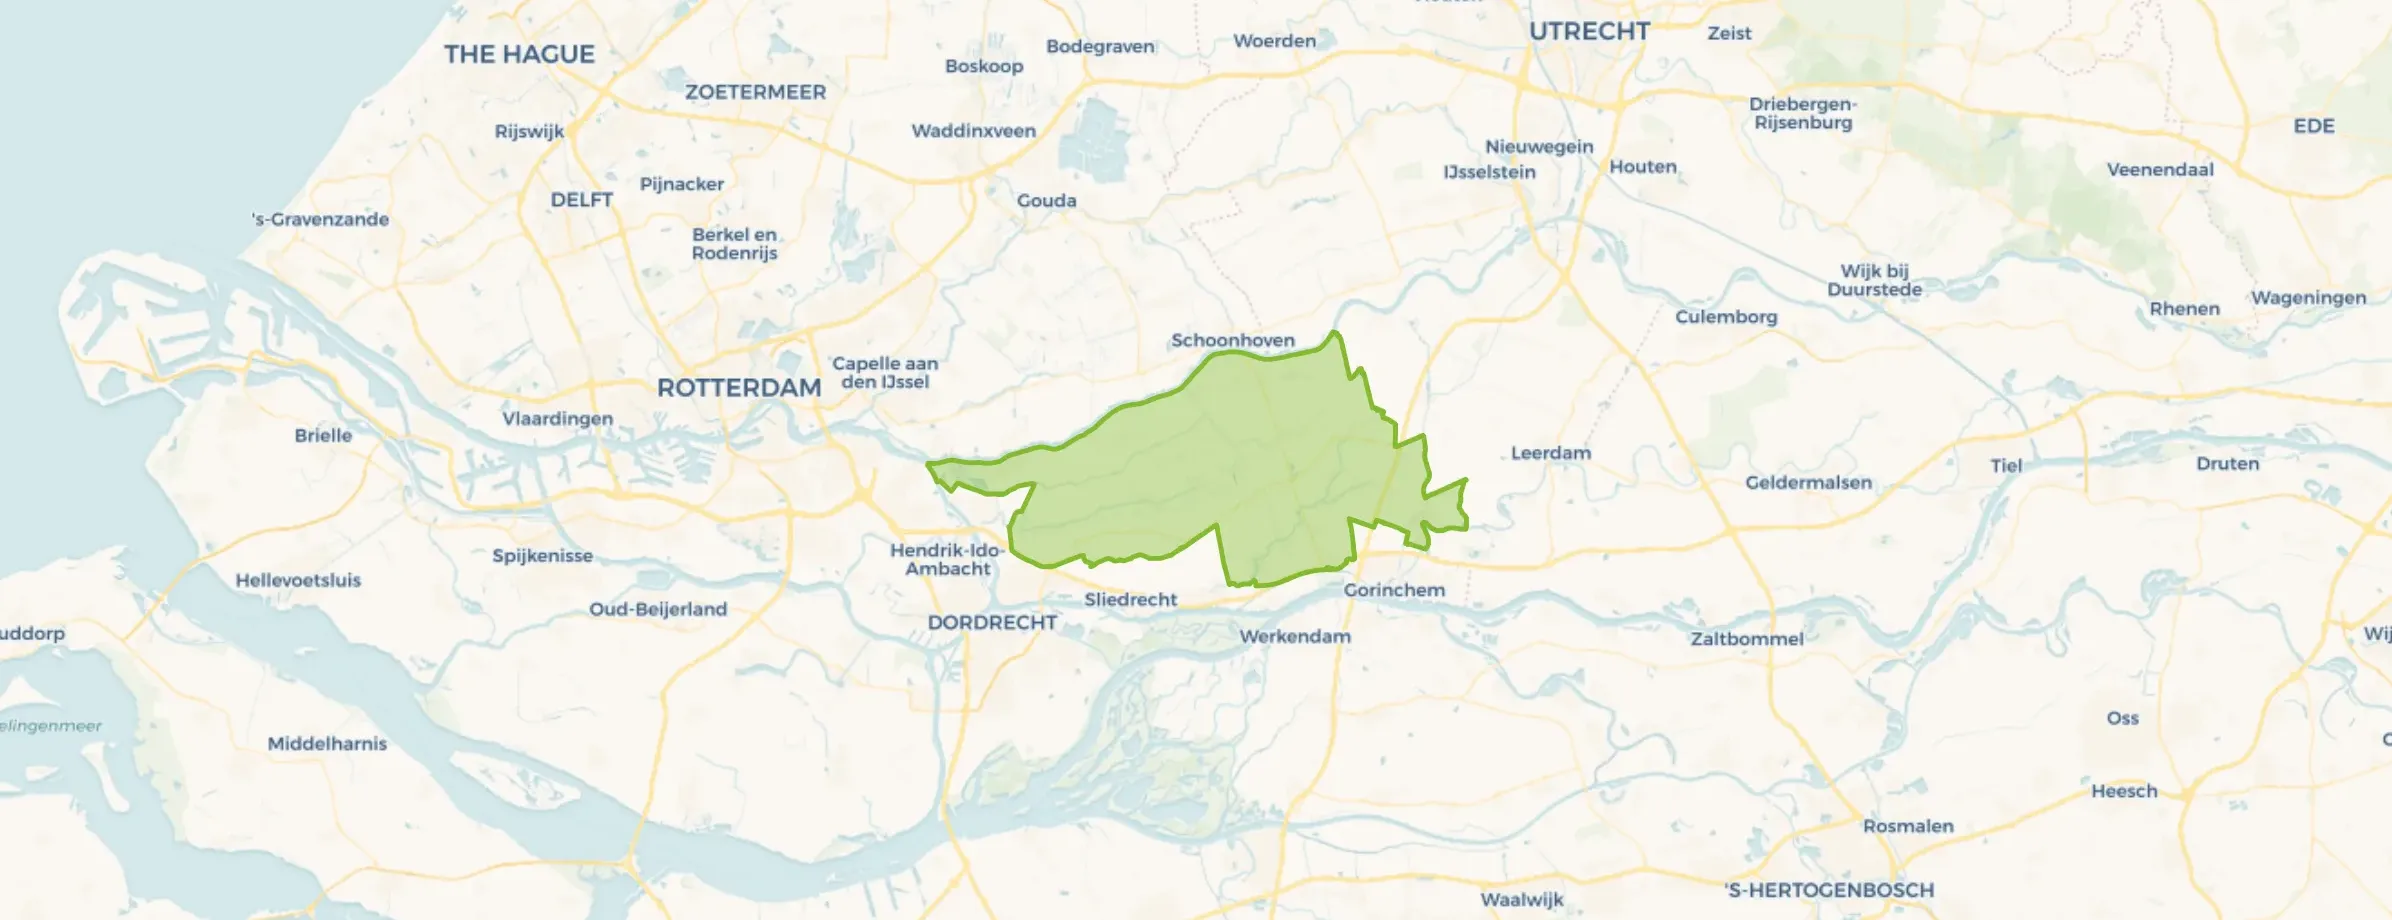
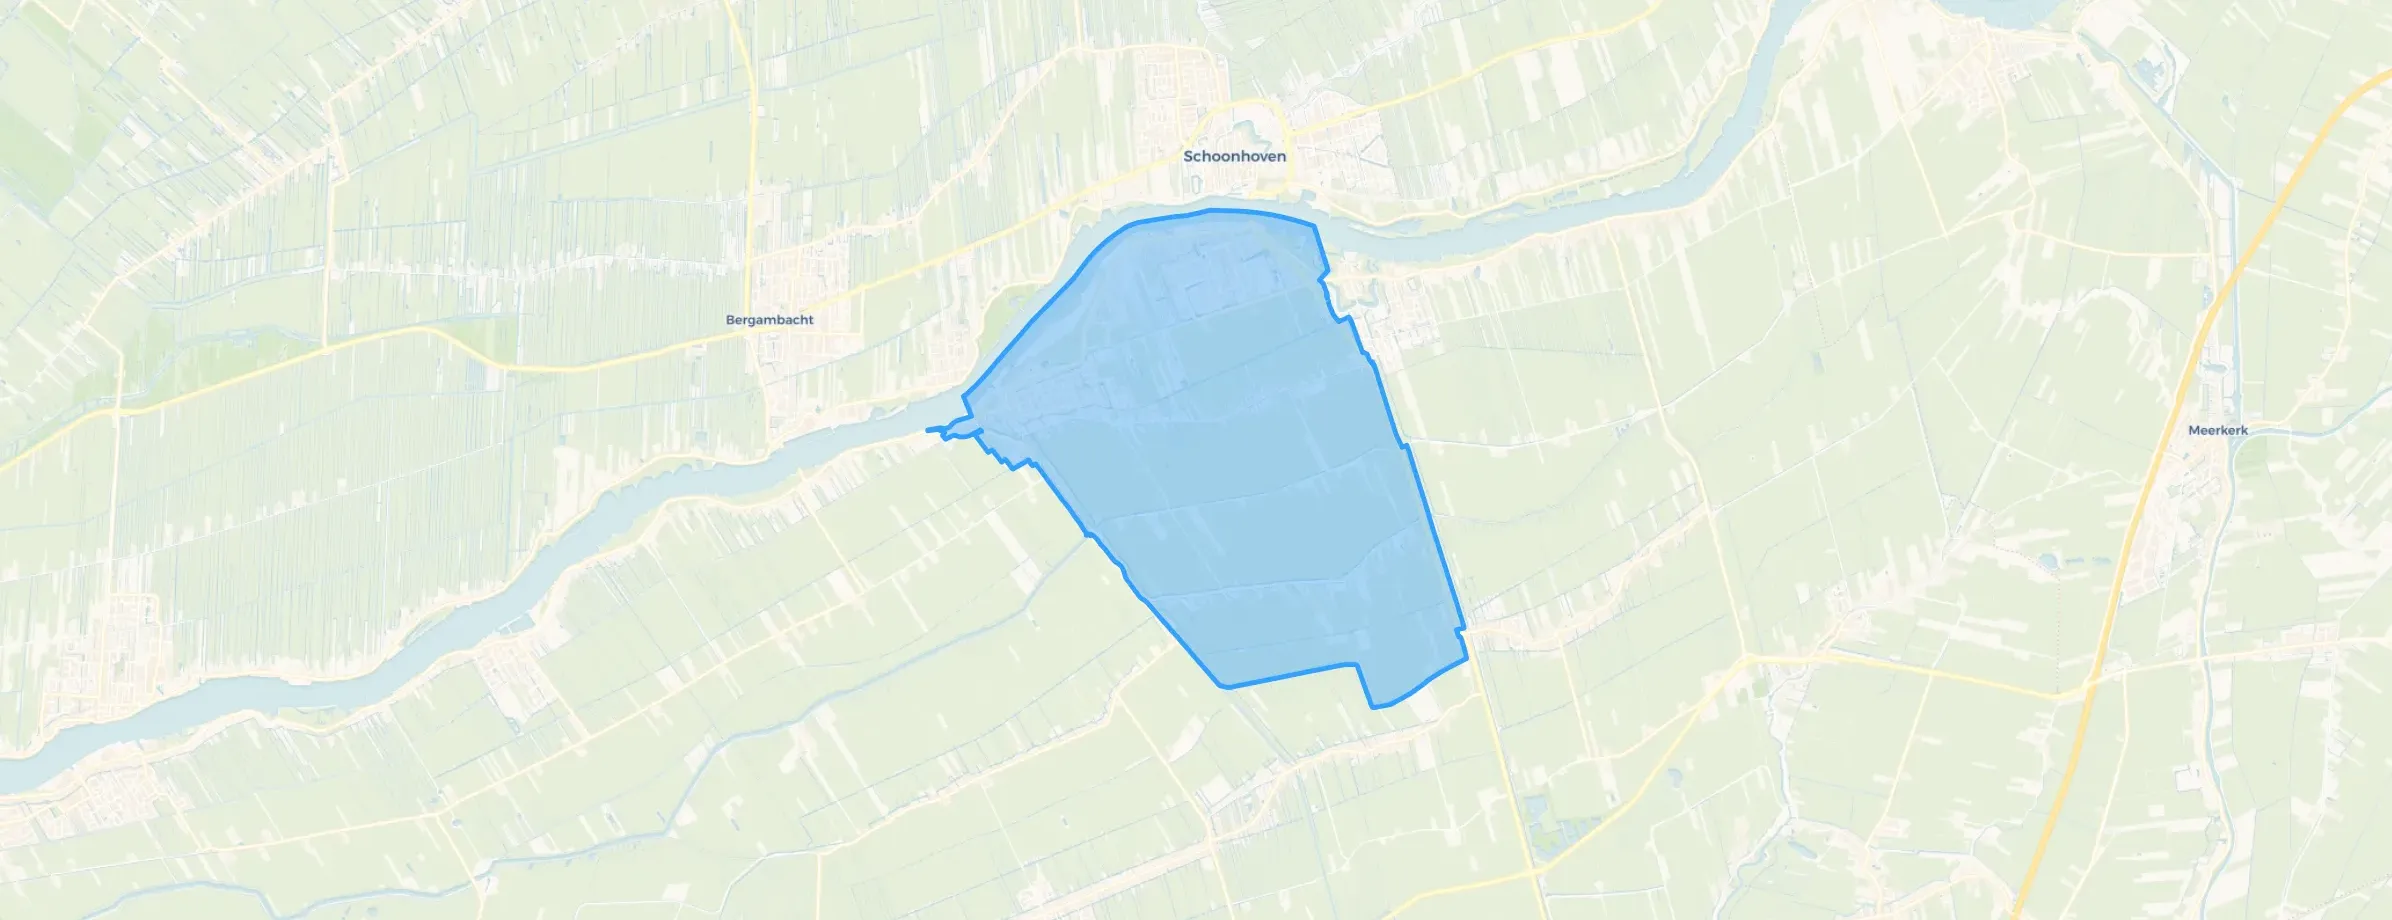
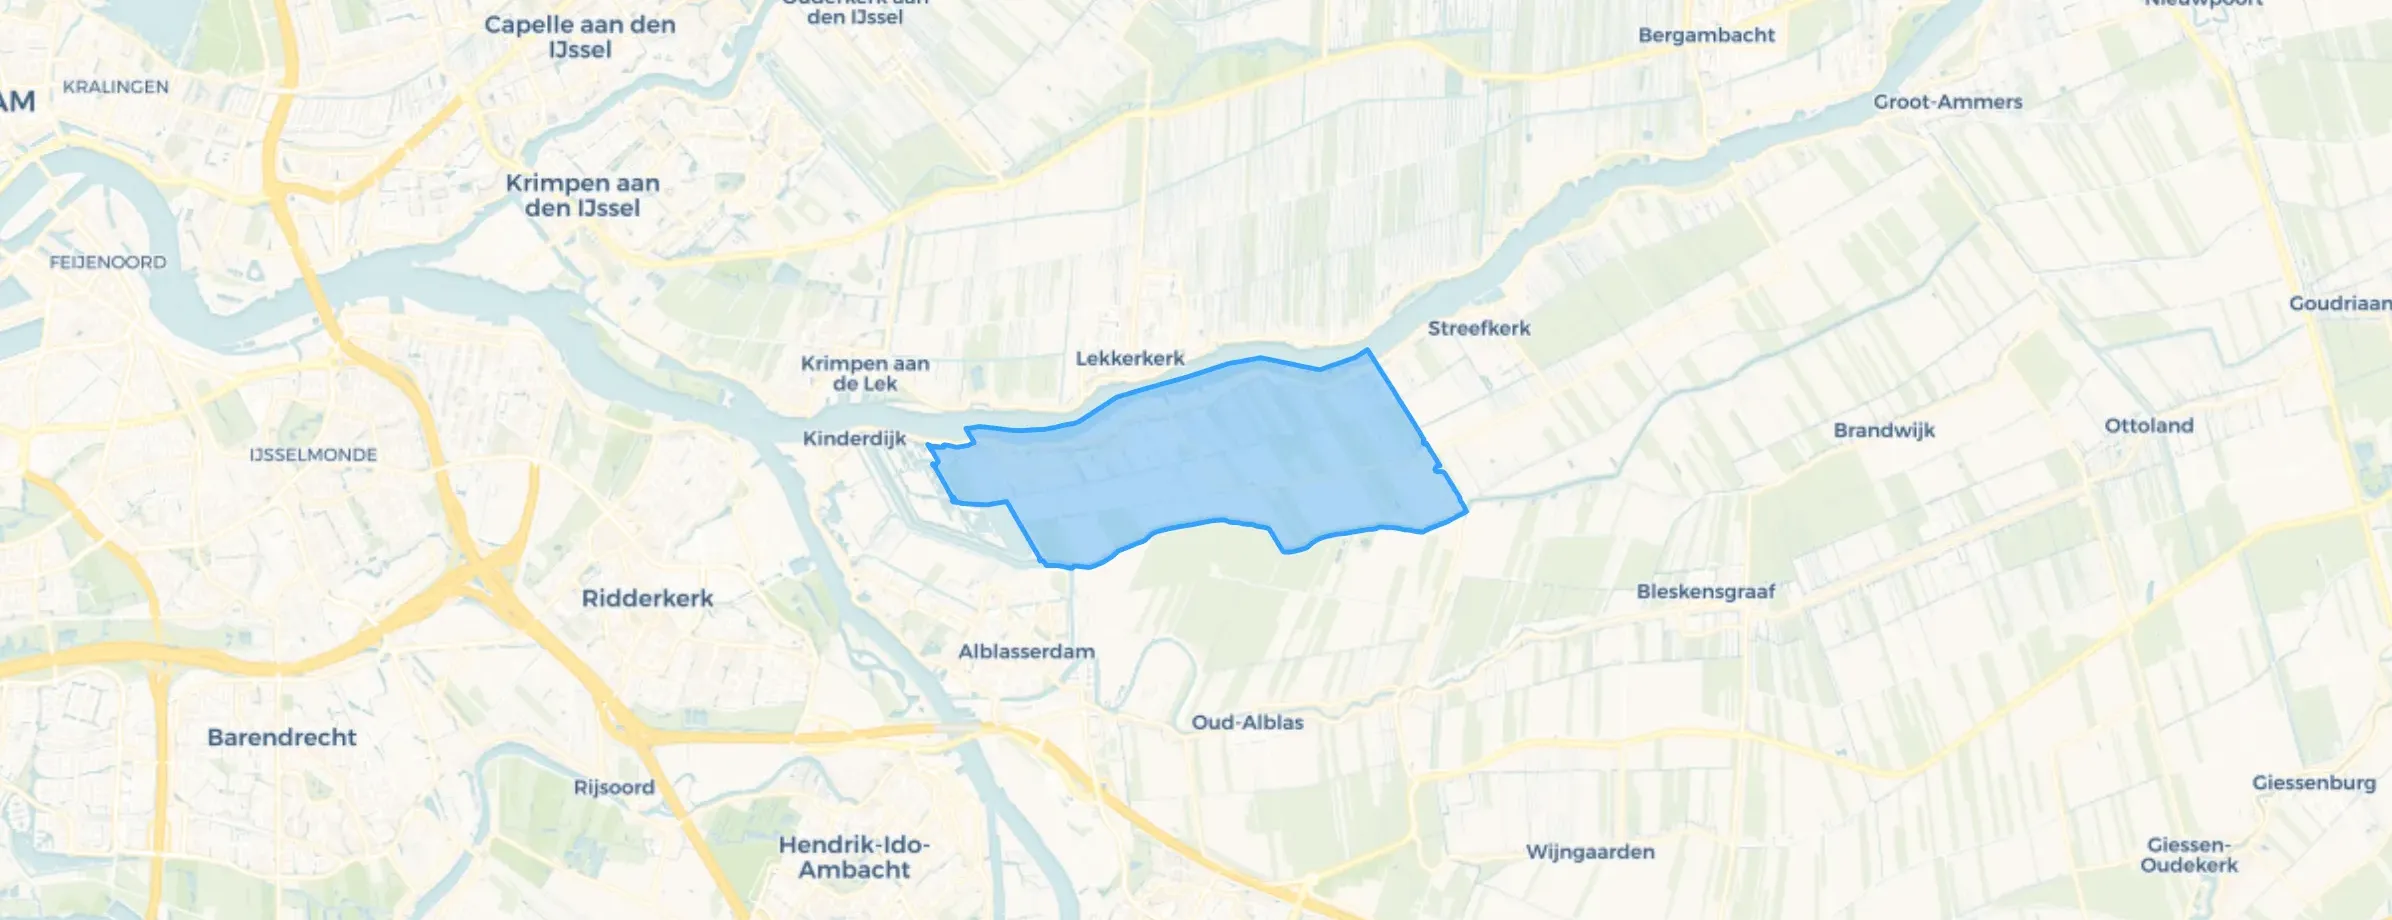
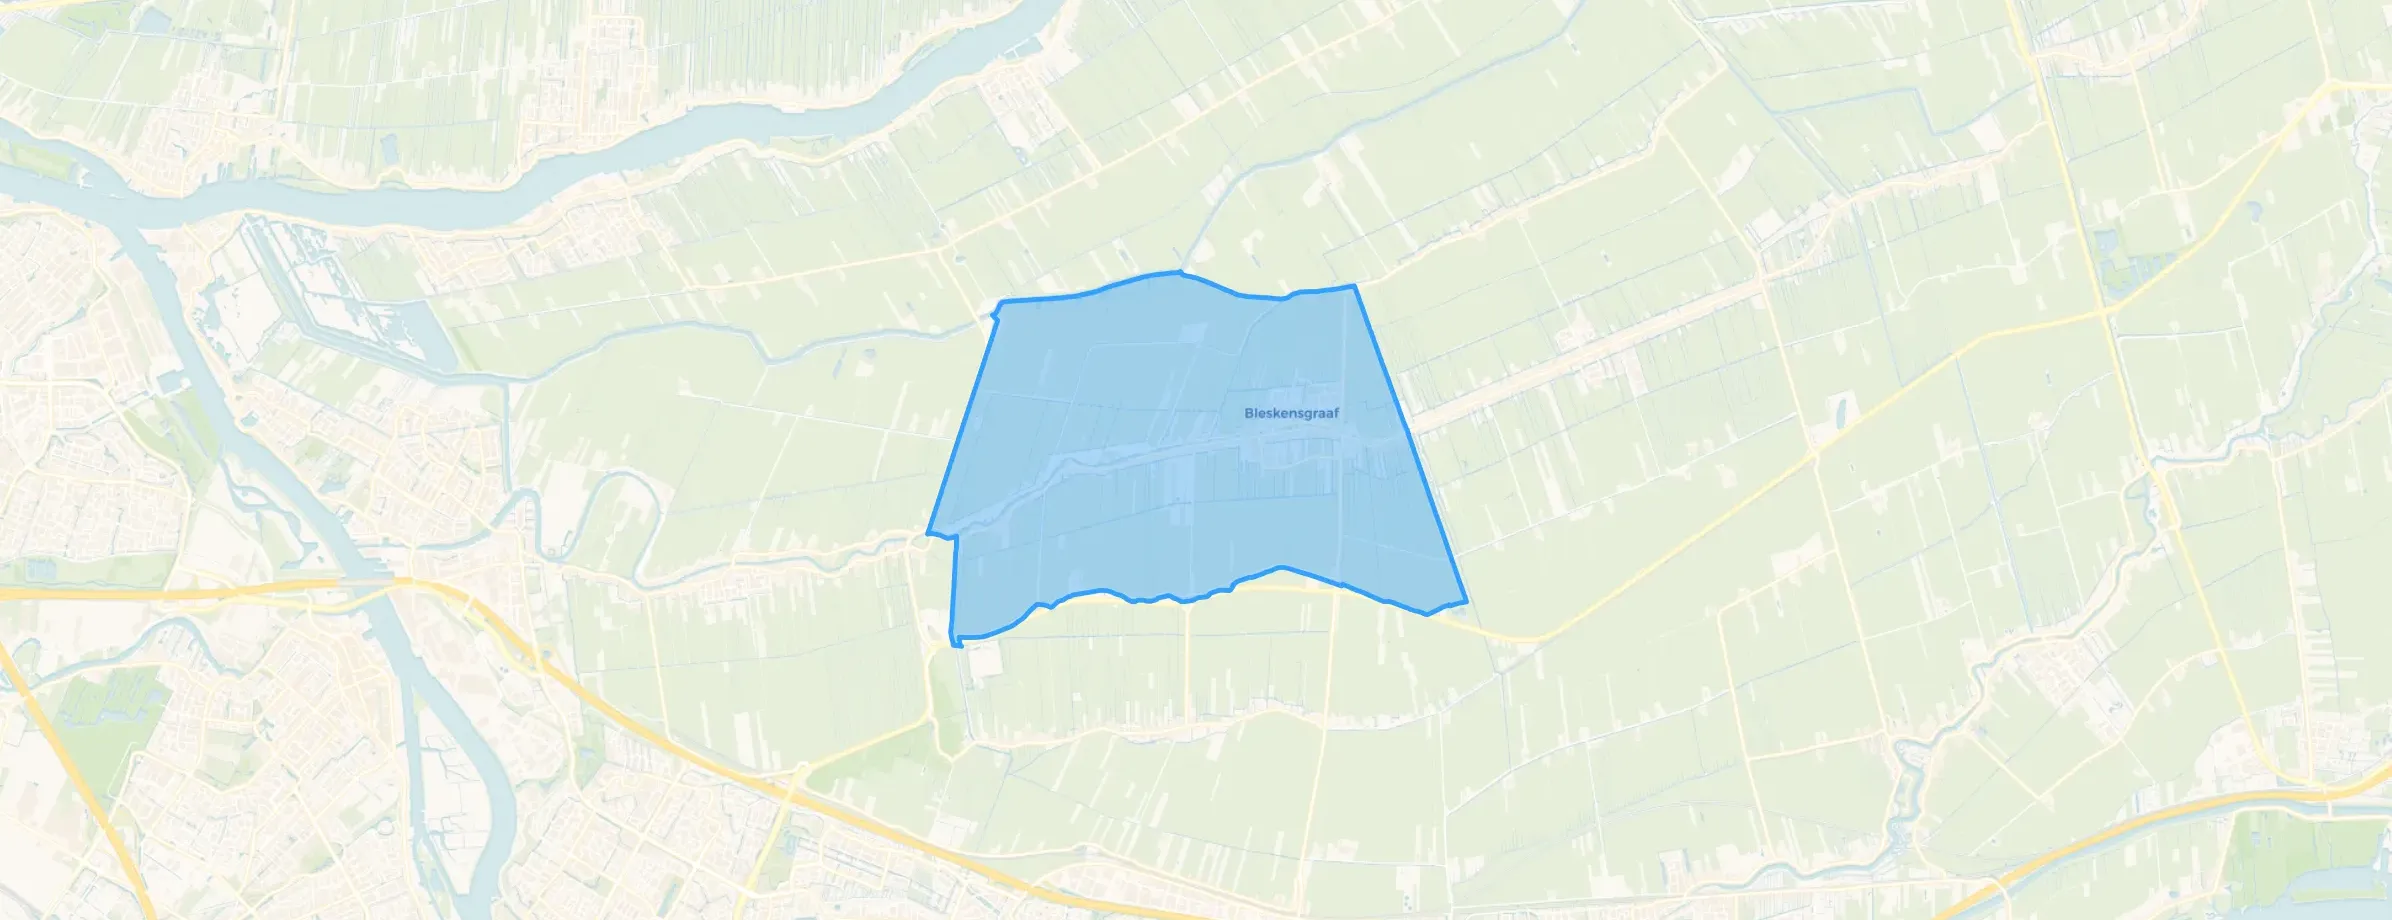
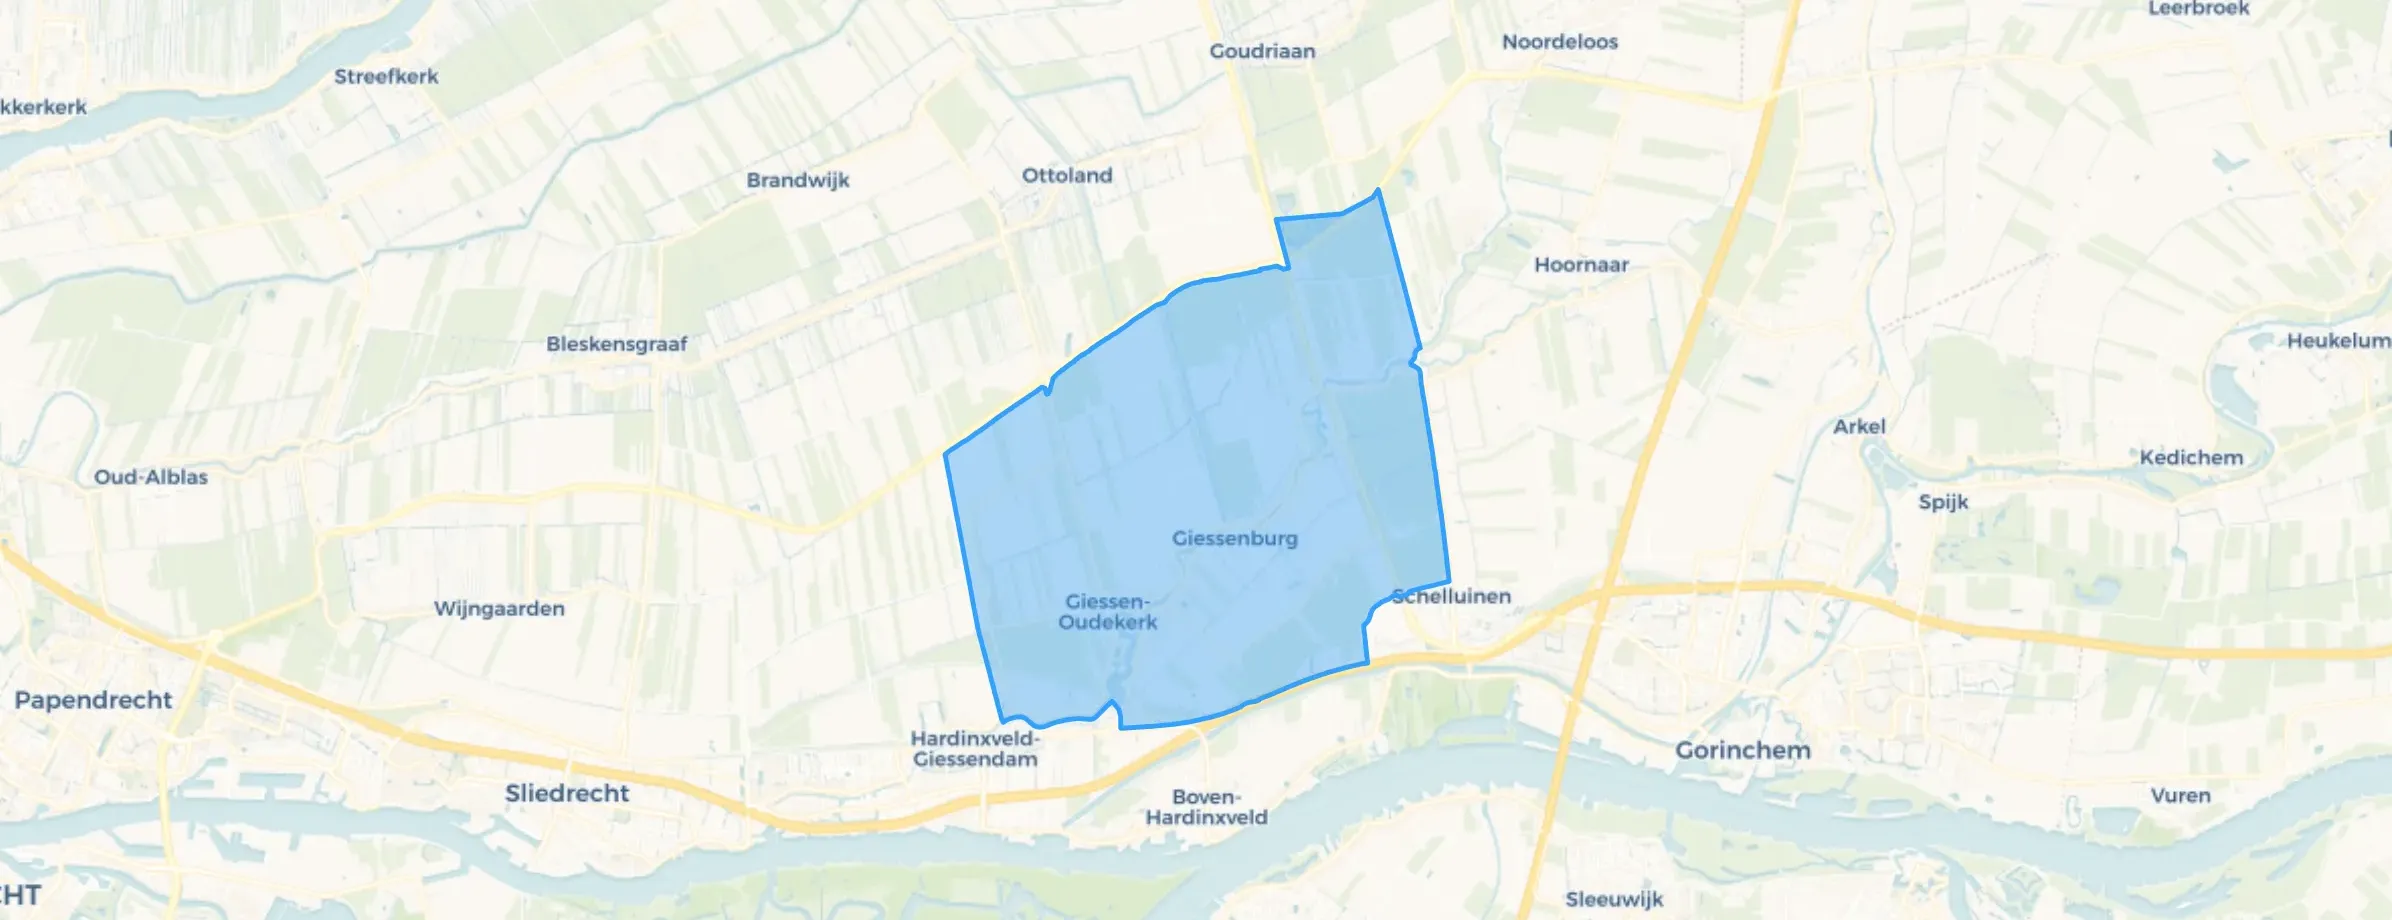
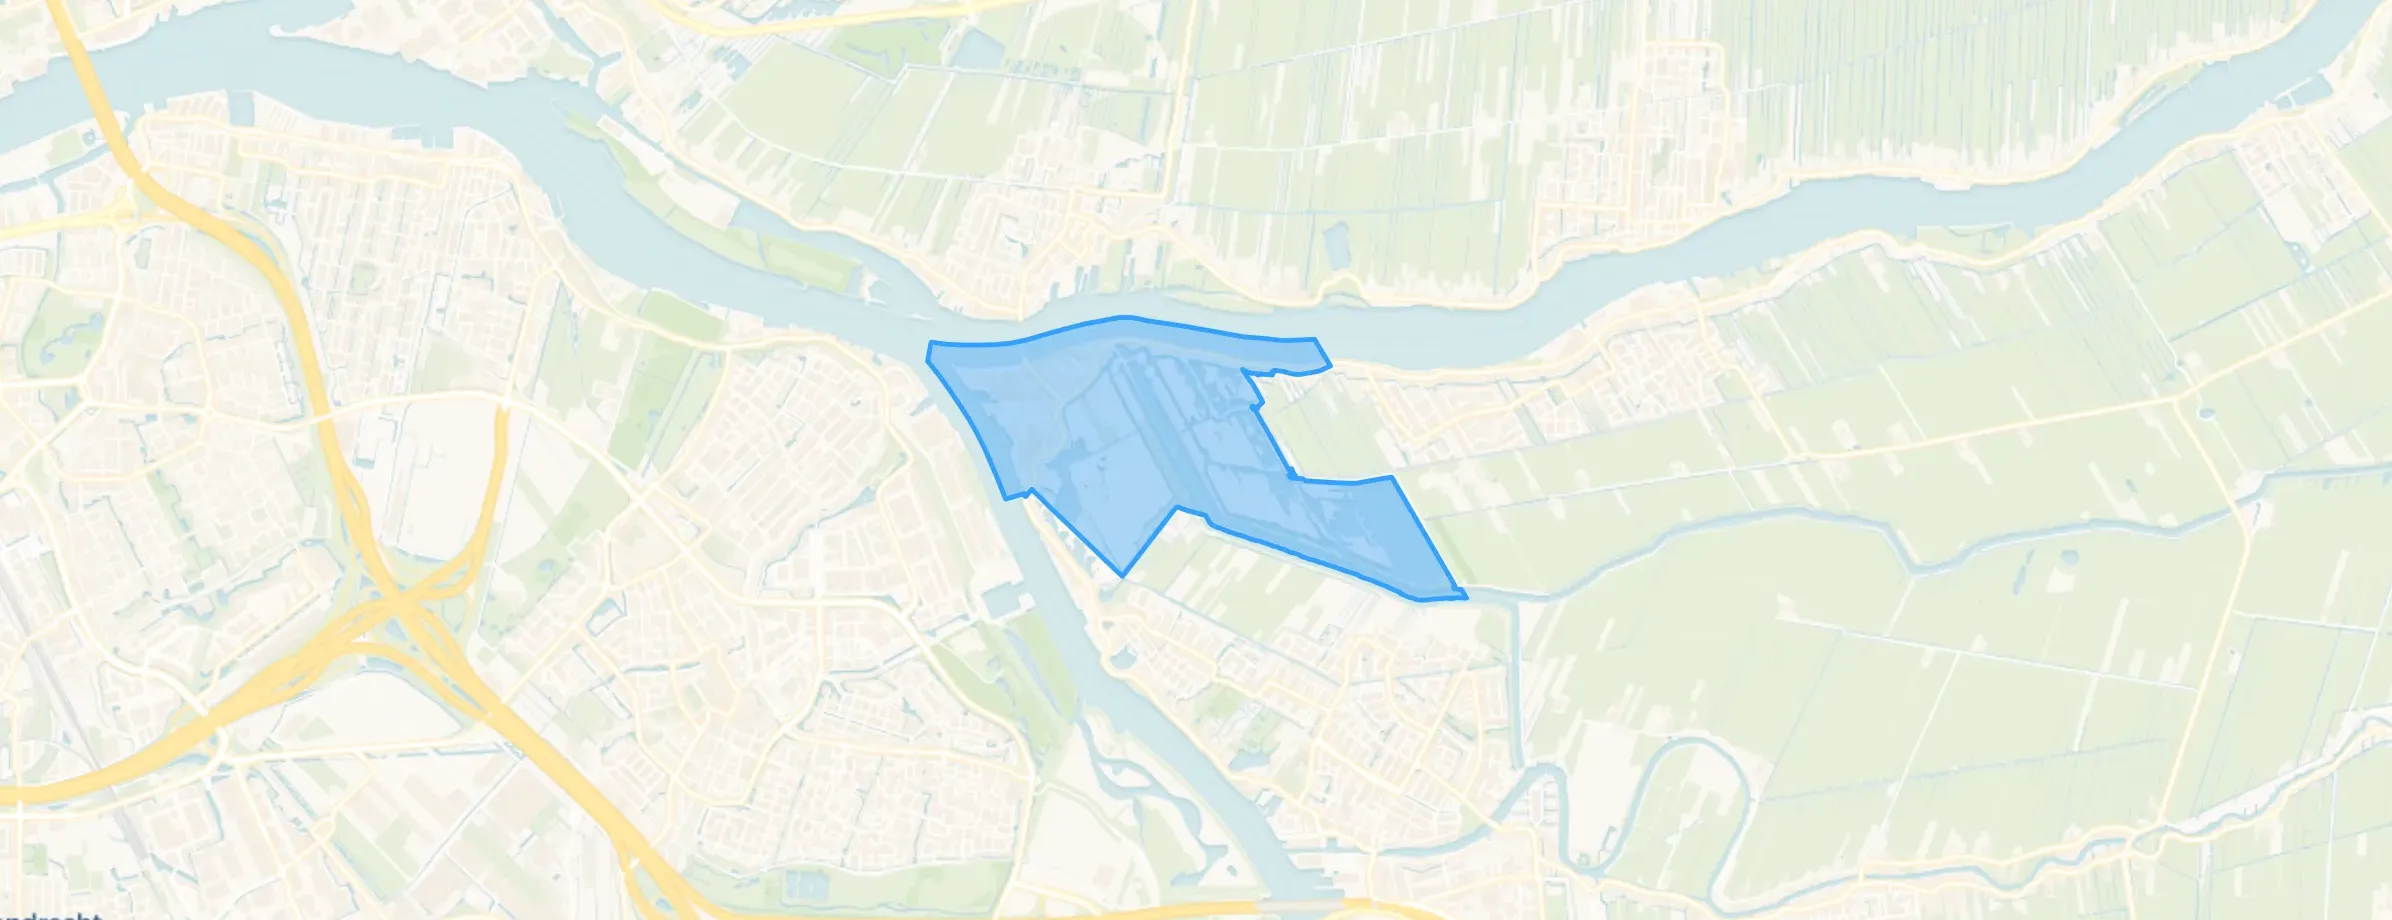
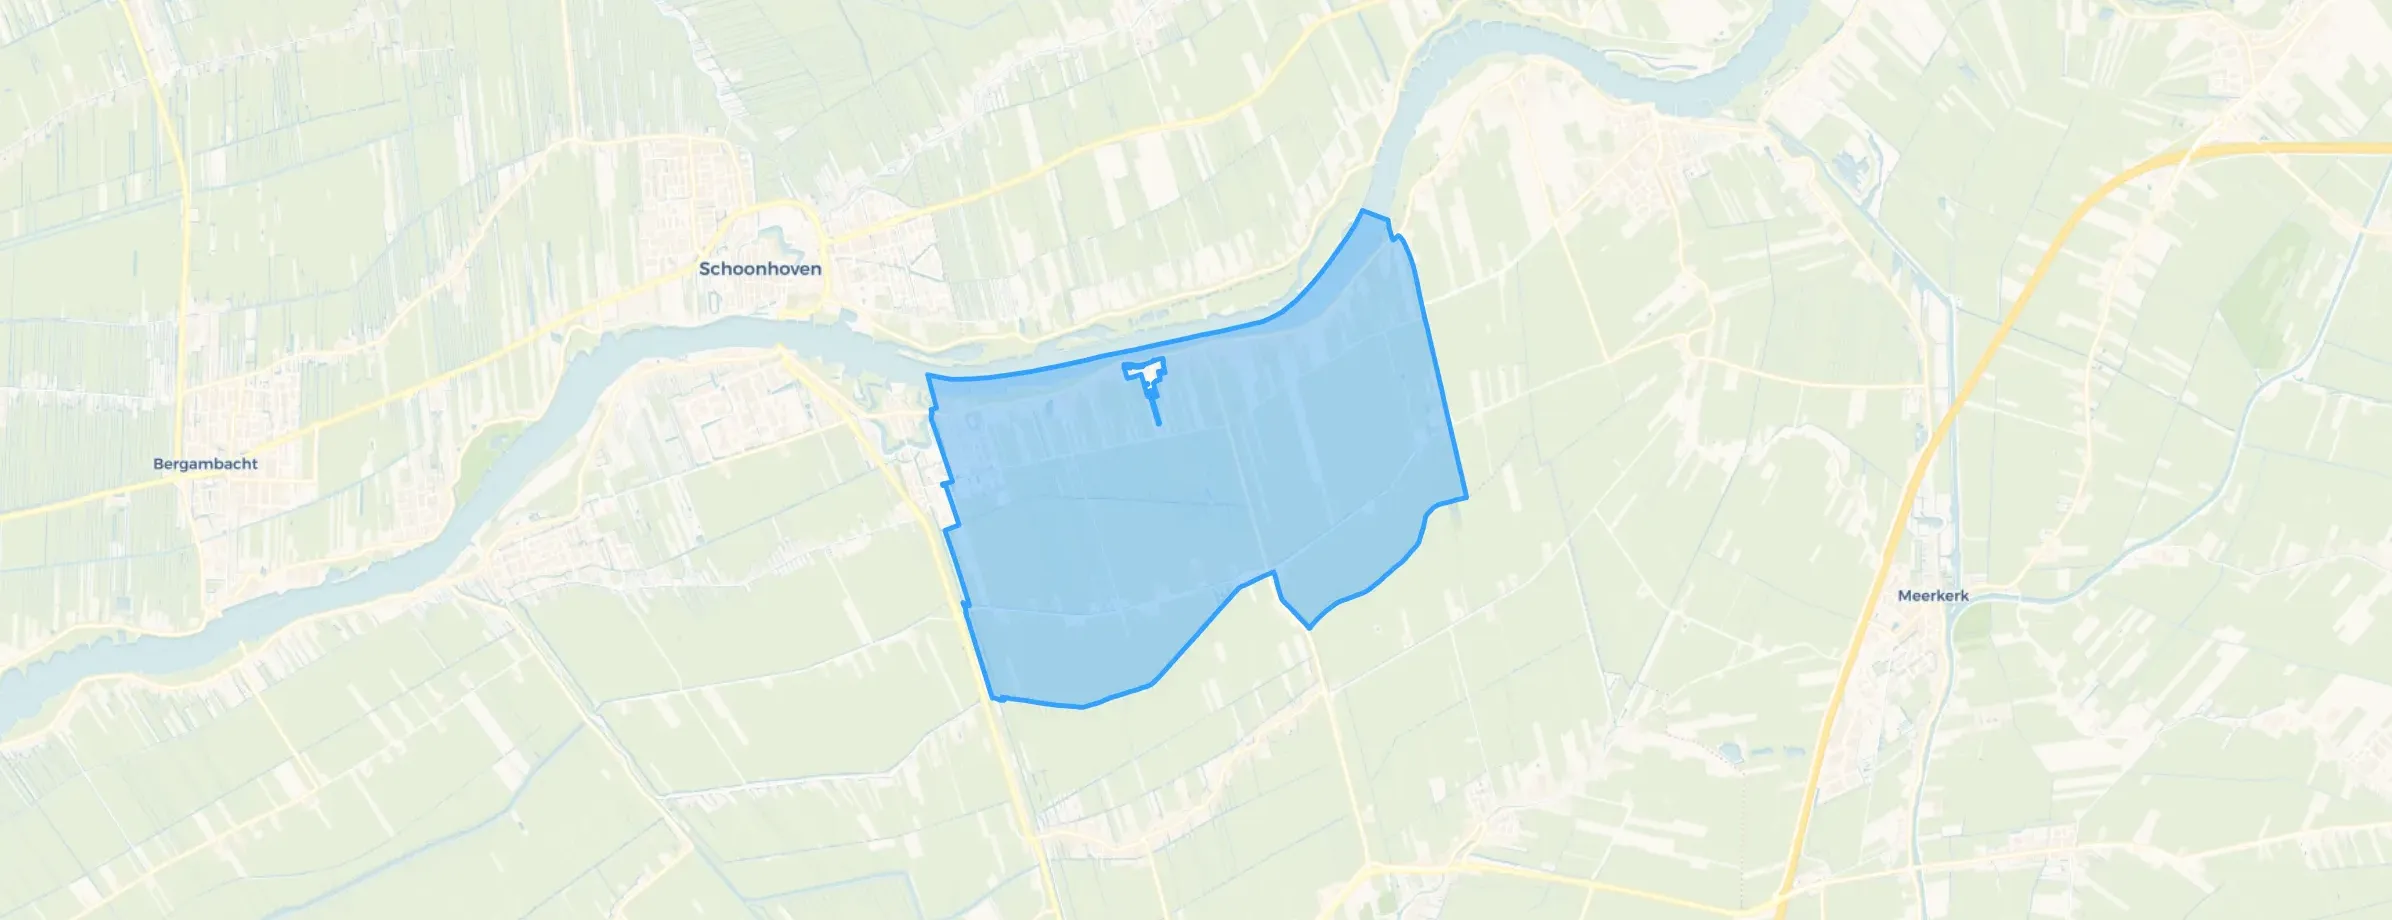
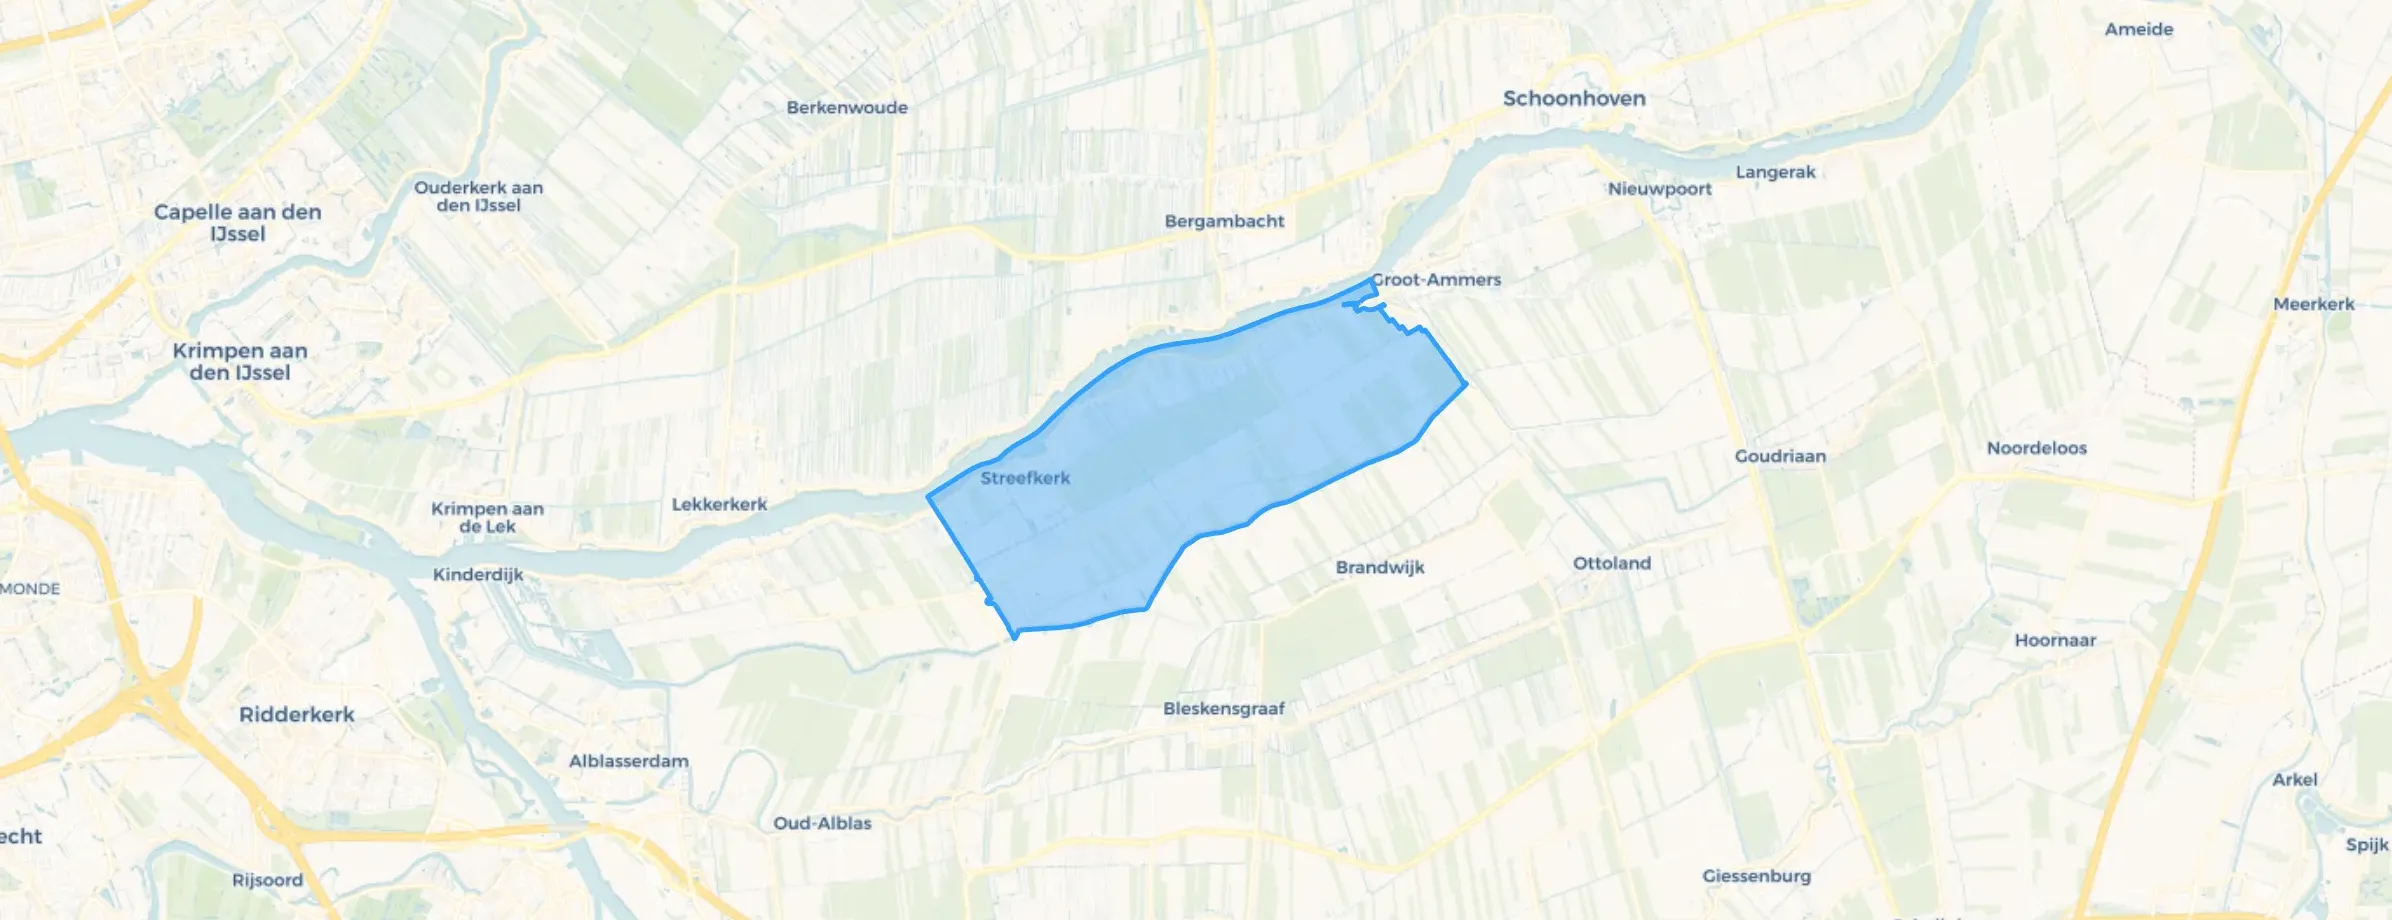
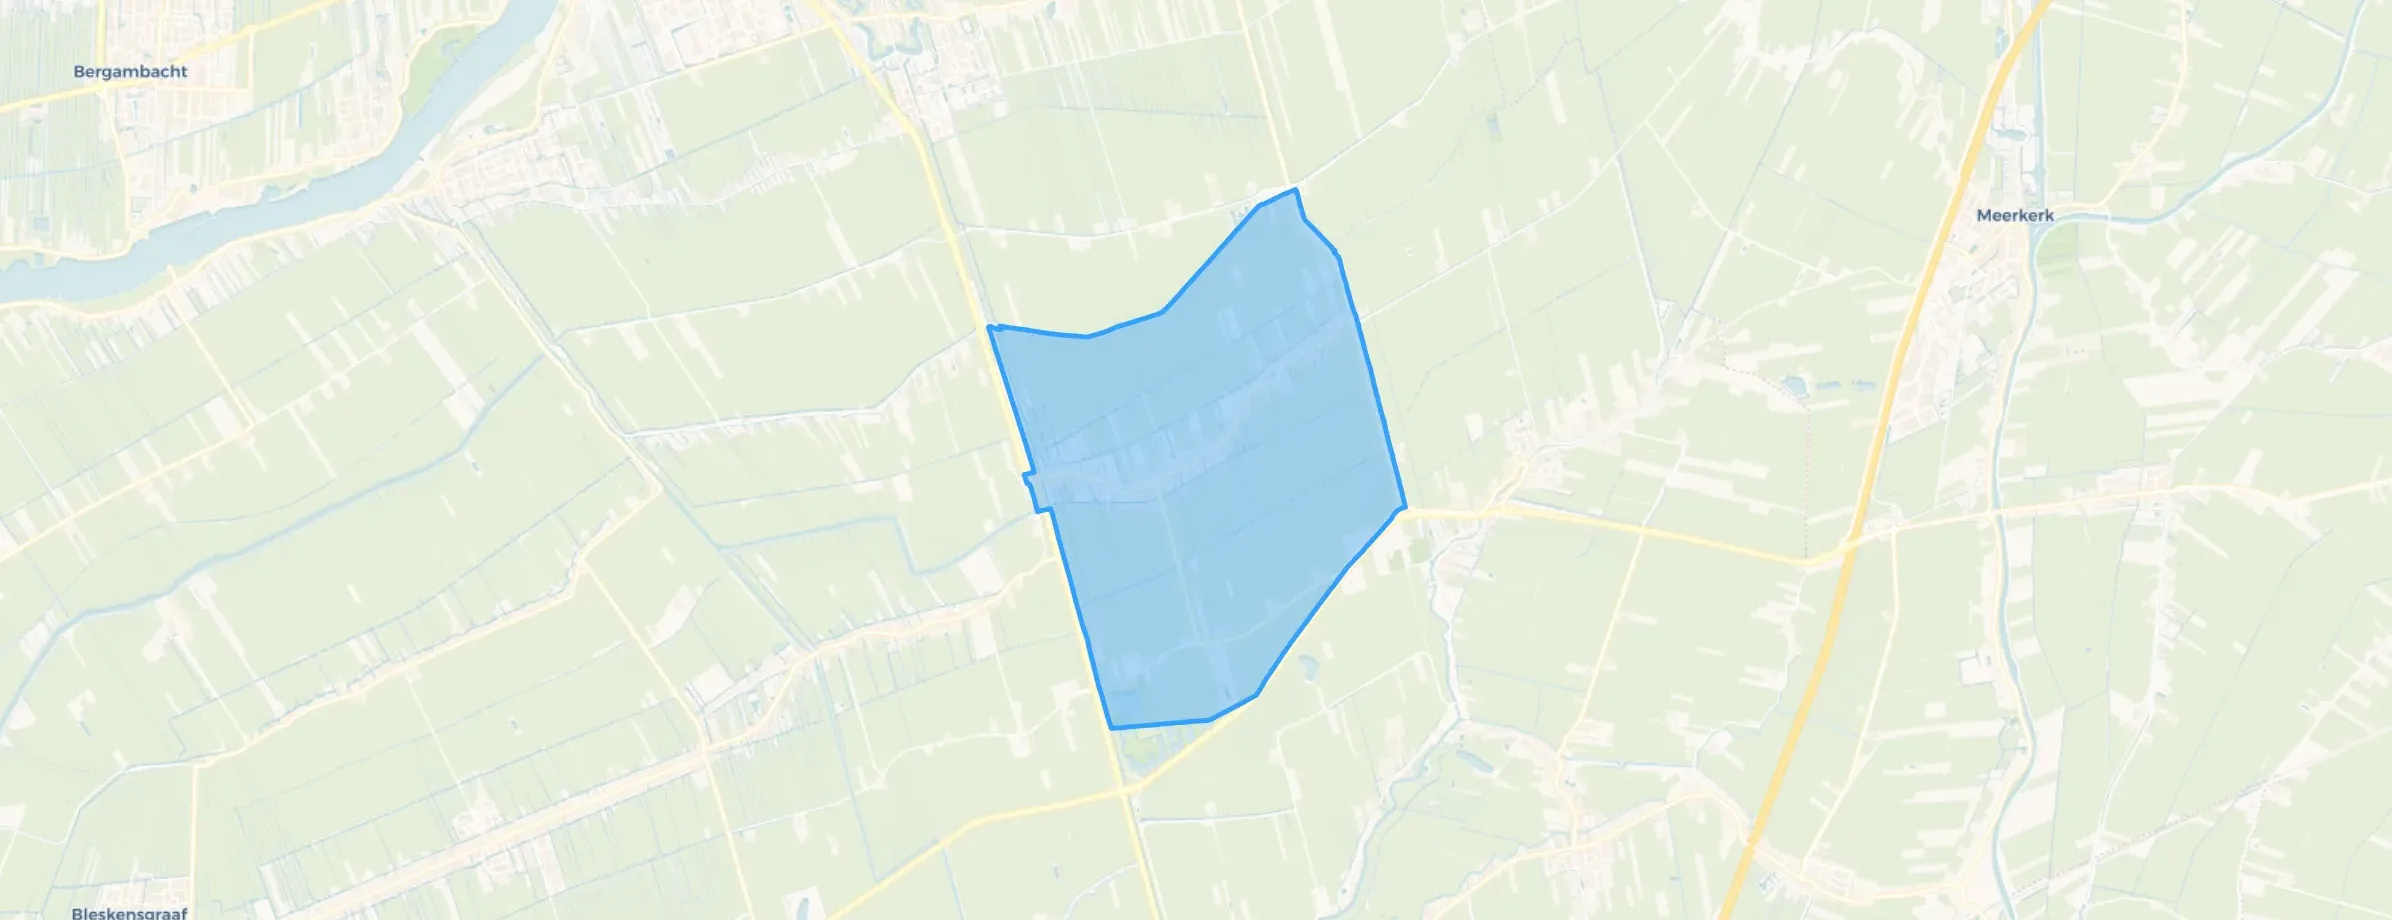
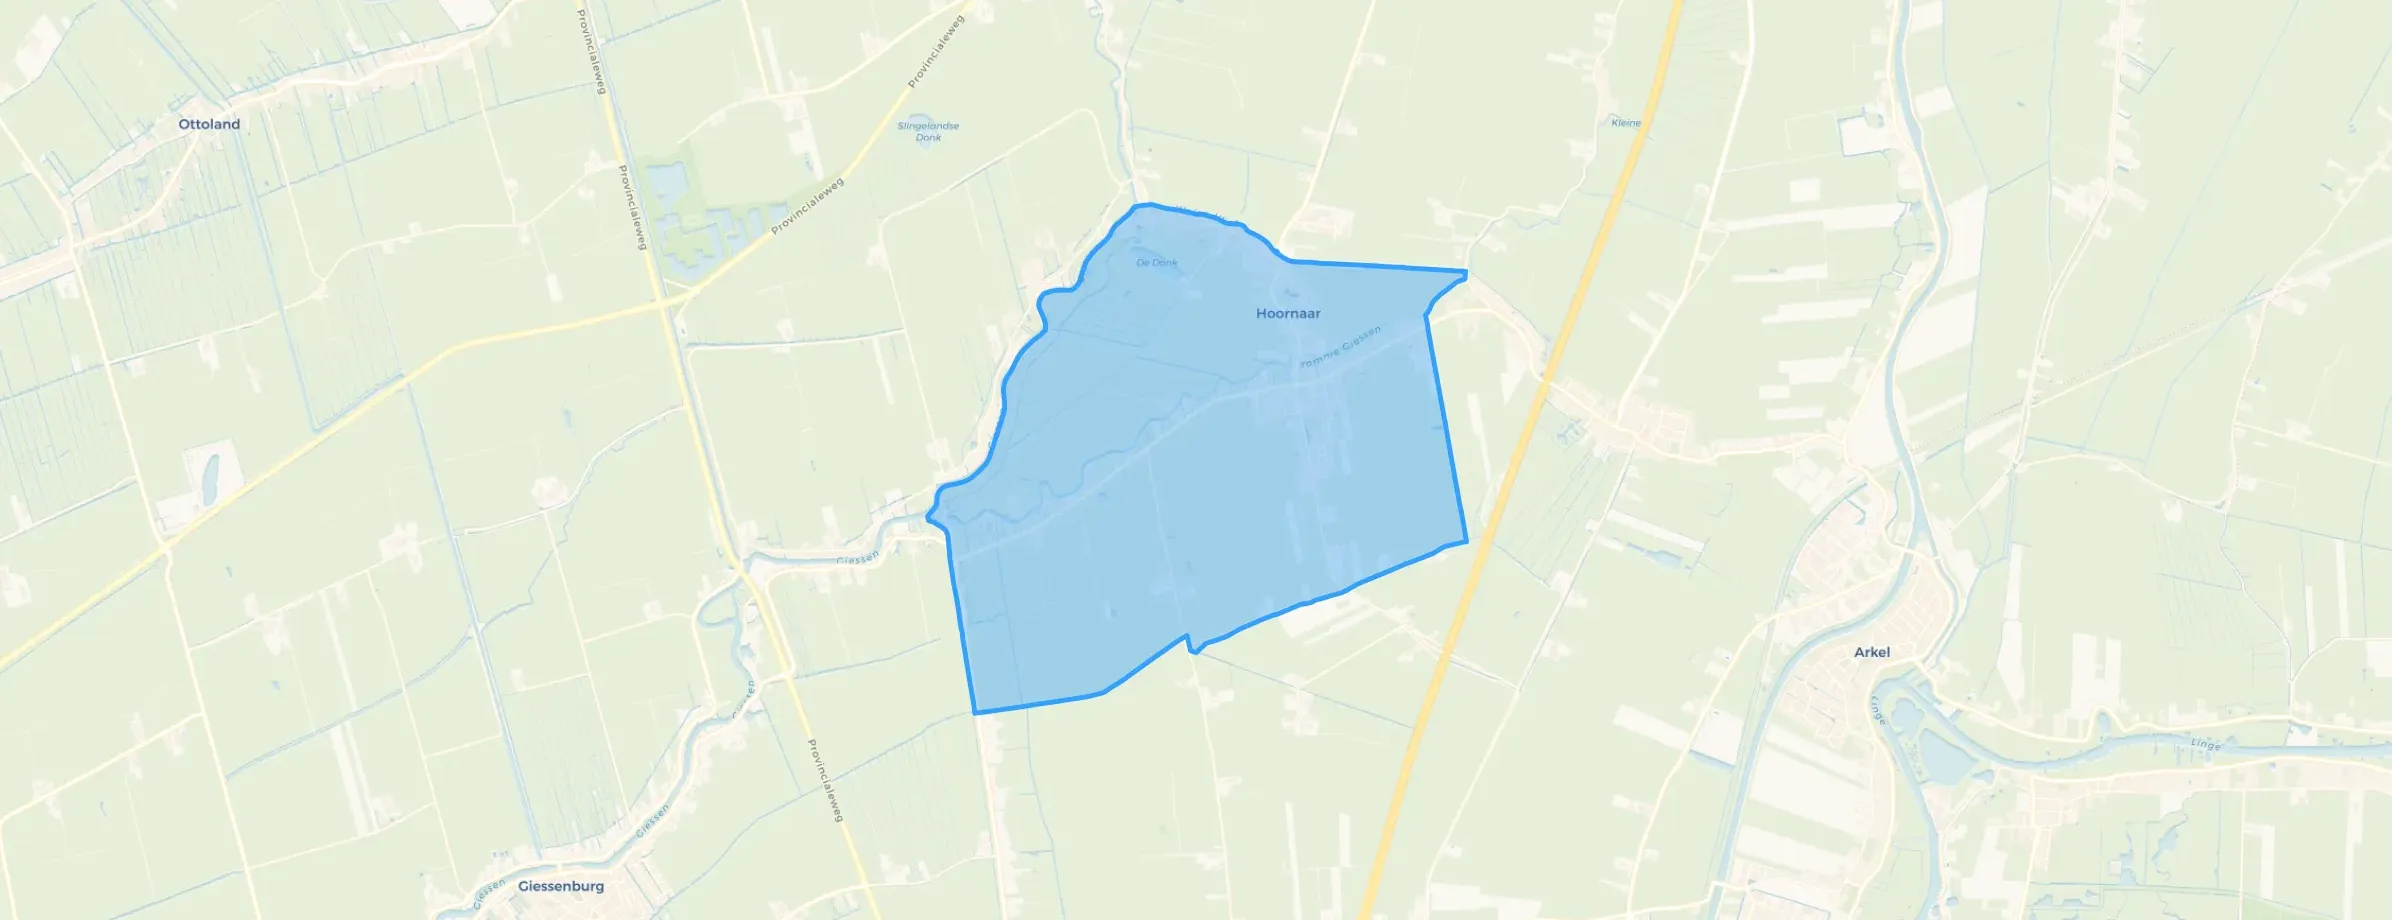
Molenlanden is located in the province of Zuid-Holland The municipality has a total area of 19.158 hectares, of which 18.157 hectares are land and 1.001 hectares are water. The municipality is coded as GM1978. The postcode area is 2957AA-4241XV.
Molenlanden has 45.363 residents. Of these, 50,4% are men and 49,6% are women. Most residents are 45 to 65 years (26,0%). The other age groups are 22,7% for '25 to 45 years', 20,4% for '65 years or older', 17,5% for '0 to 15 years' and 13,4% for '15 to 25 years'. Of the residents, 43,6% is unmarried, 46,6% is married, 5,0% is divorced and 4,7% is widowed. 40.903 residents originate from the Netherlands, 1.929 come from Europe and 2.531 come from countries outside Europe.
There are 17.718 households in Molenlanden. 27,1% of these are single-person households, 32,0% households without children and 40,9% households with children. The average household size is 2,5 persons. The national average is 2,1 persons.
In Molenlanden there are 36.100 income recipients. The average income per income recipient is €42.600, which is €400 (1%) higher than the national average of €42.200. Per resident, the average income is €34.300, which is €600 (2%) lower than the national average of €34.900. Most residents of Molenlanden are educated to an intermediate level. 51,5% have an intermediate education (HAVO, VWO or MBO 2-4), 26,1% have a lower education (VMBO or MBO 1) and 22,3% have a university or higher professional education (HBO/WO).
Of the 45.363 residents, around 78% are in paid employment, which amounts to 35.383 people. This is 6% higher than the national average of 72%. The majority of workers are in salaried employment (80%), while 20% are self-employed. In Molenlanden, 23% of residents receive a benefit. The largest group is those receiving a state pension (AOW). 8.230 people receive this benefit.
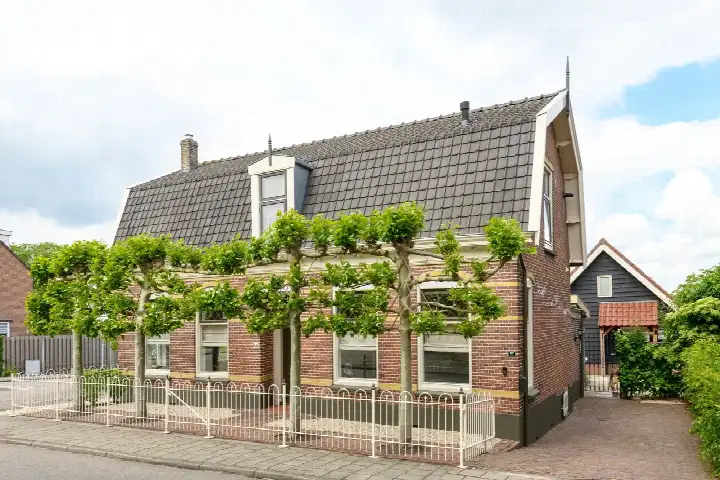
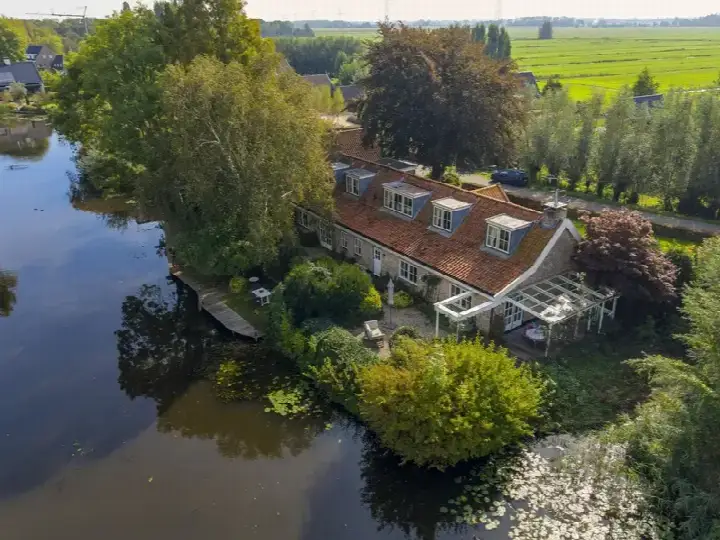
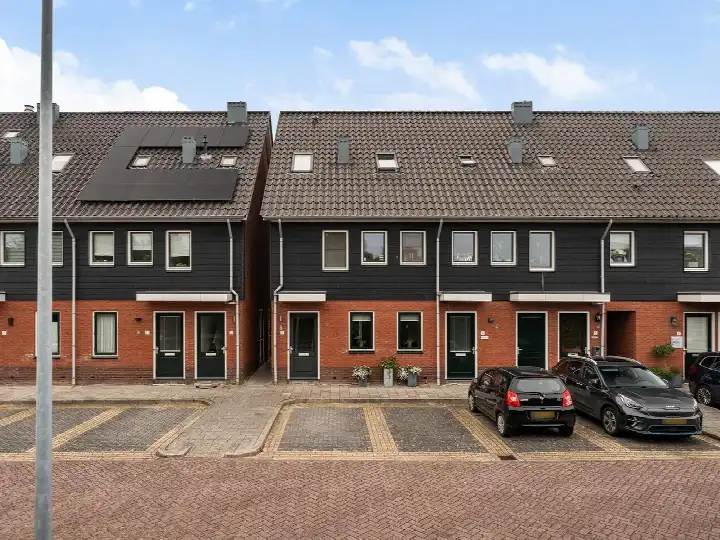
In Molenlanden there are 18.111 homes with an average assessed value (WOZ) of €427.000. Of these, around 96% are occupied and 4% unoccupied. Most homes are owner-occupied. This amounts to 30% rental homes and 70% owner-occupied homes. Of the homes, 69% privately owned, 25% owned by housing associations and 6% owned by other landlords. The most common construction periods in Molenlanden are 1950-1970 (21%) and 1970-1980 (18%).
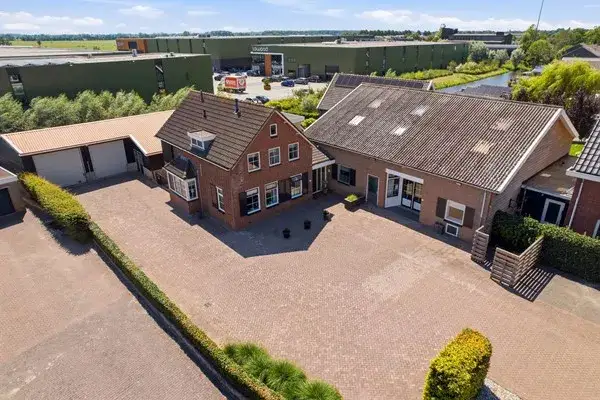
There are currently no homes for sale in Molenlanden. The most recently listed home is Gijbelandsedijk 66 by Kool & Van den Toren Makelaardij op Funda. No homes were sold in Molenlanden over the past year.
There are currently no homes for rent in Molenlanden. The most recent home is Dokter H. de Vriesplein 25, offered by woningaanbod.woonzorg.nl. No homes were let in Molenlanden over the past year.
No recent rental data available for Molenlanden.
In Molenlanden there are 11.021 addresses with a registered energy label. The most common labels are A (29%), C (26%) and B (19%). On average, an address in Molenlanden uses 2.860 kWh of electricity per year. This is 12% above the national average of 2.550 kWh. Natural gas consumption, at 890 m³ per year, is 11% above the national average of 800 m³.



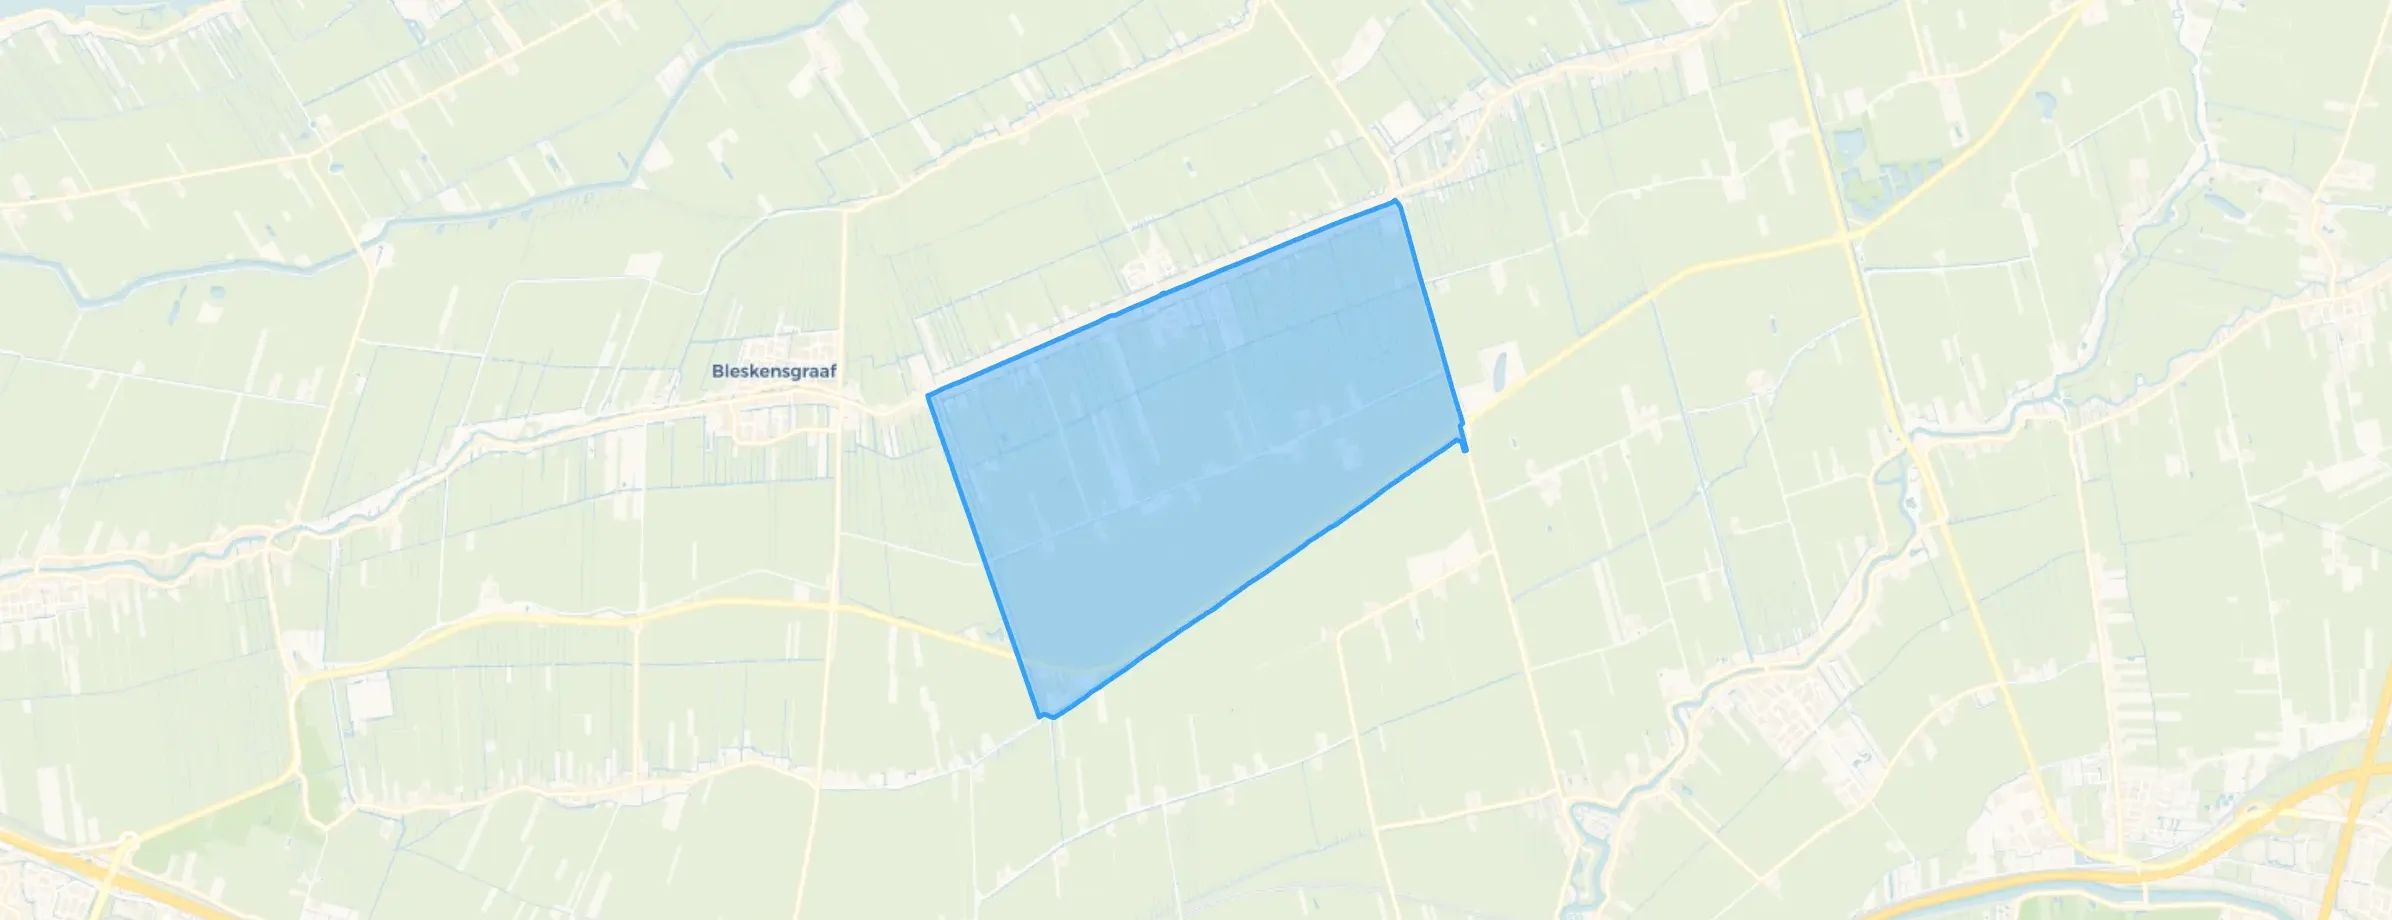
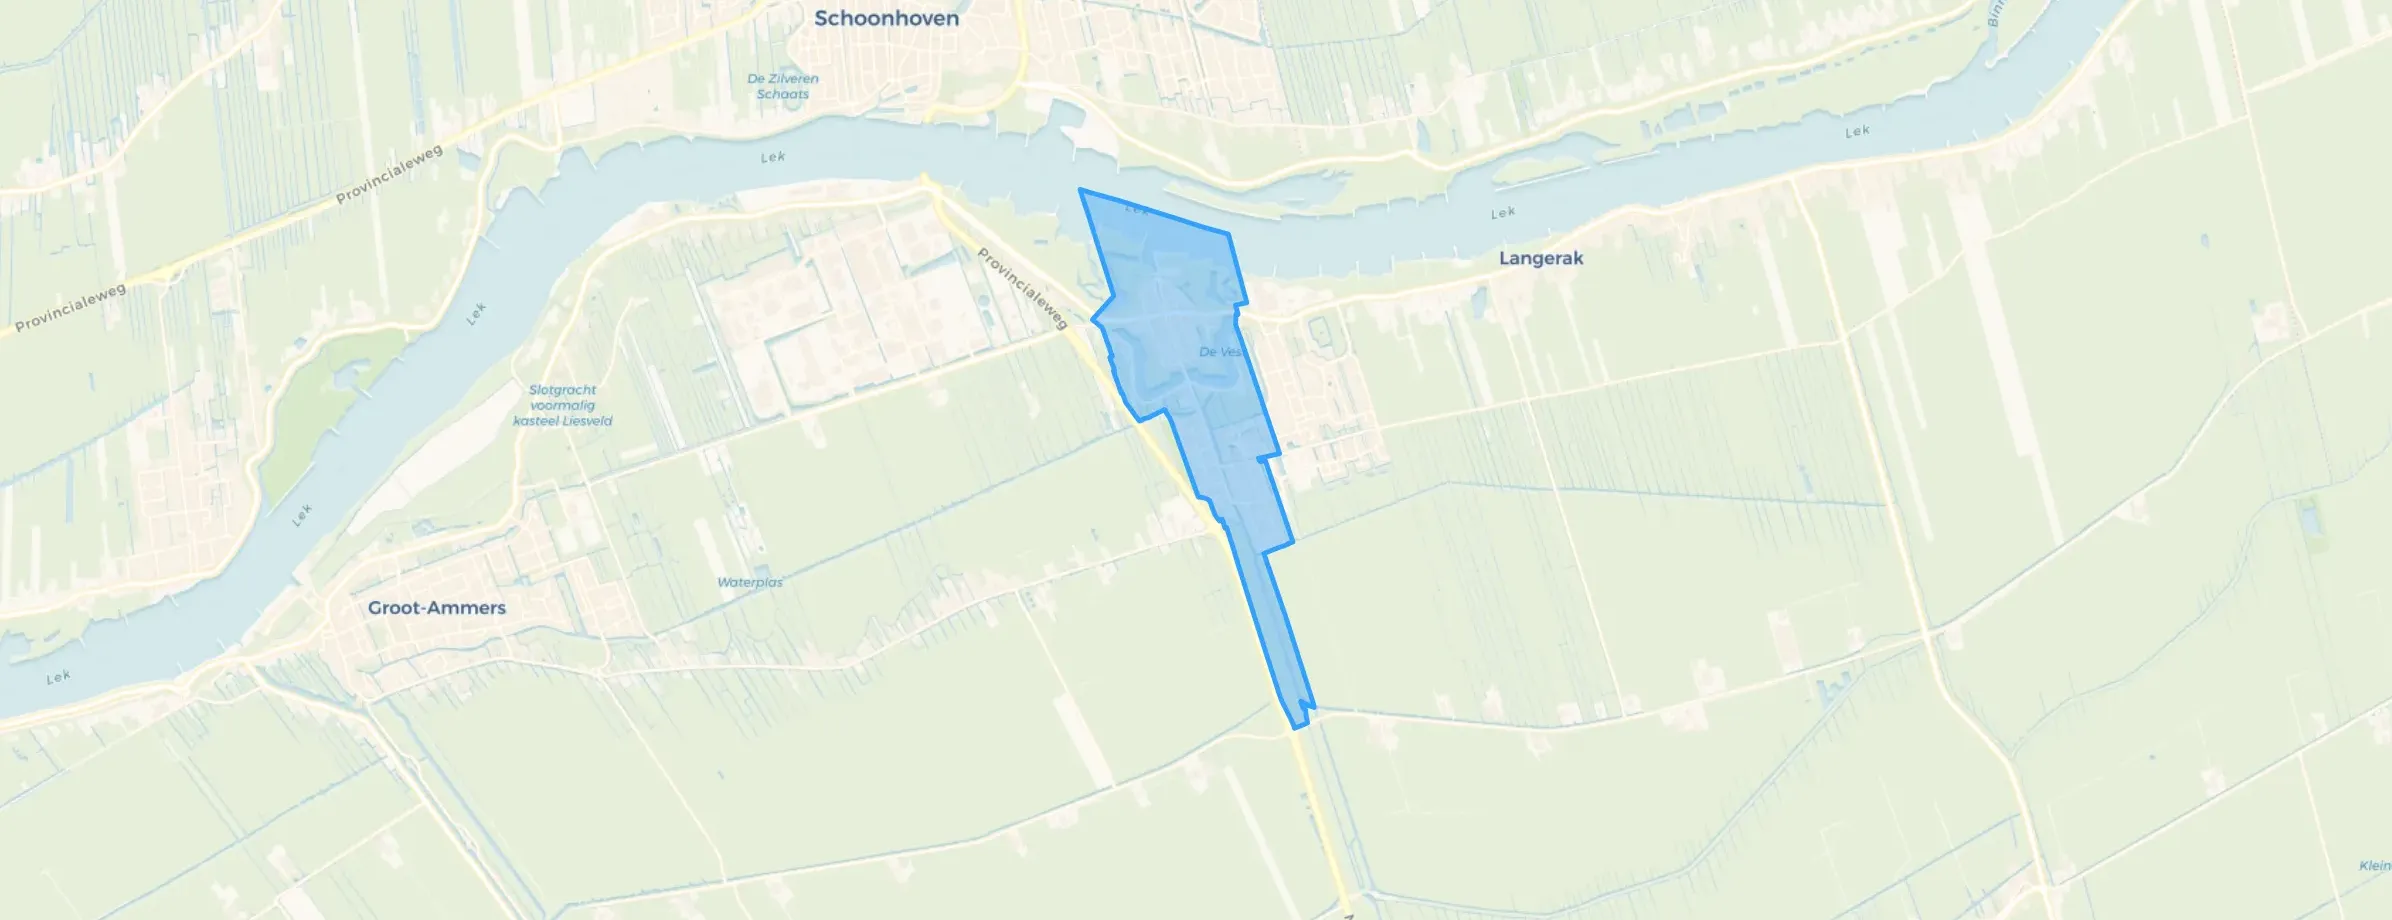
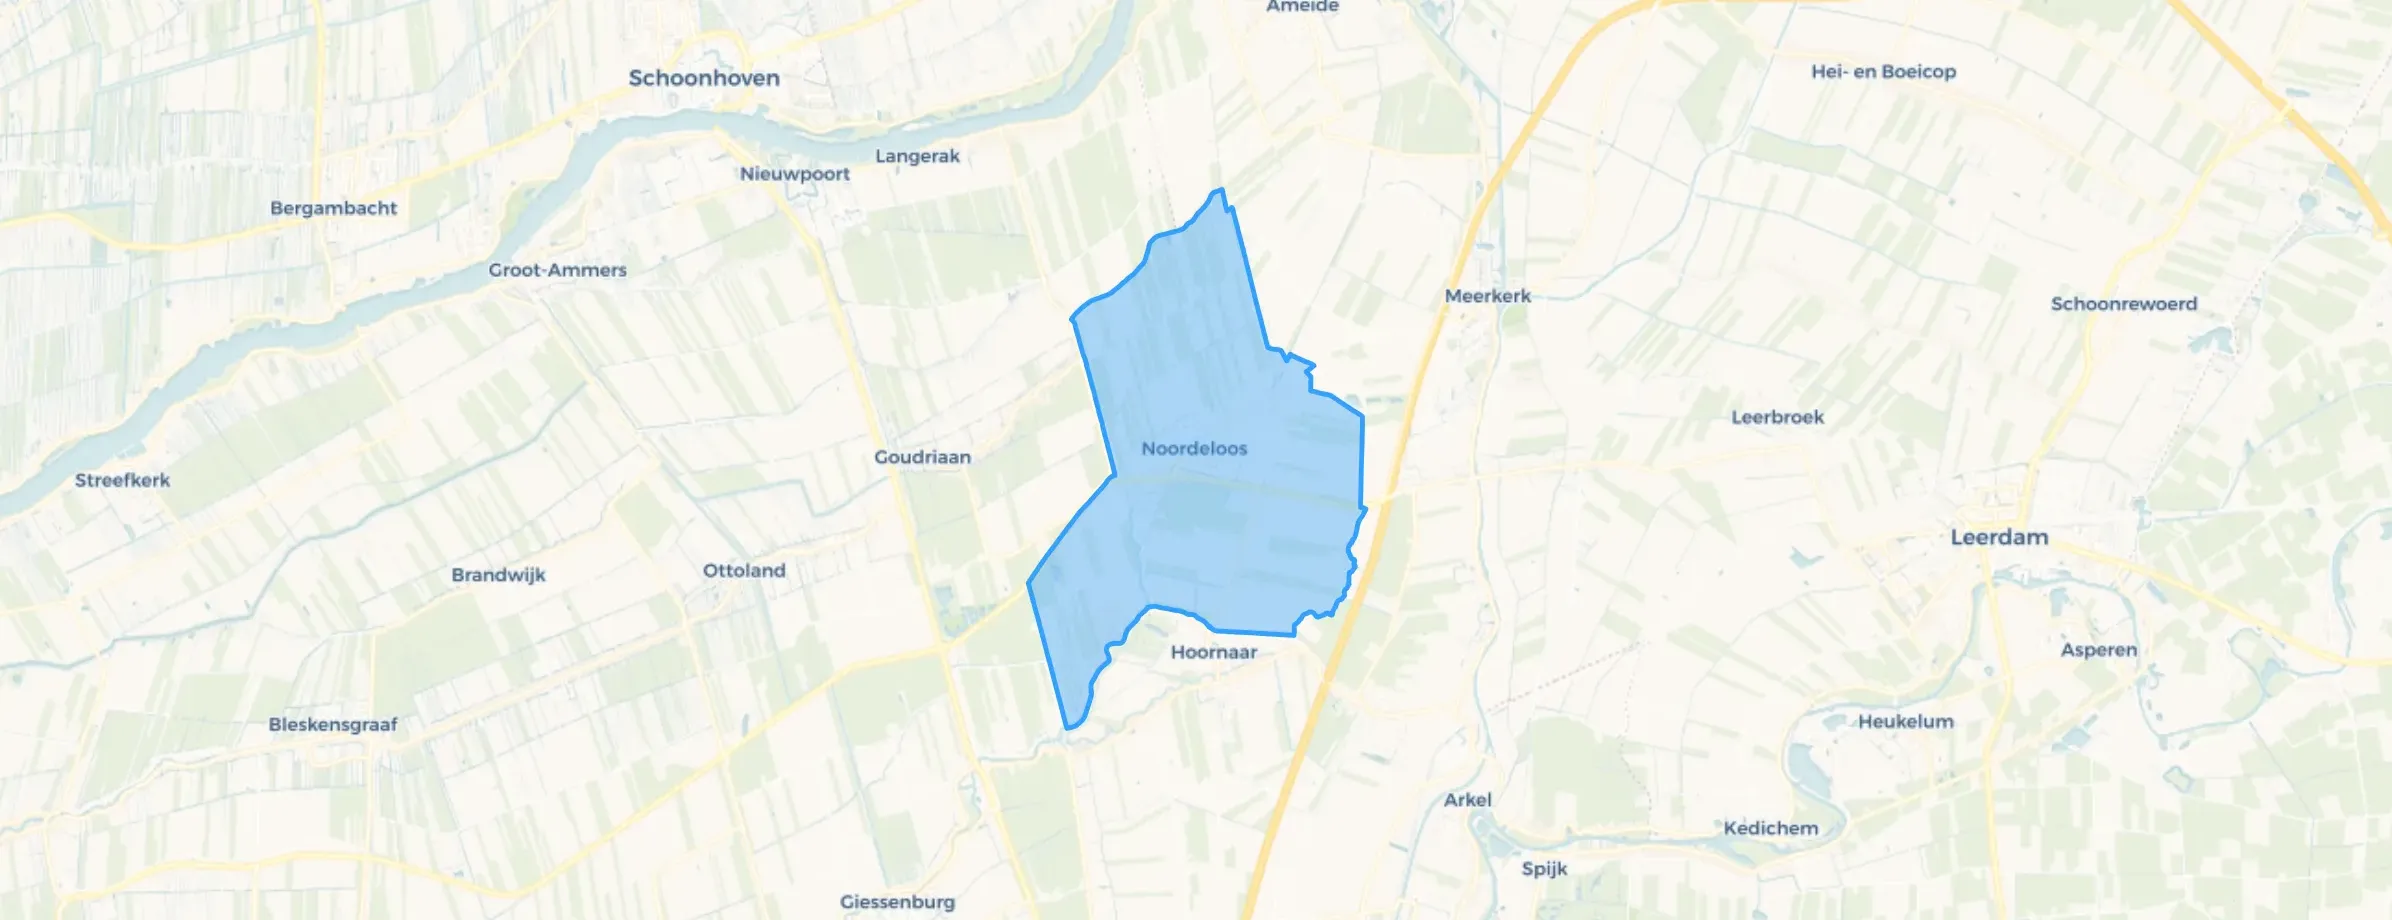
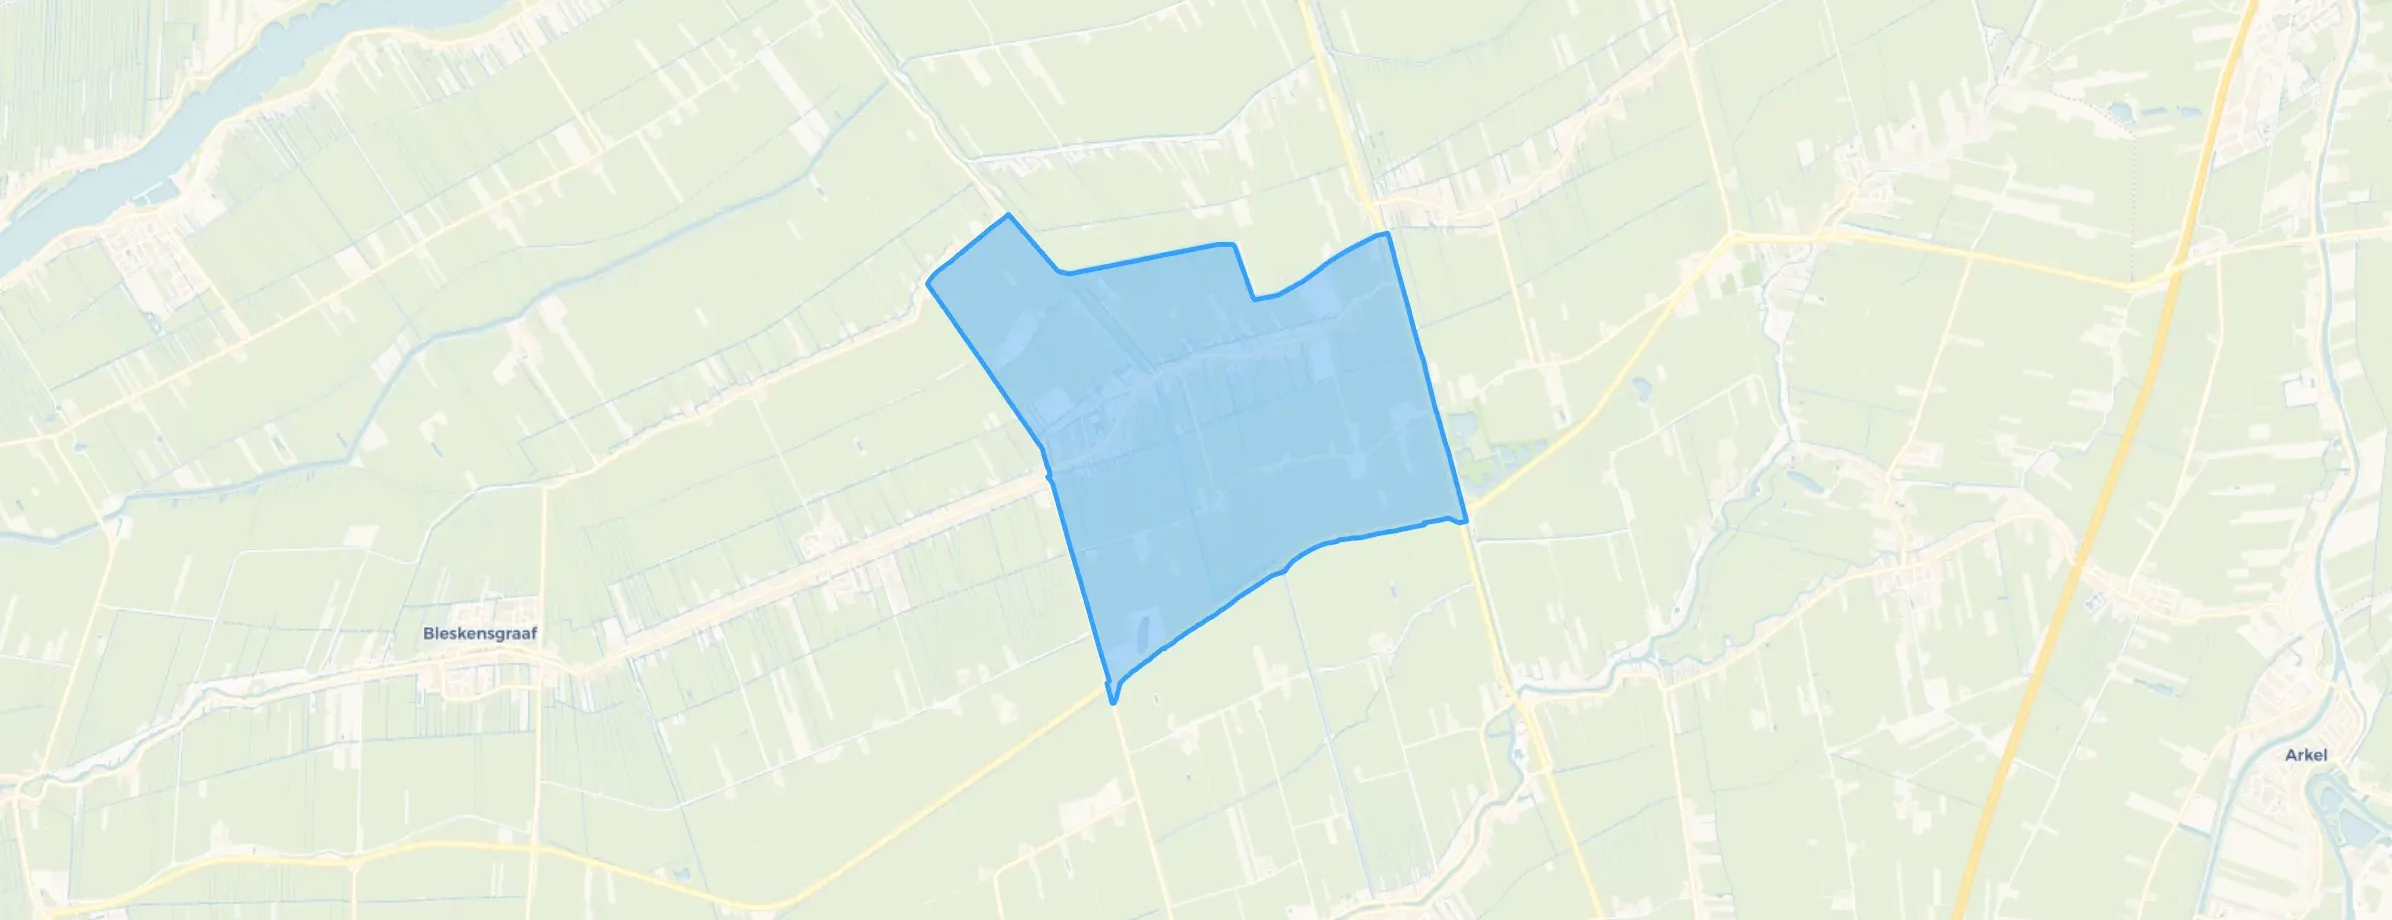
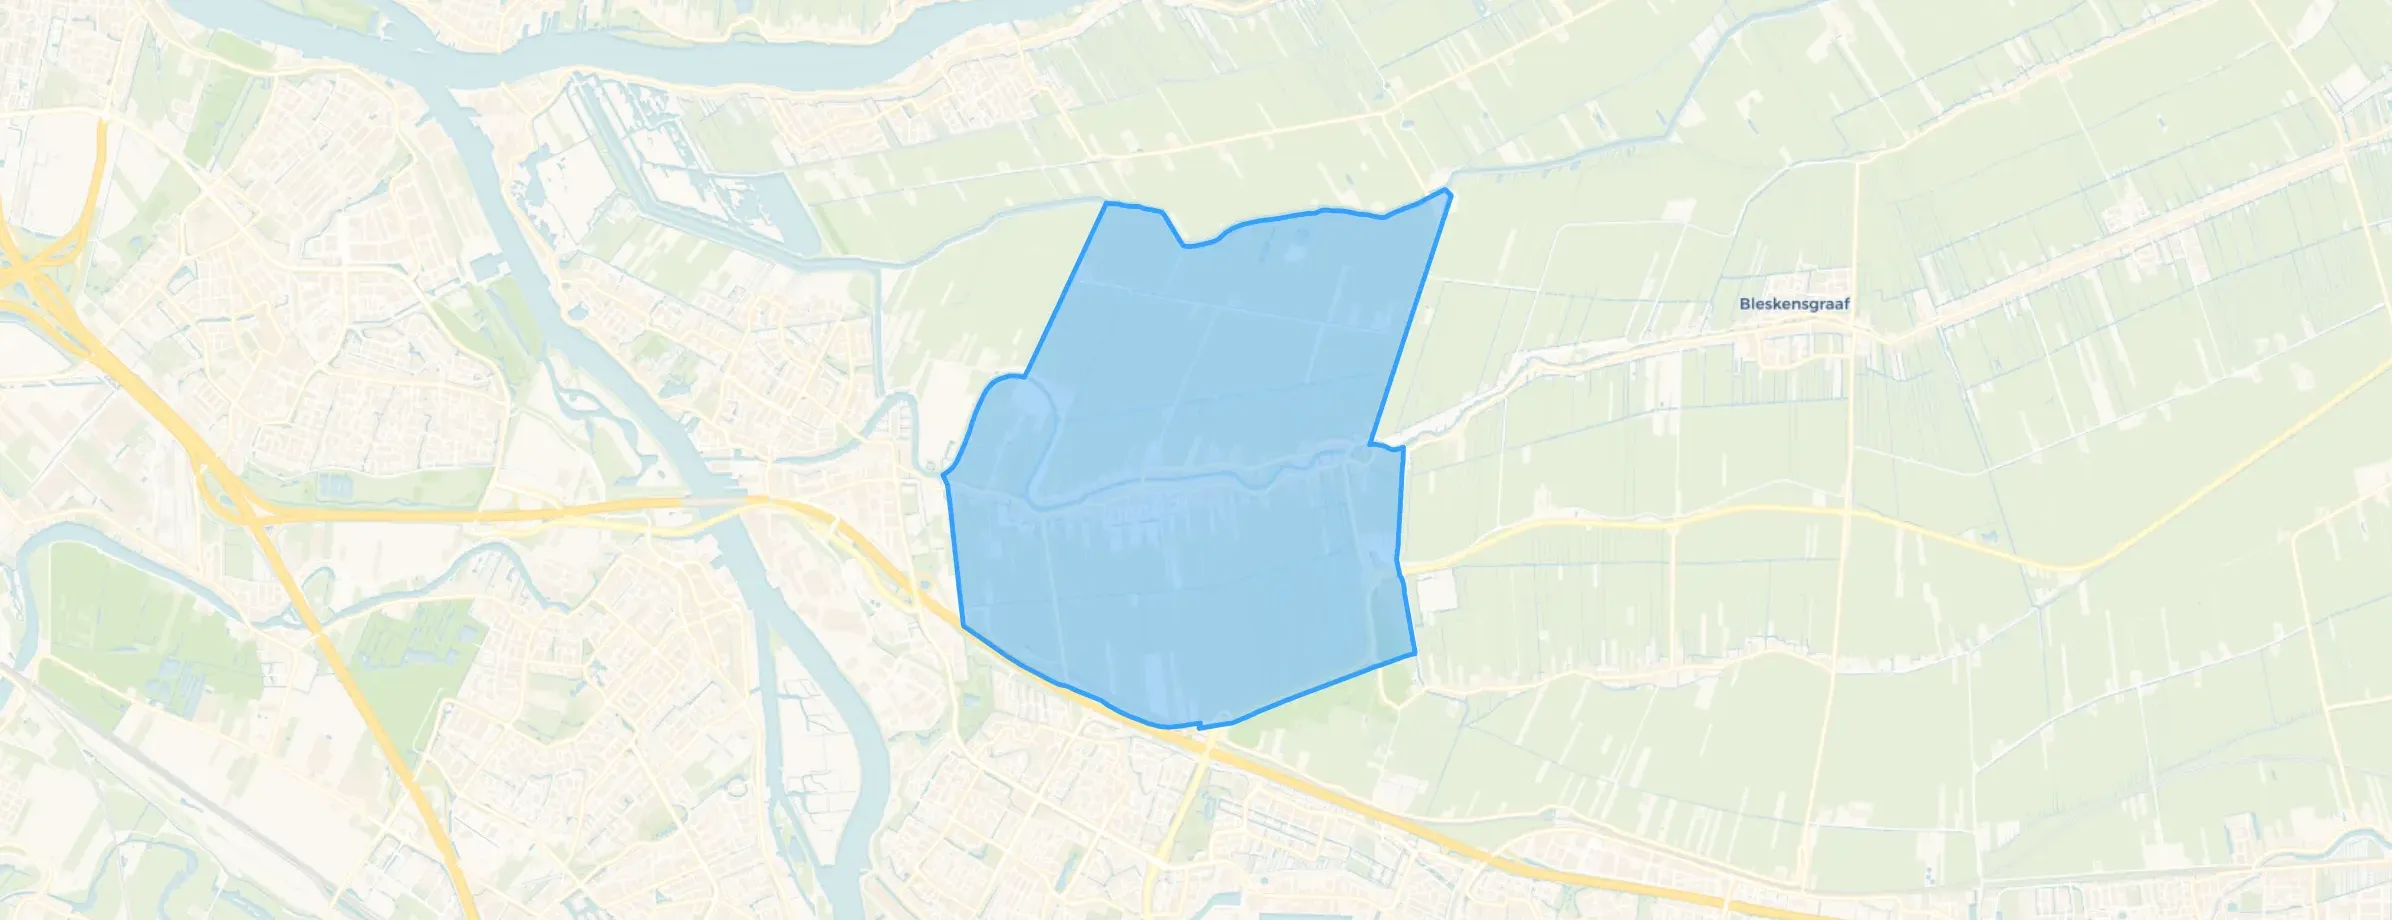
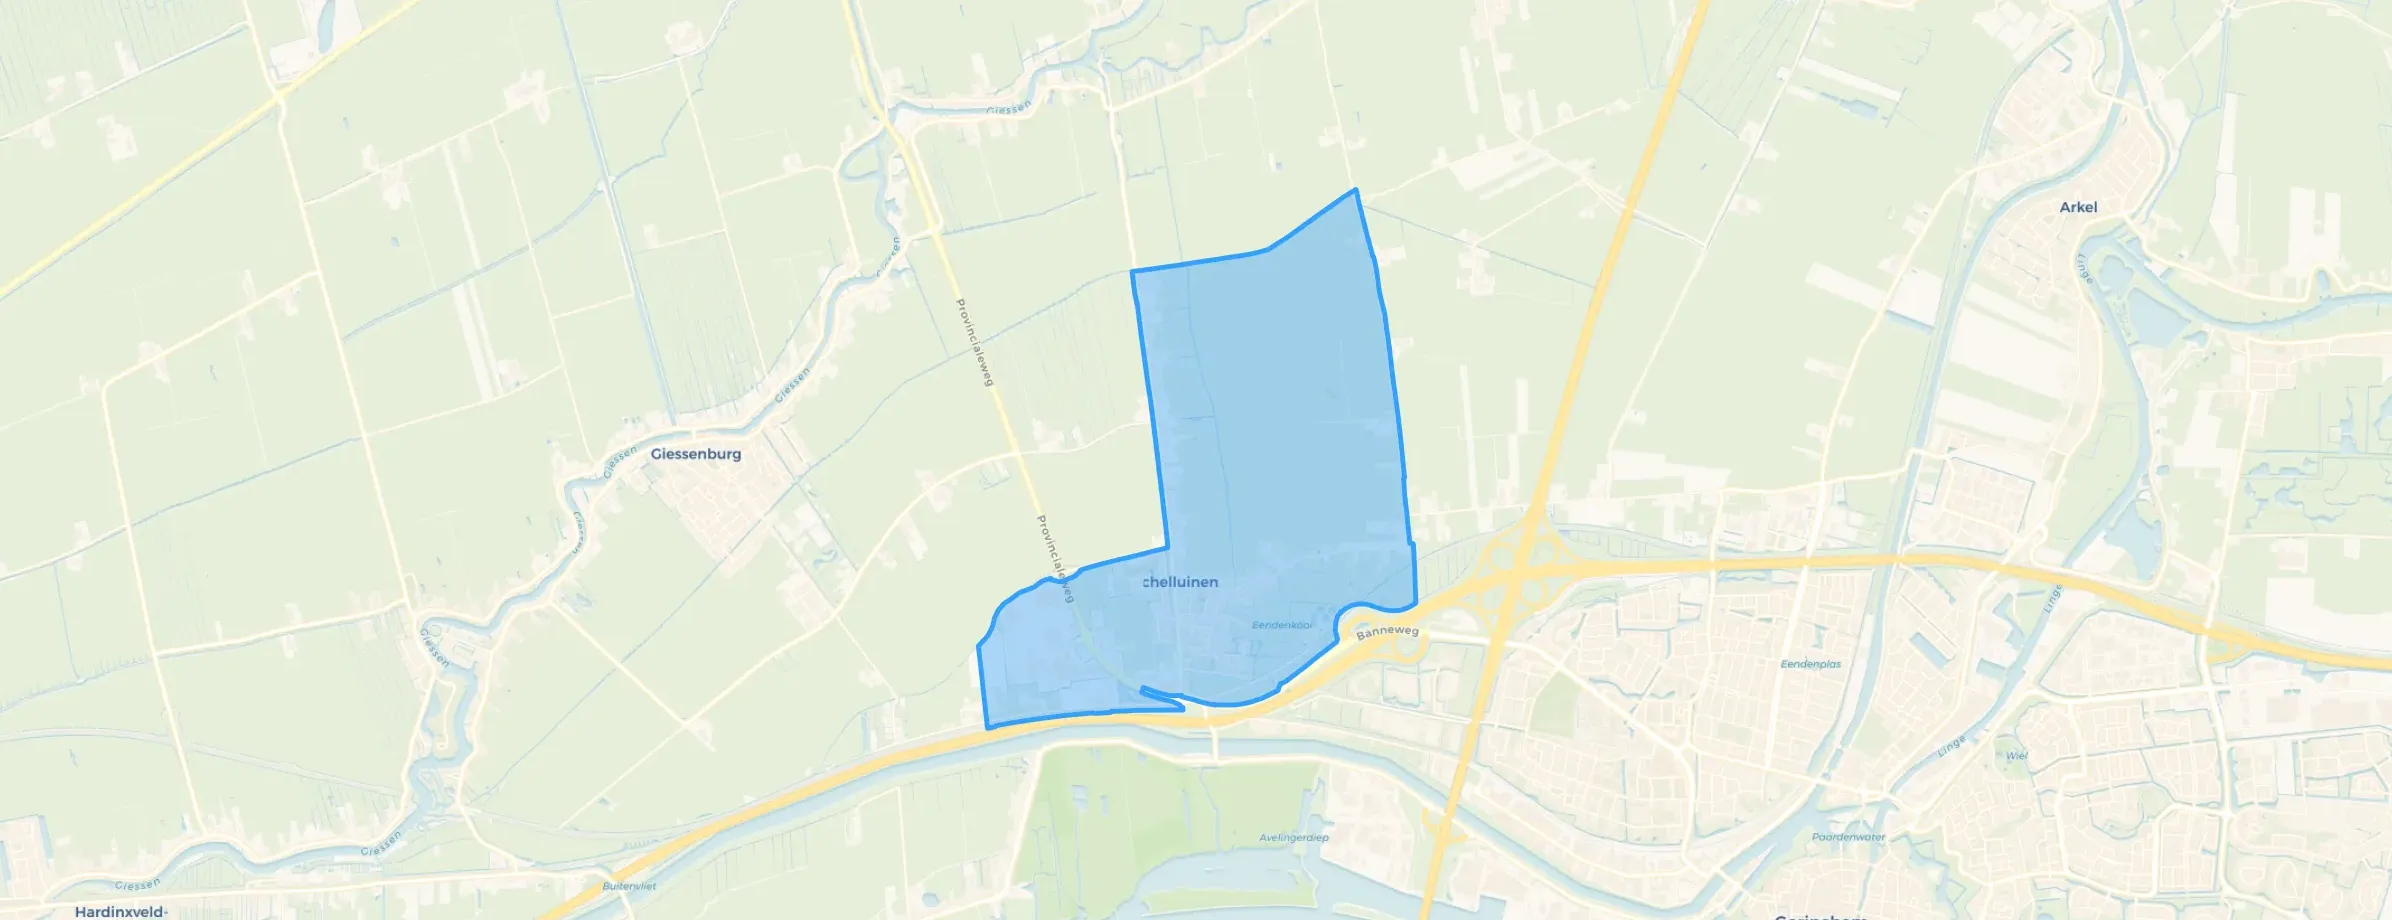
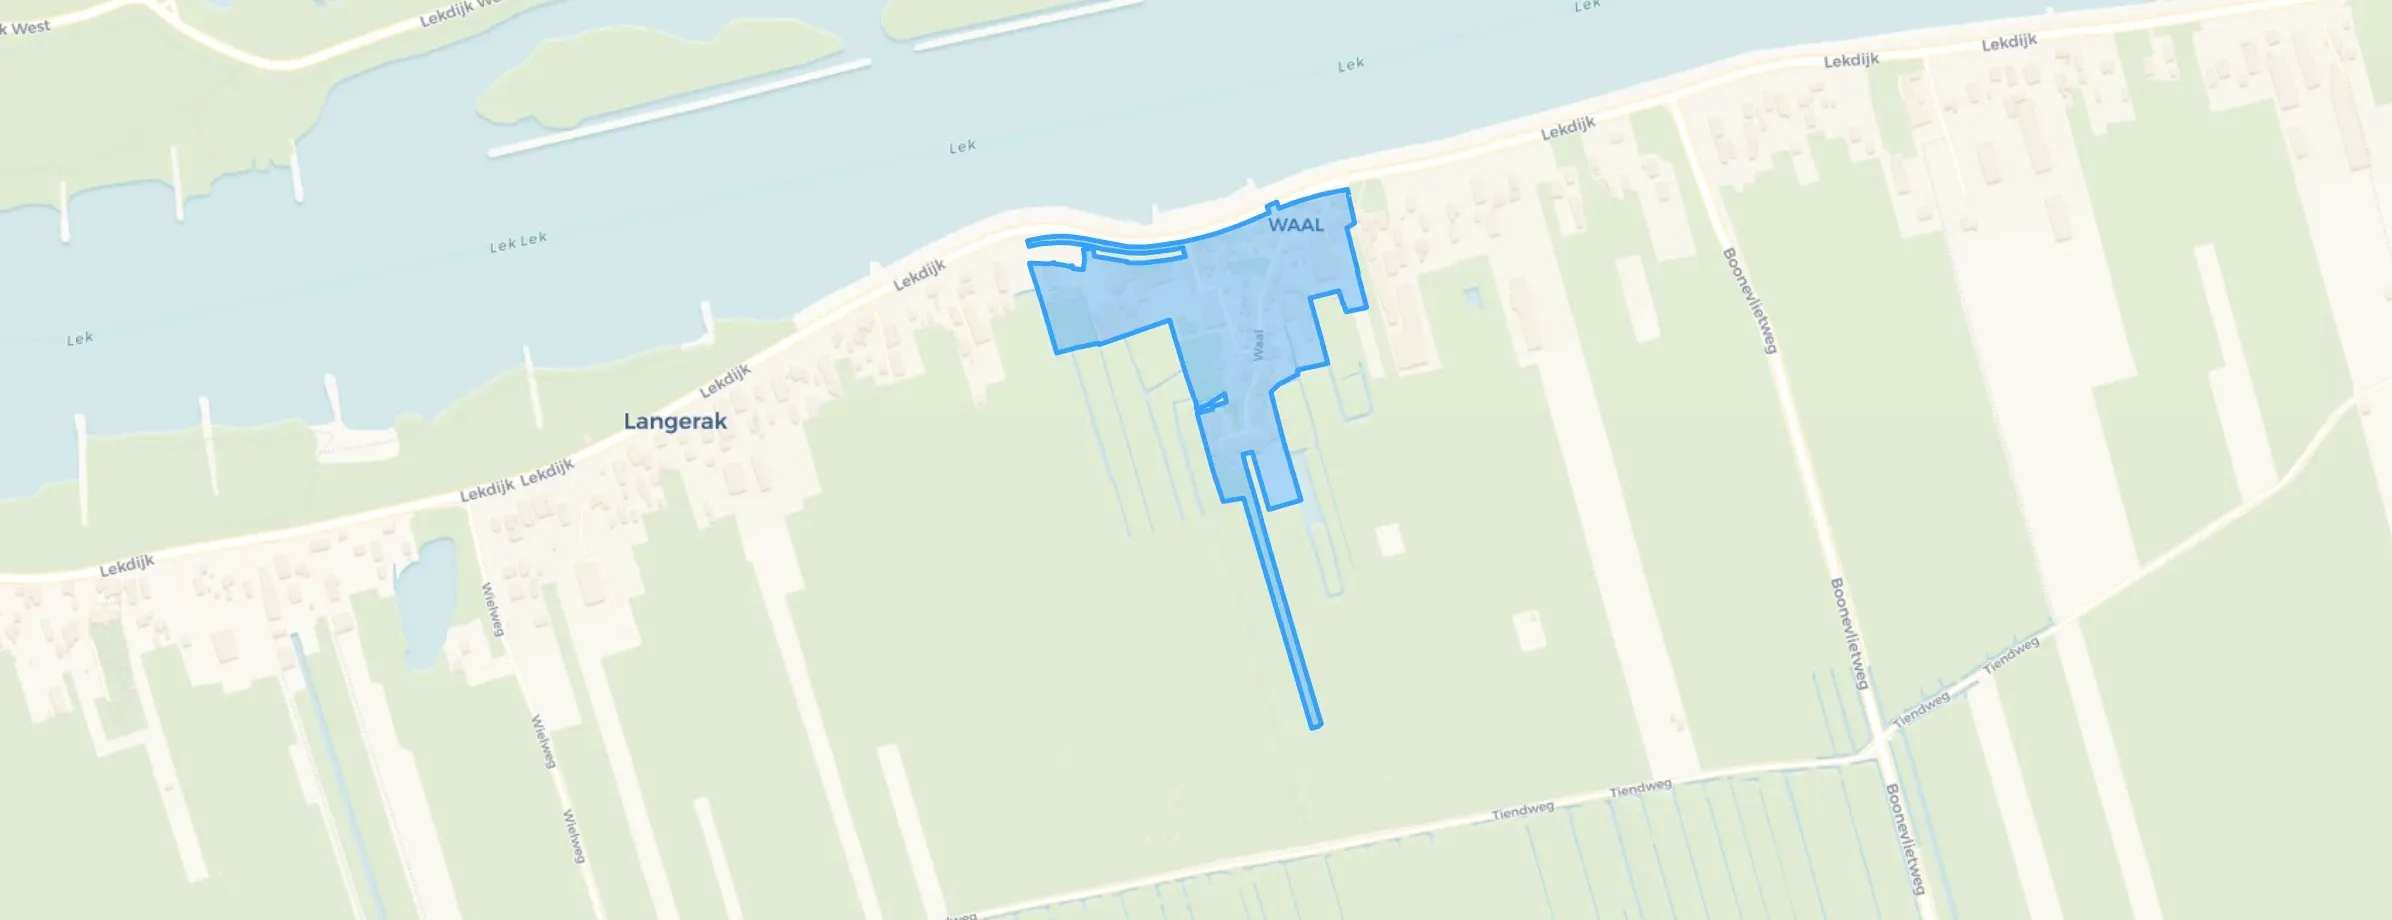
Great little neighbourhood, small cosy village. Lots of tourism in high season.
Auto-translated to English by AIEveryone is always very cosy and caring for each other.
Auto-translated to English by AIWe have been living here since February 2023. What stands out is the sense of community in the neighbourhood. A significant number of residents have lived here since it was built. They are open to new residents, who are each warmly welcomed with a flower or plant. There is also a neighbourhood app where useful things are shared. The village where this neighbourhood is located is fairly religious but not extreme. Sunday rest is still noticeably observed. People are not pushy with their faith towards non-believers; there is clearly mutual respect. In the village, it is normal to greet each other even if you don't know one another. This creates a relaxed atmosphere. There is also little to no crime, at least as far as we notice or hear. For the youth, a hangout spot has been set up outside the village centre, which is actually used. The village has a shopping gallery with a supermarket, bakery, butcher, hairdresser, florist, chemist, interior decorator, hairdresser, and family snack bar. There are also two restaurants, a Chinese takeaway, and a pizza/kebab shop. There is also a library and an active club life. There is also a GP out-of-hours centre/pharmacy/physio and fitness centre. The houses are almost all recently built, and the older buildings are either being replaced with new builds or renovated/restored. There are several Christian primary schools and one public primary school in the village. Within the village boundary there is enough green space, and due to the rural location around the village, there is a lot. In short, a wonderful place to live.
Auto-translated to English by AIGood contacts with the neighbours next door and behind, occasionally with others on the street and across the street. In most cases the front gardens look well-maintained. The shopping centre is easily accessible for daily needs, whether on foot, by bike or by car. For families with children, both primary schools are also easily accessible on foot.
Auto-translated to English by AIOur experiences with the neighbourhood are great! Very cosy and pleasant with each other
Auto-translated to English by AIThis is exactly what life in a village should be like. You know your neighbours. The neighbourhood is clean and safe. Nice walking environment and of course fantastic primary schools to go to. For amenities like a supermarket you don't have to go far either. Do you have to go further afield by public transport? Then I wish you good luck, because that is a real pain. Otherwise great :)
Auto-translated to English by AIRural safe environment, quiet neighbourhood. Lots of greenery.
Auto-translated to English by AIA child-friendly neighbourhood. Residents are very self-centred though.
Auto-translated to English by AIOver the past year a home for sale in Molenlanden was listed for an average of €702,792 (€4,229 per m²). That is 33% above the Dutch national average. Last quarter prices fell by 8%.
A rental home in Molenlanden cost an average of €1,834 per month (€13 per m²). That is 15% below the national average.
Residents give Molenlanden a 8.2 out of 10 based on 10 reviews. The strongest score is for nature and greenery (8.7), the weakest for housing (7.8).
Gemeente Molenlanden has 45,363 residents. Many families: 41% of the households have children.
The housing supply in Molenlanden is remarkably efficient: 52% has an A, A+ or B label. The average natural gas consumption per household is 890 m³ per year.
From Molenlanden you can on average reach a supermarket at 1.4 km, a GP at 1.3 km, a railway station at 8.7 km, a primary school at 0.9 km (as the crow flies, source: CBS).
Right now you will find 138 homes for sale and 7 homes for rent in Molenlanden.