Municipality in Gelderland
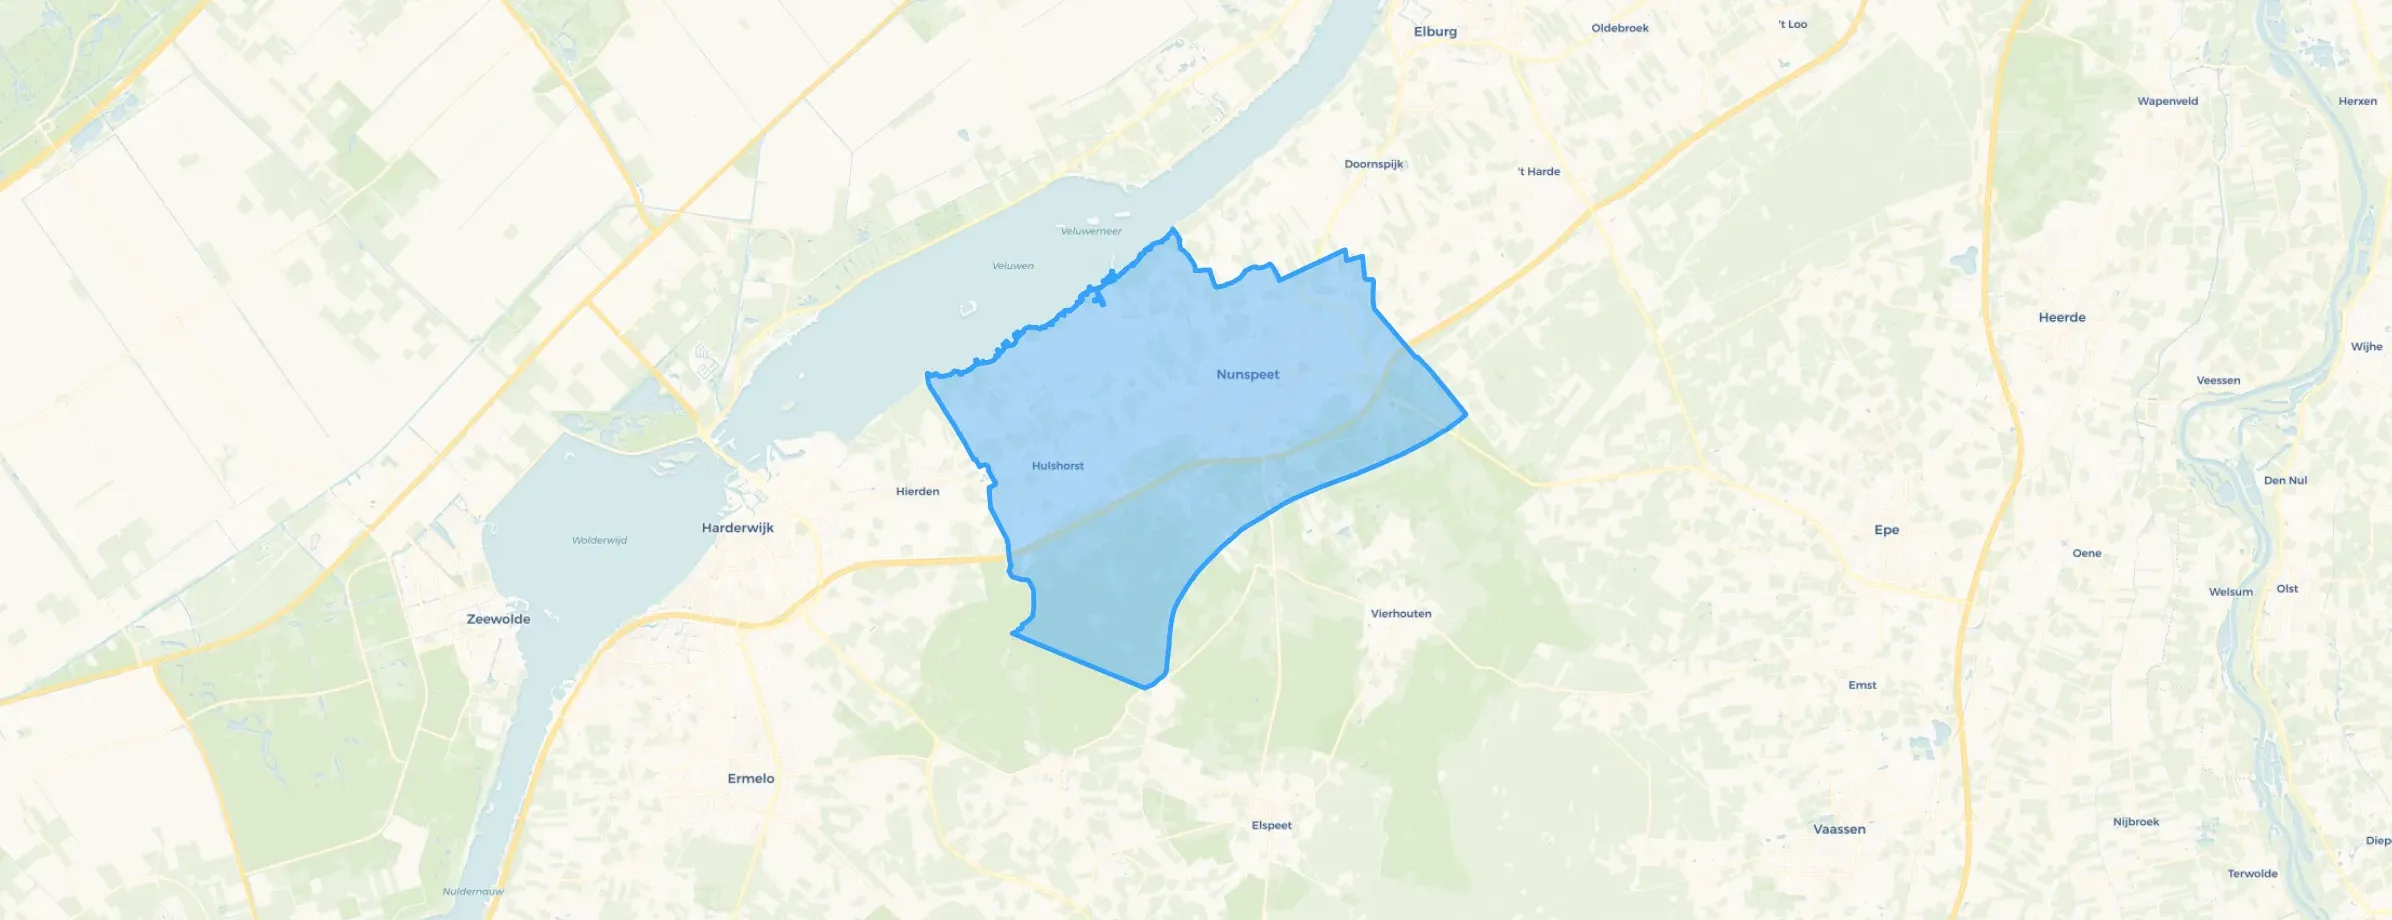
Nunspeet is located in the province of Gelderland The municipality has a total area of 12.953 hectares, of which 12.873 hectares are land and 80 hectares are water. The municipality is coded as GM0302. The postcode area is 8071AA-8077TZ.
Nunspeet has 29.393 residents. Of these, 49,4% are men and 50,6% are women. Most residents are 45 to 65 years (25,1%). The other age groups are 22,6% for '25 to 45 years', 21,9% for '65 years or older', 18,5% for '0 to 15 years' and 11,9% for '15 to 25 years'. Of the residents, 42,8% is unmarried, 46,4% is married, 5,8% is divorced and 5,1% is widowed. 26.630 residents originate from the Netherlands, 1.002 come from Europe and 1.761 come from countries outside Europe.
There are 11.671 households in Nunspeet. 29,4% of these are single-person households, 32,7% households without children and 37,8% households with children. The average household size is 2,5 persons. The national average is 2,1 persons.
In Nunspeet there are 22.500 income recipients. The average income per income recipient is €39.300, which is €2.900 (7%) lower than the national average of €42.200. Per resident, the average income is €31.300, which is €3.600 (10%) lower than the national average of €34.900. Most residents of Nunspeet are educated to an intermediate level. 44,7% have an intermediate education (HAVO, VWO or MBO 2-4), 32,3% have a lower education (VMBO or MBO 1) and 23,0% have a university or higher professional education (HBO/WO).
Of the 29.393 residents, around 75% are in paid employment, which amounts to 22.045 people. This is 3% higher than the national average of 72%. The majority of workers are in salaried employment (80%), while 20% are self-employed. In Nunspeet, 25% of residents receive a benefit. The largest group is those receiving a state pension (AOW). 5.790 people receive this benefit.
In Nunspeet there are 11.822 homes with an average assessed value (WOZ) of €451.000. Of these, around 96% are occupied and 4% unoccupied. Most homes are owner-occupied. This amounts to 34% rental homes and 66% owner-occupied homes. Of the homes, 65% privately owned, 23% owned by housing associations and 12% owned by other landlords. The most common construction periods in Nunspeet are 1950-1970 (20%) and 1970-1980 (17%).
There are currently no homes for sale in Nunspeet. The most recently listed home is Oosterlaan 125 by Kok & Heijkamp Makelaars op Funda. No homes were sold in Nunspeet over the past year.
There are currently no homes for rent in Nunspeet. The most recent home is Randweg 28, offered by www.hurennoordveluwe.nl. No homes were let in Nunspeet over the past year.
No recent rental data available for Nunspeet.
In Nunspeet there are 8.938 addresses with a registered energy label. The most common labels are A (29%), C (29%) and B (14%). On average, an address in Nunspeet uses 2.950 kWh of electricity per year. This is 16% above the national average of 2.550 kWh. Natural gas consumption, at 940 m³ per year, is 18% above the national average of 800 m³.
Tidy/safe neighbourhood, good neighbours. Everything is well maintained by the residents and the municipality. Close to the centre. Just a nice and cosy village.
Auto-translated to English by AIThis village isn't really my thing. A lot of being sworn at and stuff. Oh well. The surroundings are beautiful though.
Auto-translated to English by AIIt is very good in all areas, especially the nature is good
Auto-translated to English by AIThis village isn't really my thing. If you're different, you'll definitely be treated accordingly, unfortunately.
Auto-translated to English by AIOur neighbourhood is located in beautiful nature. We have nice detached houses. I know all the neighbours and used to play with the neighbourhood children. Elspeet is a safe village in terms of residents and traffic. Occasionally a bike gets stolen at the bus stop, for example, but as a woman you can walk the streets here late at night or at night without being afraid. Because of the church-going residents, there is a close-knit community, sometimes a bit too strict with each other, but everyone is always willing to help their neighbour. There are 3 primary schools within a 5-minute bike ride and 3 secondary schools about 50-60 minutes away by bike. It's just a shame that houses are so expensive, that more and more is being built, and that there aren't many amenities.
Auto-translated to English by AINice experience
Auto-translated to English by AICosy little neighbourhood
Auto-translated to English by AICosy neighbourhood, with diverse people living there. Various facilities. Well maintained.
Auto-translated to English by AIOver the past year a home for sale in Nunspeet was listed for an average of €598,056 (€4,213 per m²). That is 13% above the Dutch national average. Last quarter prices fell by 24%.
A rental home in Nunspeet cost an average of €1,079 per month (€15 per m²). That is 50% below the national average.
Residents give Nunspeet a 8.2 out of 10 based on 12 reviews. The strongest score is for nature and greenery (9.0), the weakest for education (7.9).
Gemeente Nunspeet has 29,393 residents. Many families: 38% of the households have children.
The housing supply in Nunspeet is remarkably efficient: 58% has an A, A+ or B label. The average natural gas consumption per household is 940 m³ per year.
From Nunspeet you can on average reach a supermarket at 1.2 km, a GP at 1.3 km, a railway station at 3.6 km, a primary school at 0.8 km (as the crow flies, source: CBS).
Right now you will find 237 homes for sale and 9 homes for rent in Nunspeet.