Municipality in Utrecht
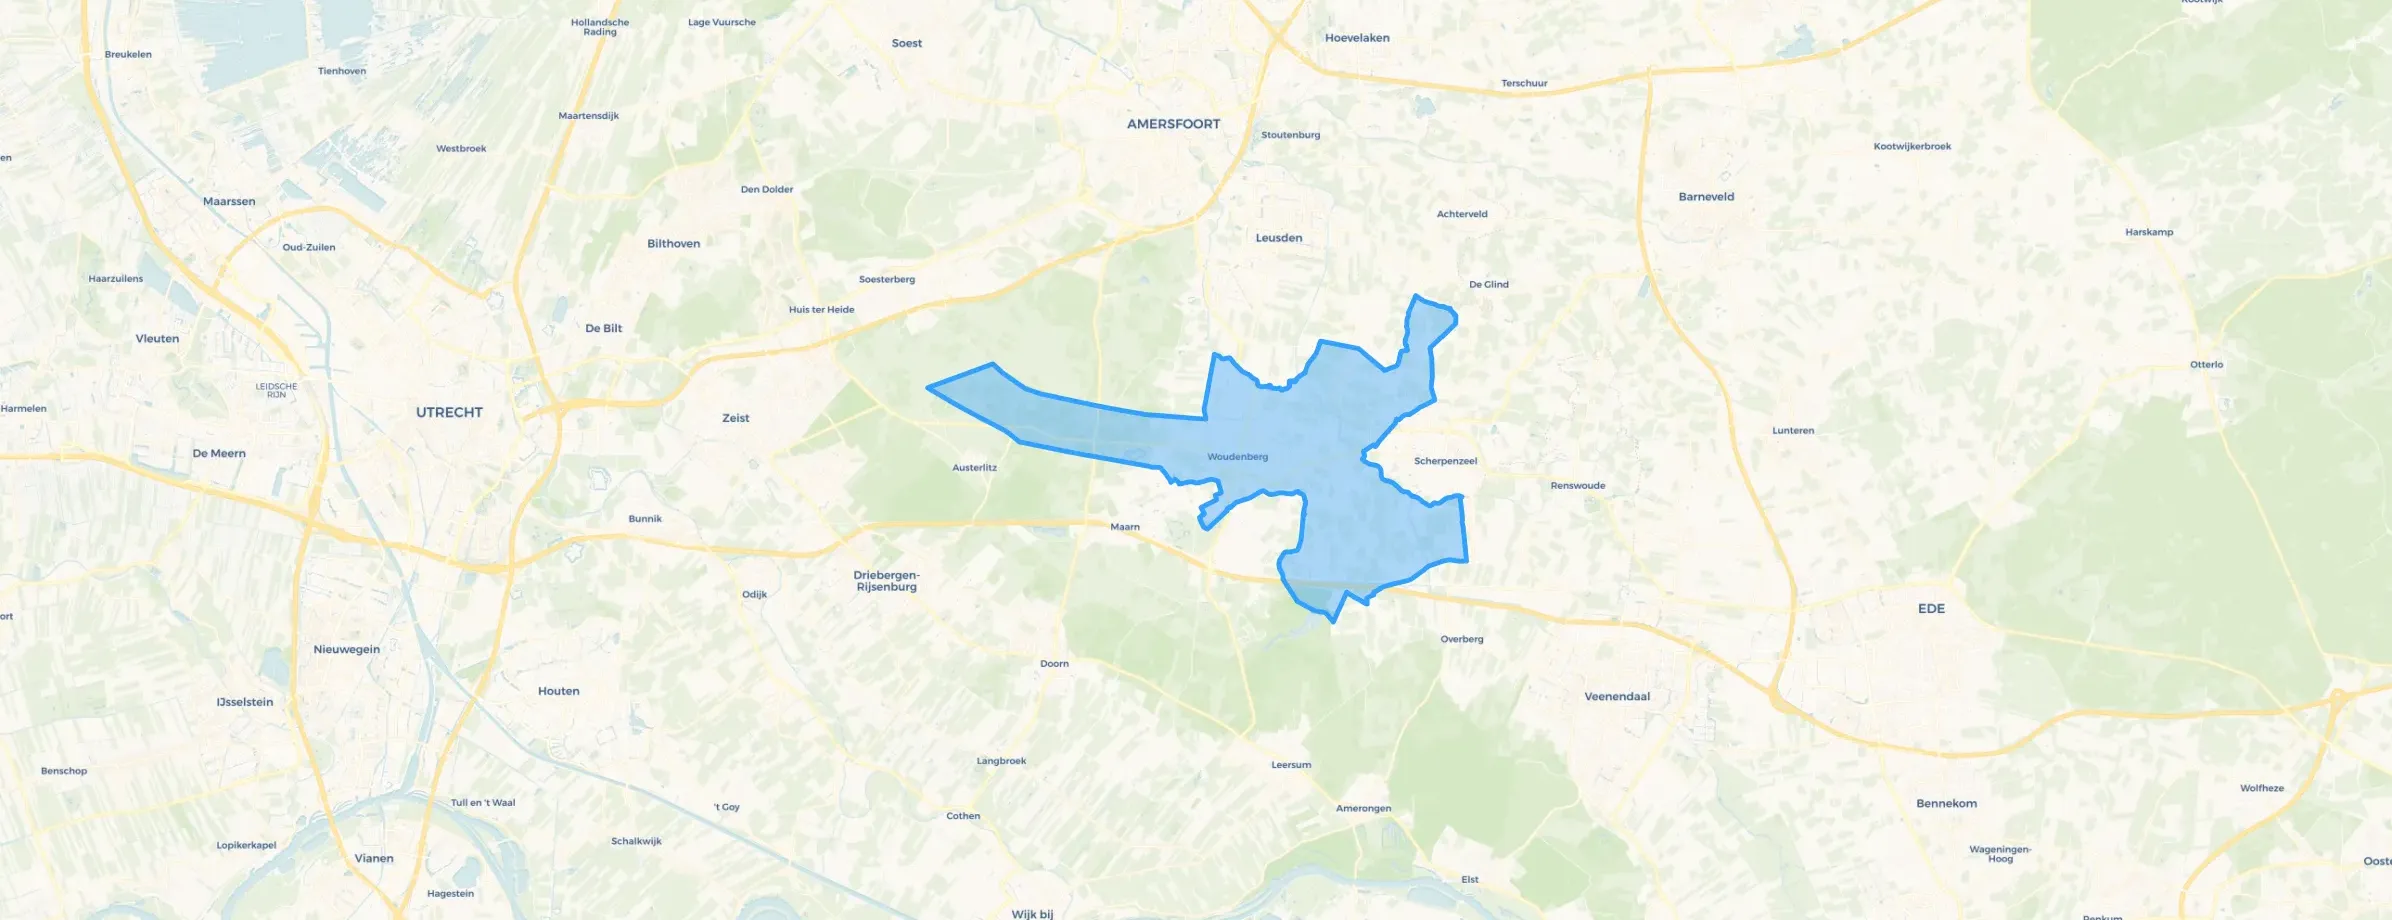
Woudenberg is located in the province of Utrecht The municipality has a total area of 3.682 hectares, of which 3.652 hectares are land and 30 hectares are water. The municipality is coded as GM0351. The postcode area is 3931AA-3931ZZ.
Woudenberg has 14.760 residents. Of these, 49,9% are men and 50,1% are women. Most residents are 45 to 65 years (24,5%). The other age groups are 24,4% for '25 to 45 years', 19,4% for '0 to 15 years', 19,2% for '65 years or older' and 12,4% for '15 to 25 years'. Of the residents, 45,7% is unmarried, 44,5% is married, 5,2% is divorced and 4,6% is widowed. 12.530 residents originate from the Netherlands, 745 come from Europe and 1.485 come from countries outside Europe.
There are 5.751 households in Woudenberg. 28,6% of these are single-person households, 30,5% households without children and 40,9% households with children. The average household size is 2,5 persons. The national average is 2,1 persons.
In Woudenberg there are 11.300 income recipients. The average income per income recipient is €42.900, which is €700 (2%) higher than the national average of €42.200. Per resident, the average income is €33.900, which is €1.000 (3%) lower than the national average of €34.900. Most residents of Woudenberg are educated to an intermediate level. 44,7% have an intermediate education (HAVO, VWO or MBO 2-4), 32,2% have a university or higher professional education (HBO/WO) and 23,1% have a lower education (VMBO or MBO 1).
Of the 14.760 residents, around 79% are in paid employment, which amounts to 11.660 people. This is 7% higher than the national average of 72%. The majority of workers are in salaried employment (82%), while 18% are self-employed. In Woudenberg, 23% of residents receive a benefit. The largest group is those receiving a state pension (AOW). 2.570 people receive this benefit.
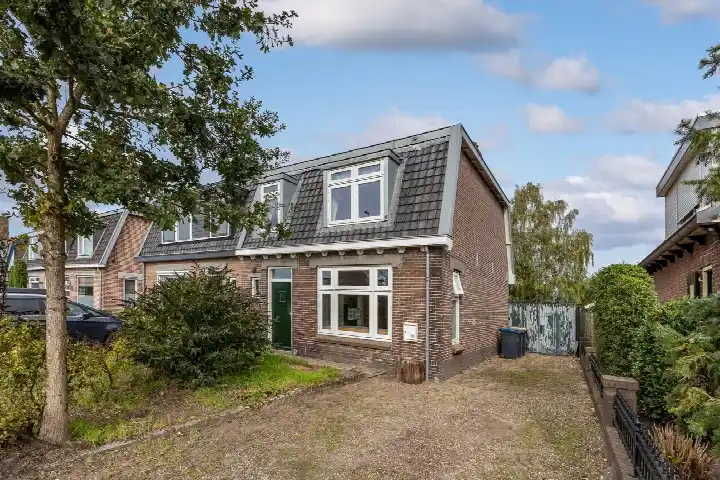
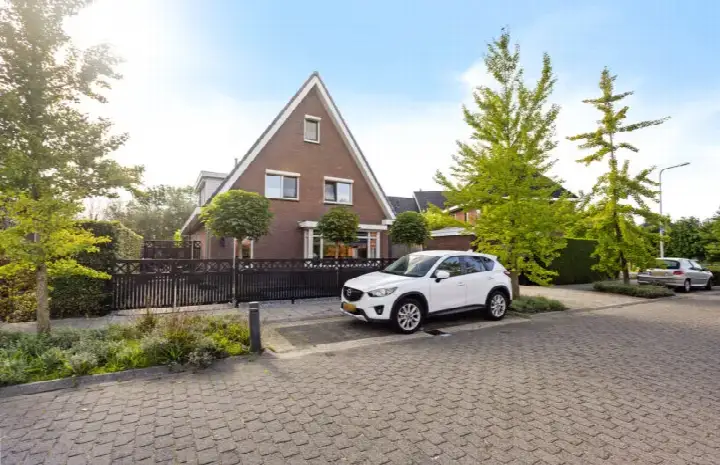
In Woudenberg there are 5.744 homes with an average assessed value (WOZ) of €505.000. Of these, around 97% are occupied and 3% unoccupied. Most homes are owner-occupied. This amounts to 29% rental homes and 71% owner-occupied homes. Of the homes, 71% privately owned, 20% owned by housing associations and 9% owned by other landlords. The most common construction periods in Woudenberg are 1950-1970 (23%) and 1990-2000 (13%).
There are currently no homes for sale in Woudenberg. The most recently listed home is Stationsweg Oost 229 by Herbrink Makelaars op Funda. No homes were sold in Woudenberg over the past year.
There are currently no homes for rent in Woudenberg. The most recent home is Valleilaan 87, offered by Molenbeek. No homes were let in Woudenberg over the past year.
No recent rental data available for Woudenberg.
In Woudenberg there are 3.744 addresses with a registered energy label. The most common labels are A (34%), C (20%) and B (16%). On average, an address in Woudenberg uses 2.940 kWh of electricity per year. This is 15% above the national average of 2.550 kWh. Natural gas consumption, at 850 m³ per year, is 6% above the national average of 800 m³.
Nice and friendly. Children can have a good time and are safe in the area
Auto-translated to English by AIFine, I don't have much to do with the people around here, but there's a lot of nature. I just think it's a shame that they killed wolf Bram. Houses are just unaffordable.
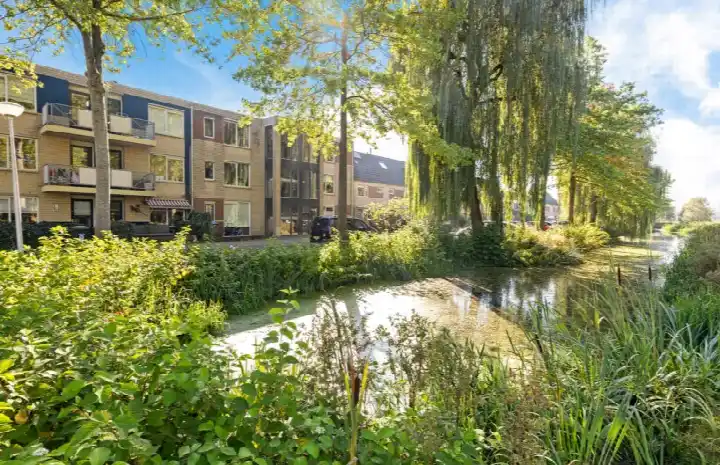
Auto-translated to English by AIFine. It's safe, quiet and green. It just doesn't feel very warm, but that might have more to do with the times we live in; people are more to themselves. Sometimes there is some nuisance. Children, fireworks, dog and cat poop that isn't cleaned up.
Auto-translated to English by AIPleasant neighbourhood, but busy intersection De Ekris, a lot of traffic. The driveway tyres, no consideration for disabled bicycles.
Auto-translated to English by AII've lived here since I was a child, and I also went to primary school here. I work here, it's okay to live here.
Auto-translated to English by AINice neighbourhood with nice people who don't bother you
Auto-translated to English by AIWell, I have one family that complains about everything, but the rest of the neighbourhood is all friendly.
Auto-translated to English by AIRarely experienced anything unpleasant.
Auto-translated to English by AIThe housing stock is mainly post-war — 50% was built between 1945 and 1990.
Over the past year a home for sale in Woudenberg was listed for an average of €583,996 (€4,661 per m²). That is 11% above the Dutch national average.
Residents give Woudenberg a 8.1 out of 10 based on 9 reviews. Nature and greenery stands out with a 9.0; cleanliness lags behind with a 7.7.
Gemeente Woudenberg has 14,760 residents. Many families: 41% of the households have children.
The housing supply in Woudenberg is remarkably efficient: 68% has an A, A+ or B label. The average natural gas consumption per household is 850 m³ per year.
From Woudenberg you can on average reach a supermarket at 0.9 km, a GP at 1.0 km, a railway station at 5.3 km, a primary school at 0.7 km (as the crow flies, source: CBS).
Right now you will find 55 homes for sale and 1 homes for rent in Woudenberg.