Municipality in Zuid-Holland
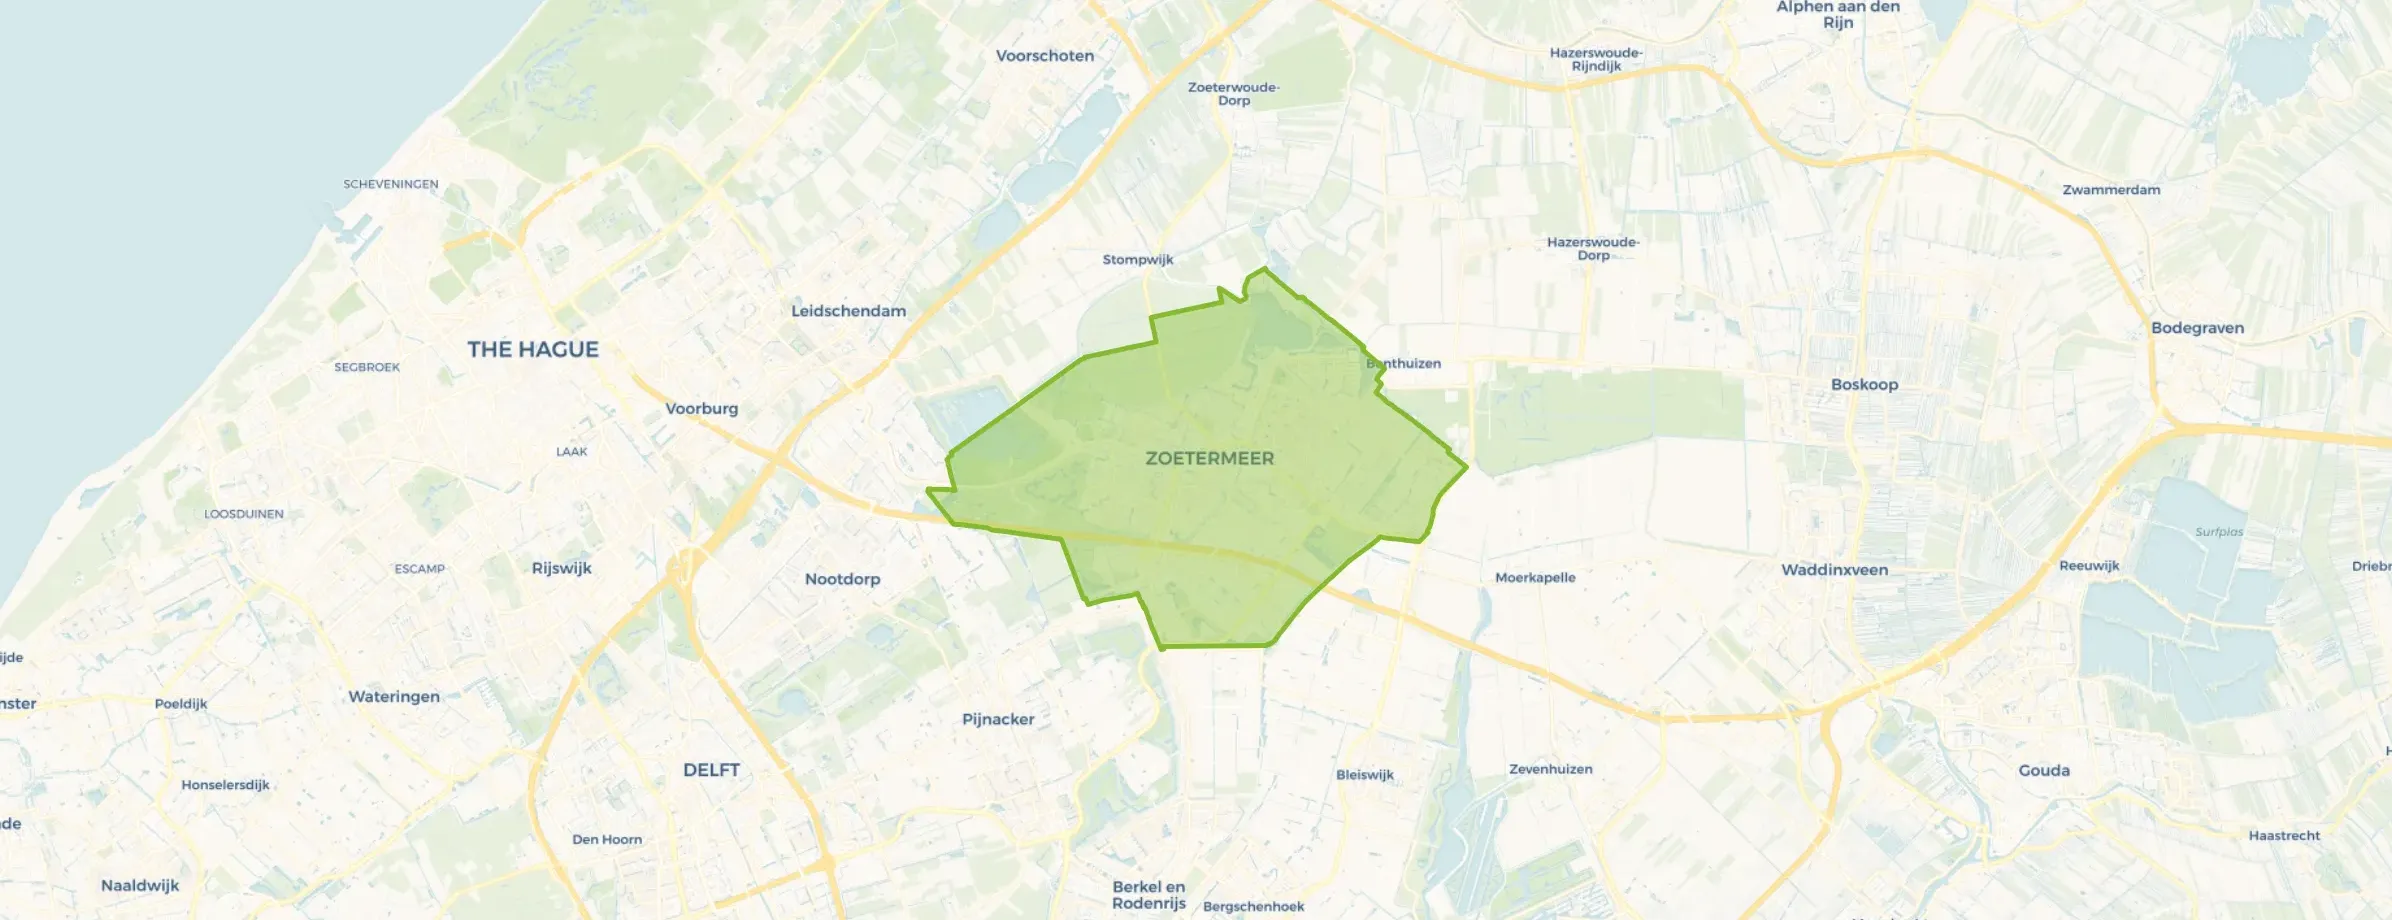
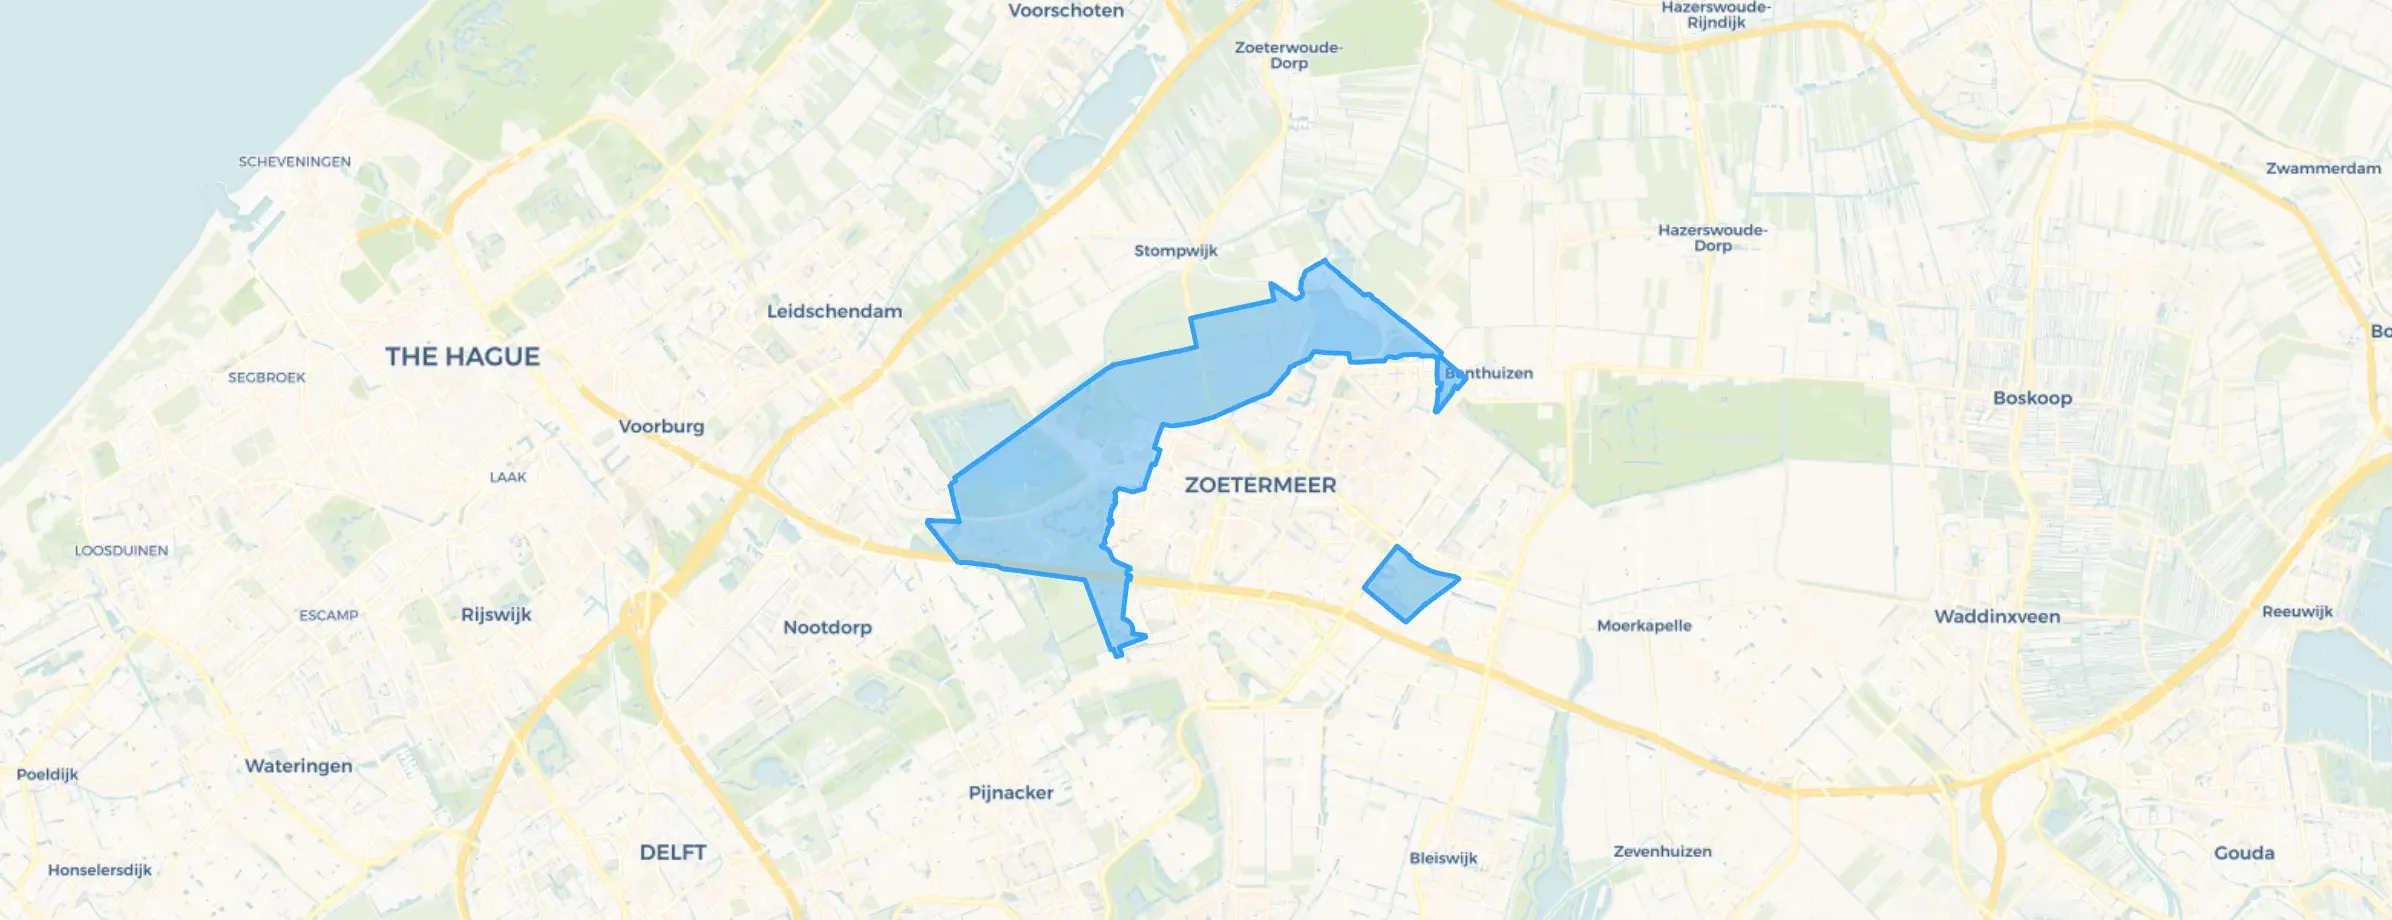
Zoetermeer is located in the province of Zuid-Holland The municipality has a total area of 3.705 hectares, of which 3.443 hectares are land and 262 hectares are water. The municipality is coded as GM0637. The postcode area is 2711AA-2729RJ.
Zoetermeer has 129.862 residents. Of these, 49,1% are men and 50,9% are women. Most residents are 25 to 45 years (25,3%). The other age groups are 25,3% for '45 to 65 years', 21,3% for '65 years or older', 16,5% for '0 to 15 years' and 11,6% for '15 to 25 years'. Of the residents, 48,8% is unmarried, 37,6% is married, 9,4% is divorced and 4,3% is widowed. 81.203 residents originate from the Netherlands, 8.921 come from Europe and 39.738 come from countries outside Europe.
There are 58.350 households in Zoetermeer. 35,9% of these are single-person households, 27,6% households without children and 36,5% households with children. The average household size is 2,2 persons. The national average is 2,1 persons.
In Zoetermeer there are 103.000 income recipients. The average income per income recipient is €42.800, which is €600 (1%) higher than the national average of €42.200. Per resident, the average income is €34.700, which is €200 (1%) lower than the national average of €34.900. Most residents of Zoetermeer are educated to an intermediate level. 43,1% have an intermediate education (HAVO, VWO or MBO 2-4), 30,7% have a university or higher professional education (HBO/WO) and 26,1% have a lower education (VMBO or MBO 1).
Of the 129.862 residents, around 70% are in paid employment, which amounts to 90.903 people. This is 2% lower than the national average of 72%. The majority of workers are in salaried employment (86%), while 14% are self-employed. In Zoetermeer, 27% of residents receive a benefit. The largest group is those receiving a state pension (AOW). 24.770 people receive this benefit.
In Zoetermeer there are 58.212 homes with an average assessed value (WOZ) of €375.000. Of these, around 97% are occupied and 3% unoccupied. Most homes are owner-occupied. This amounts to 44% rental homes and 56% owner-occupied homes. Of the homes, 56% privately owned, 34% owned by housing associations and 10% owned by other landlords. The most common construction periods in Zoetermeer are 1970-1980 (30%) and 1980-1990 (26%).
There are currently no homes for sale in Zoetermeer. The most recently listed home is Hoogvlietstraat 6 by De Makelaars Jenné | Baars | Jenné. No homes were sold in Zoetermeer over the past year.
There are currently no homes for rent in Zoetermeer. The most recent home is Verweijhove 18, offered by www.woonnet-haaglanden.nl. No homes were let in Zoetermeer over the past year.
No recent rental data available for Zoetermeer.
In Zoetermeer there are 43.952 addresses with a registered energy label. The most common labels are A (30%), C (25%) and B (17%). On average, an address in Zoetermeer uses 2.520 kWh of electricity per year. This is 1% below the national average of 2.550 kWh. With an annual consumption of 670 m³ per address, natural gas consumption is 16% below the national average of 800 m³.
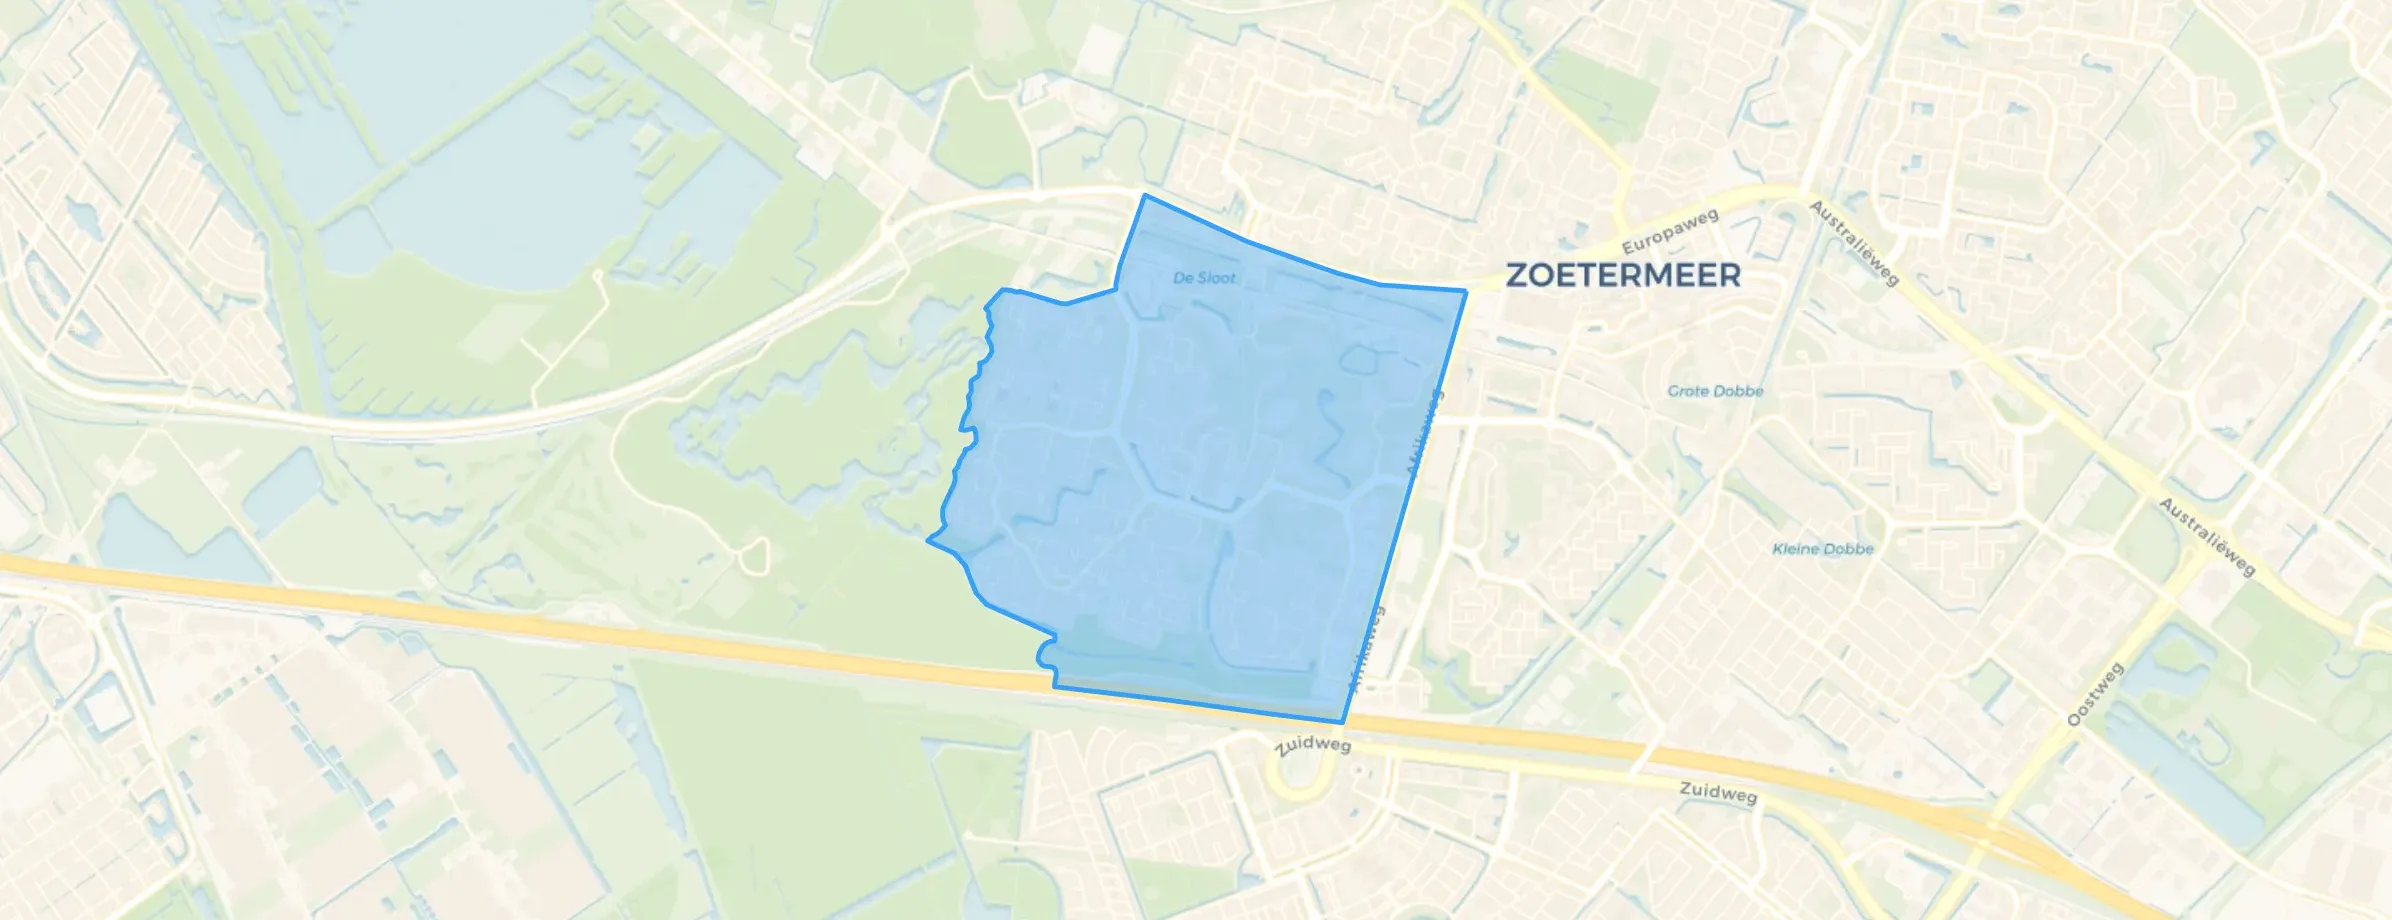
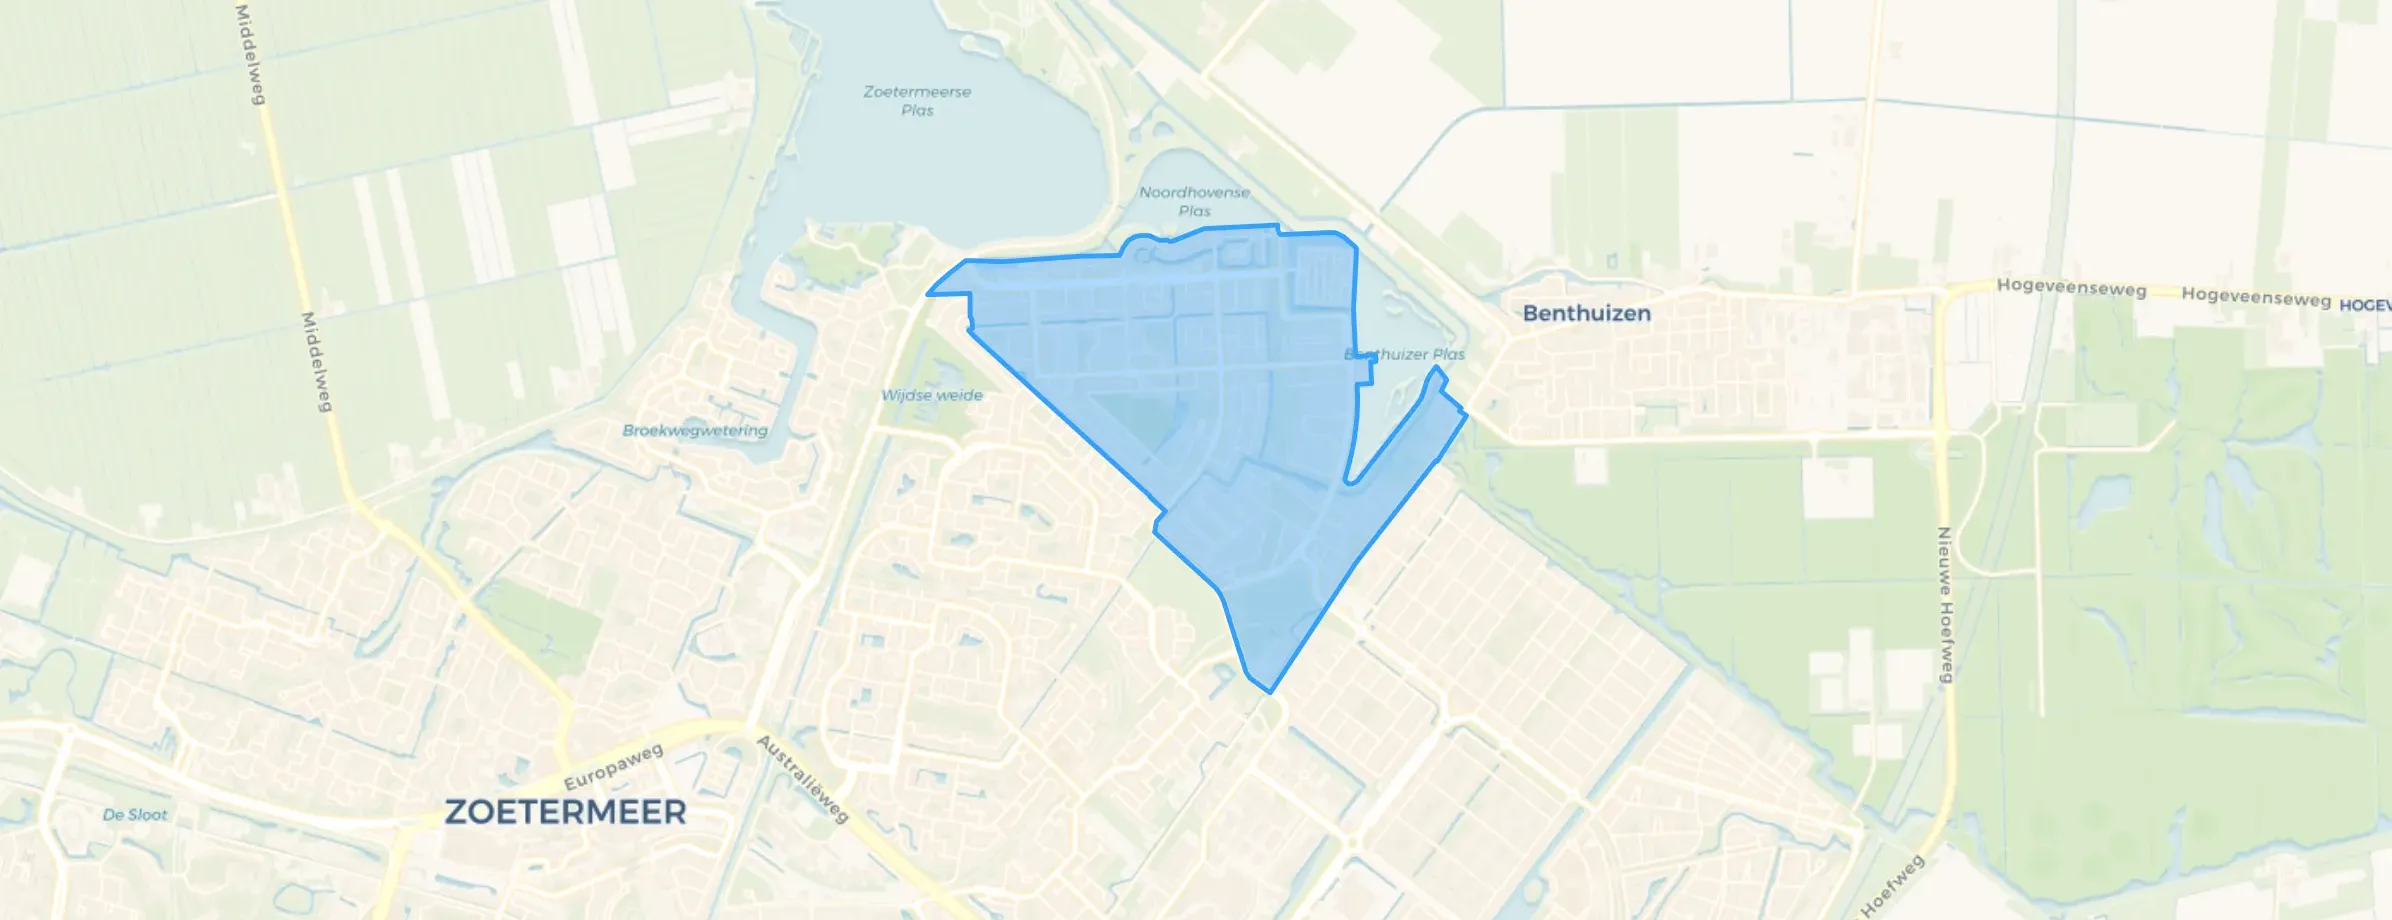
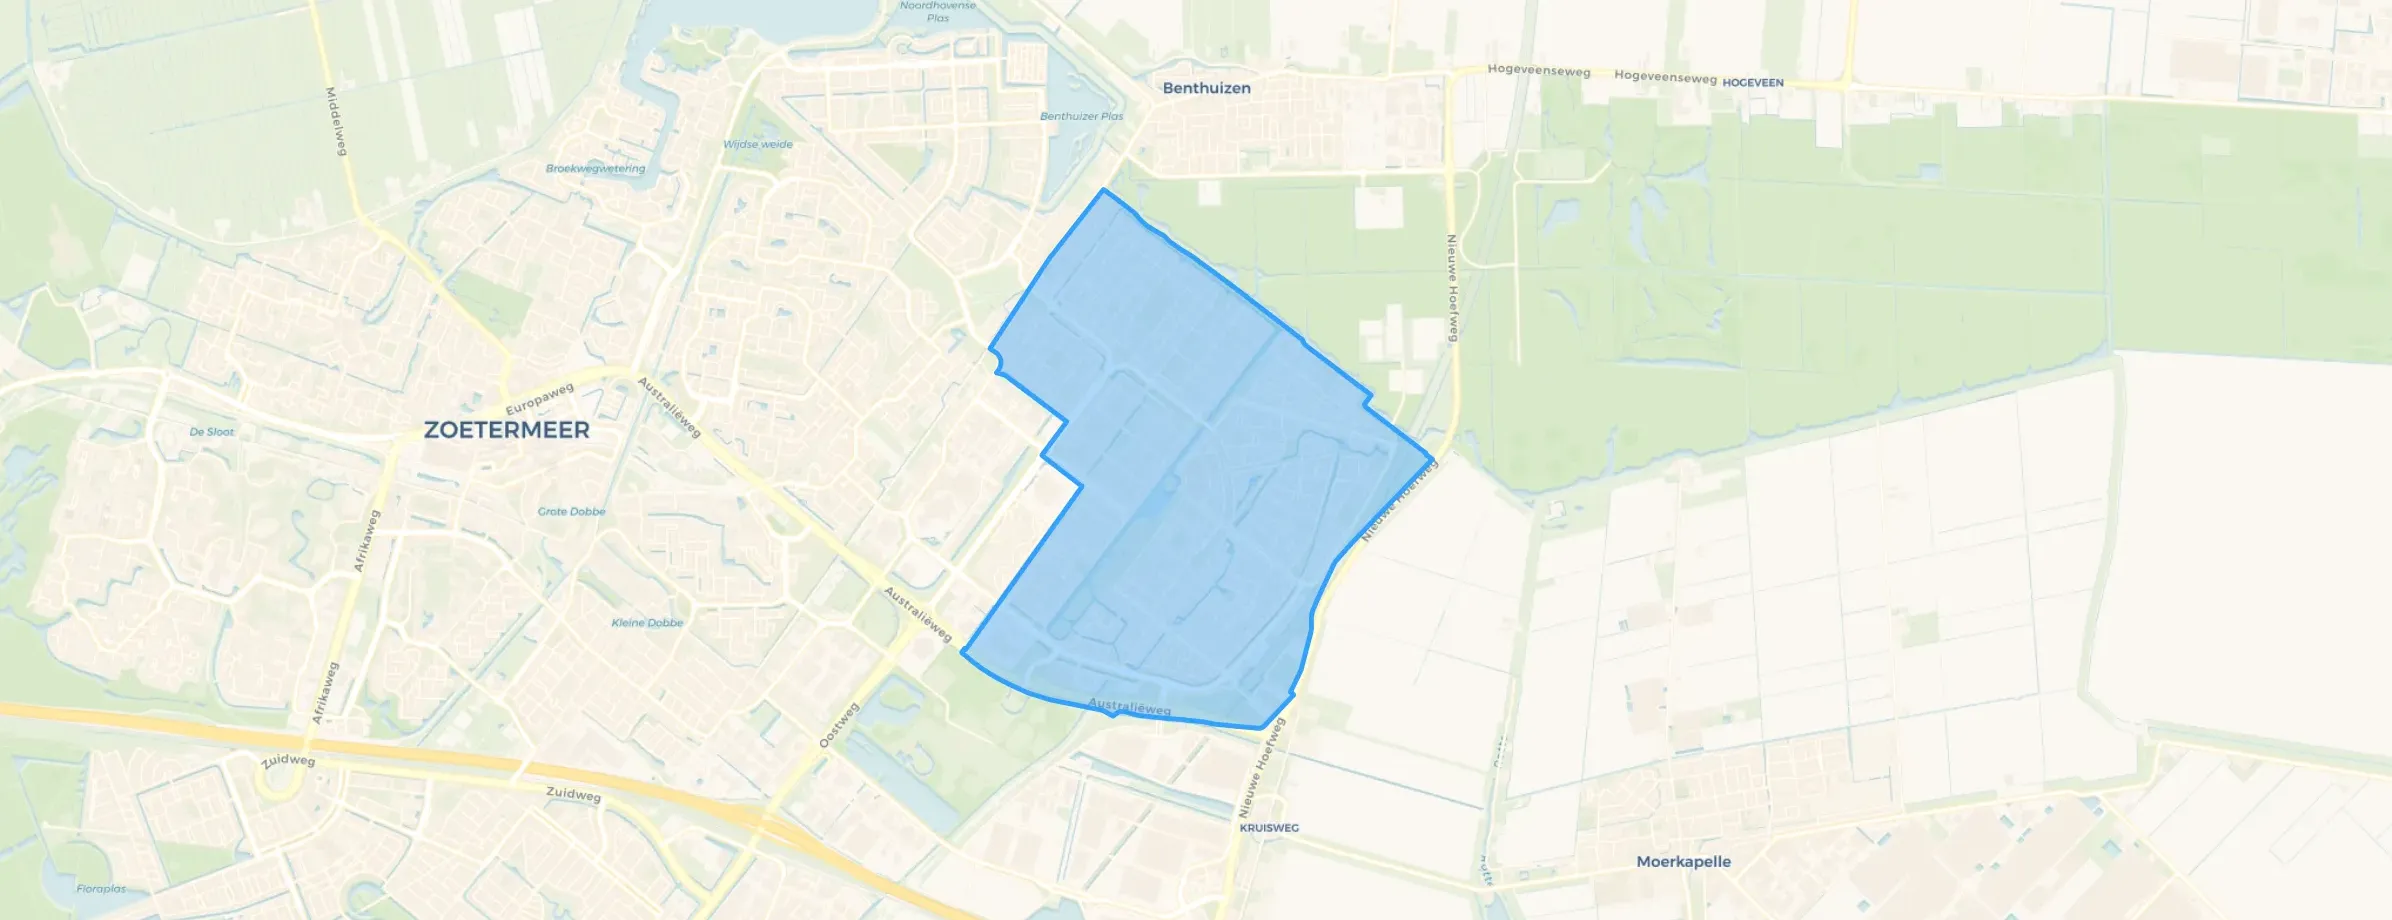
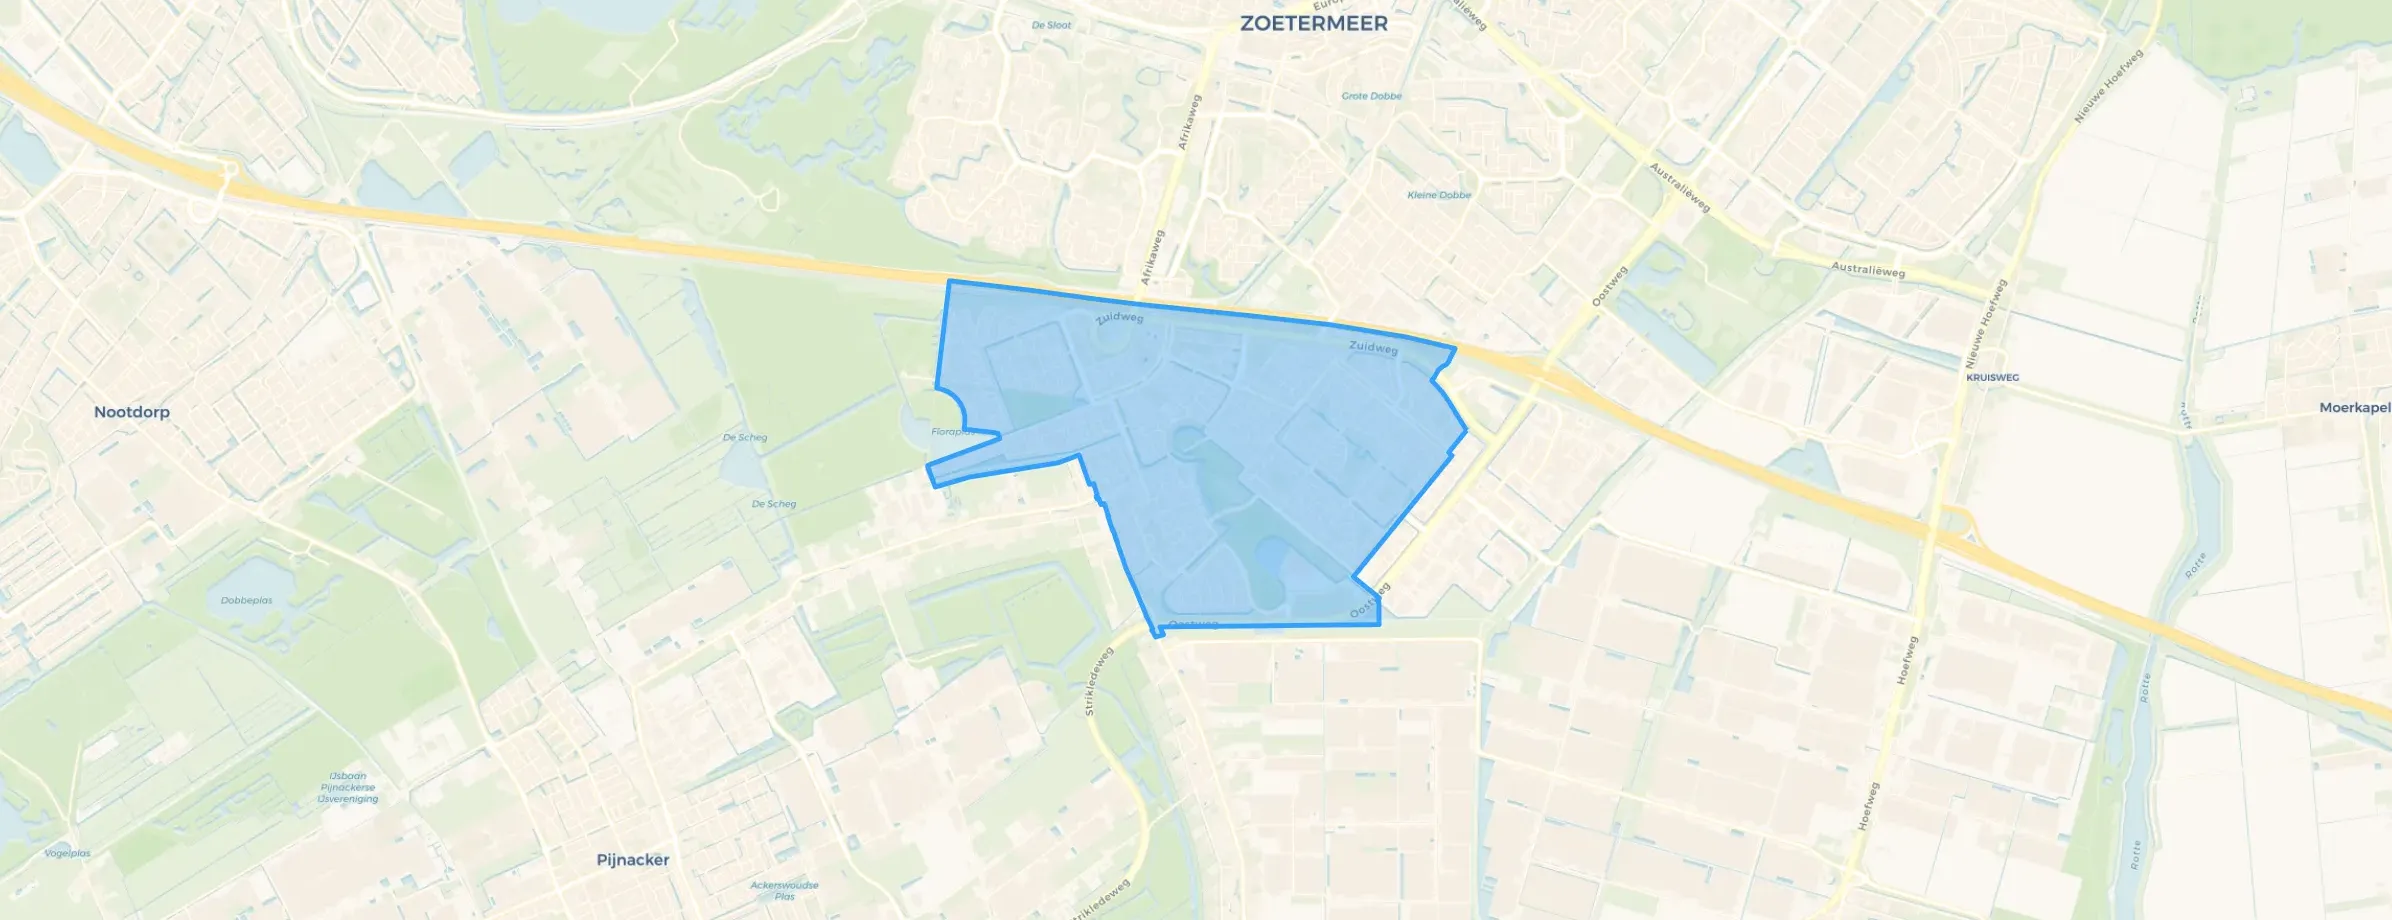
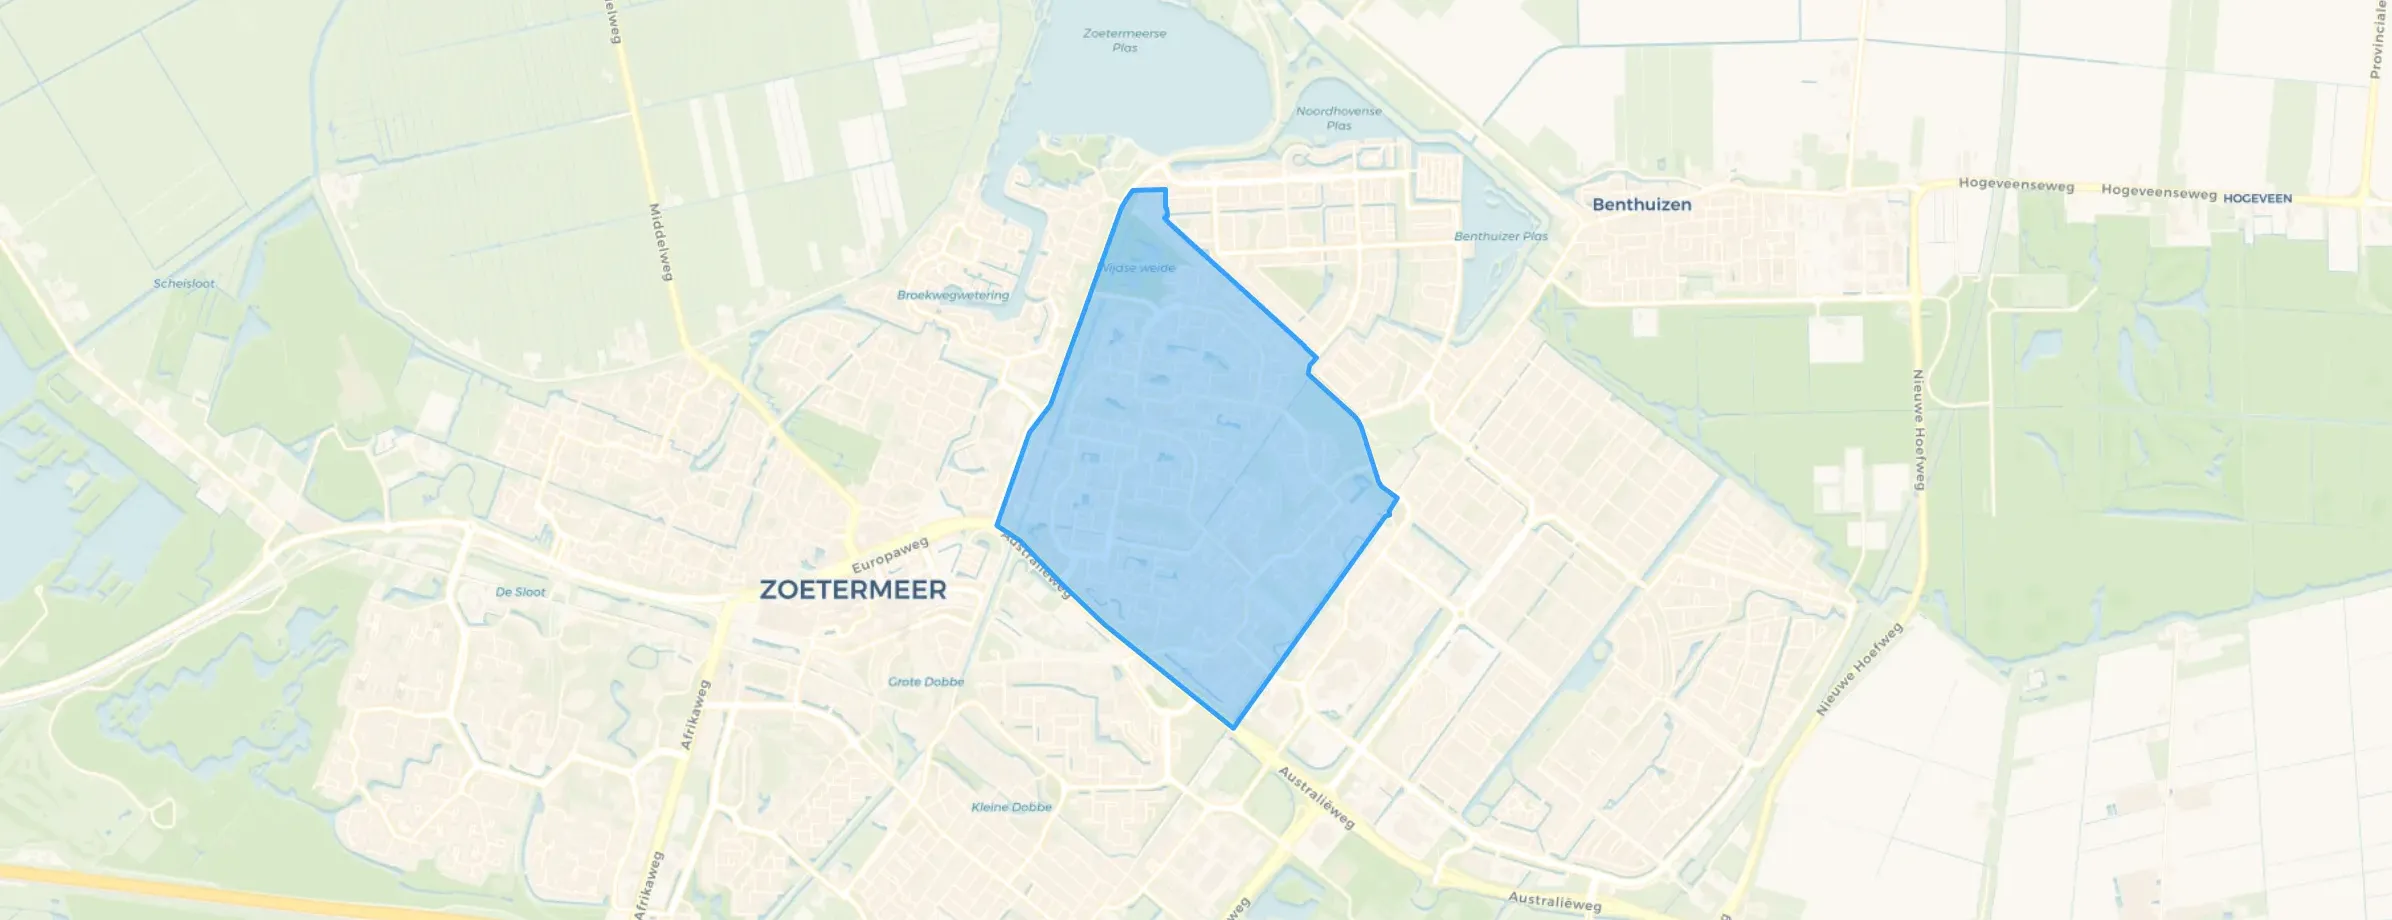
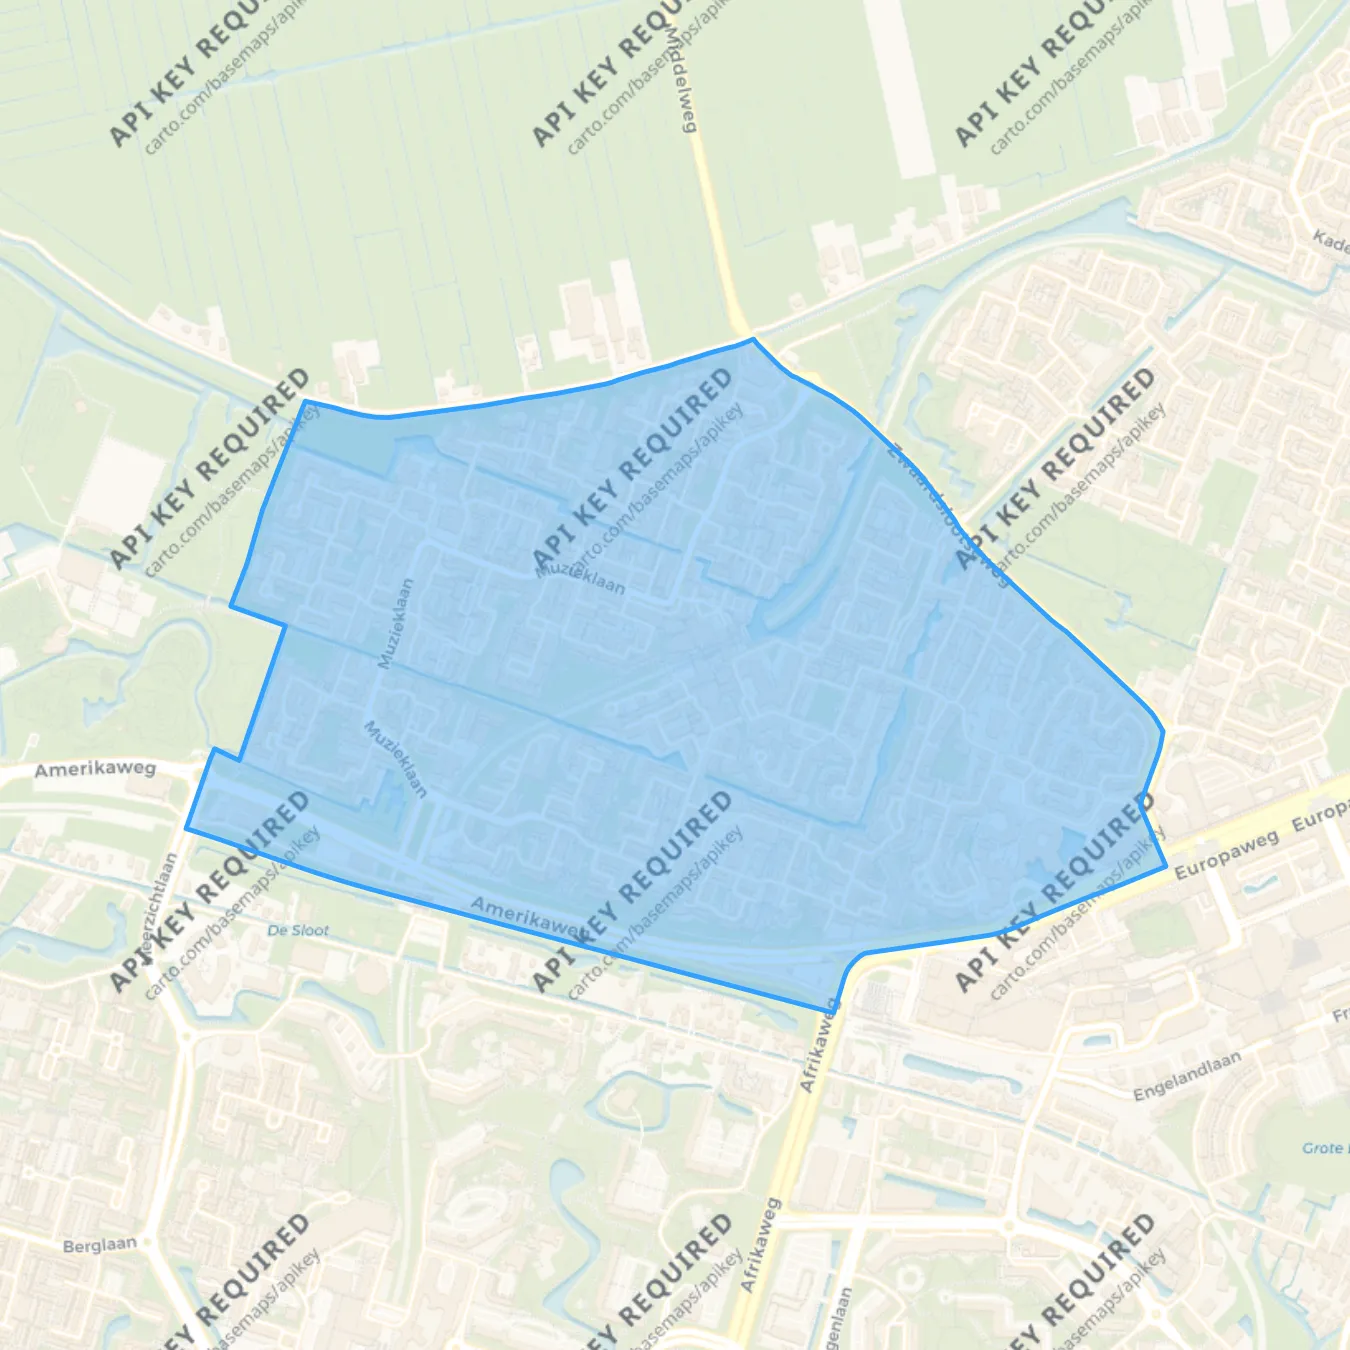
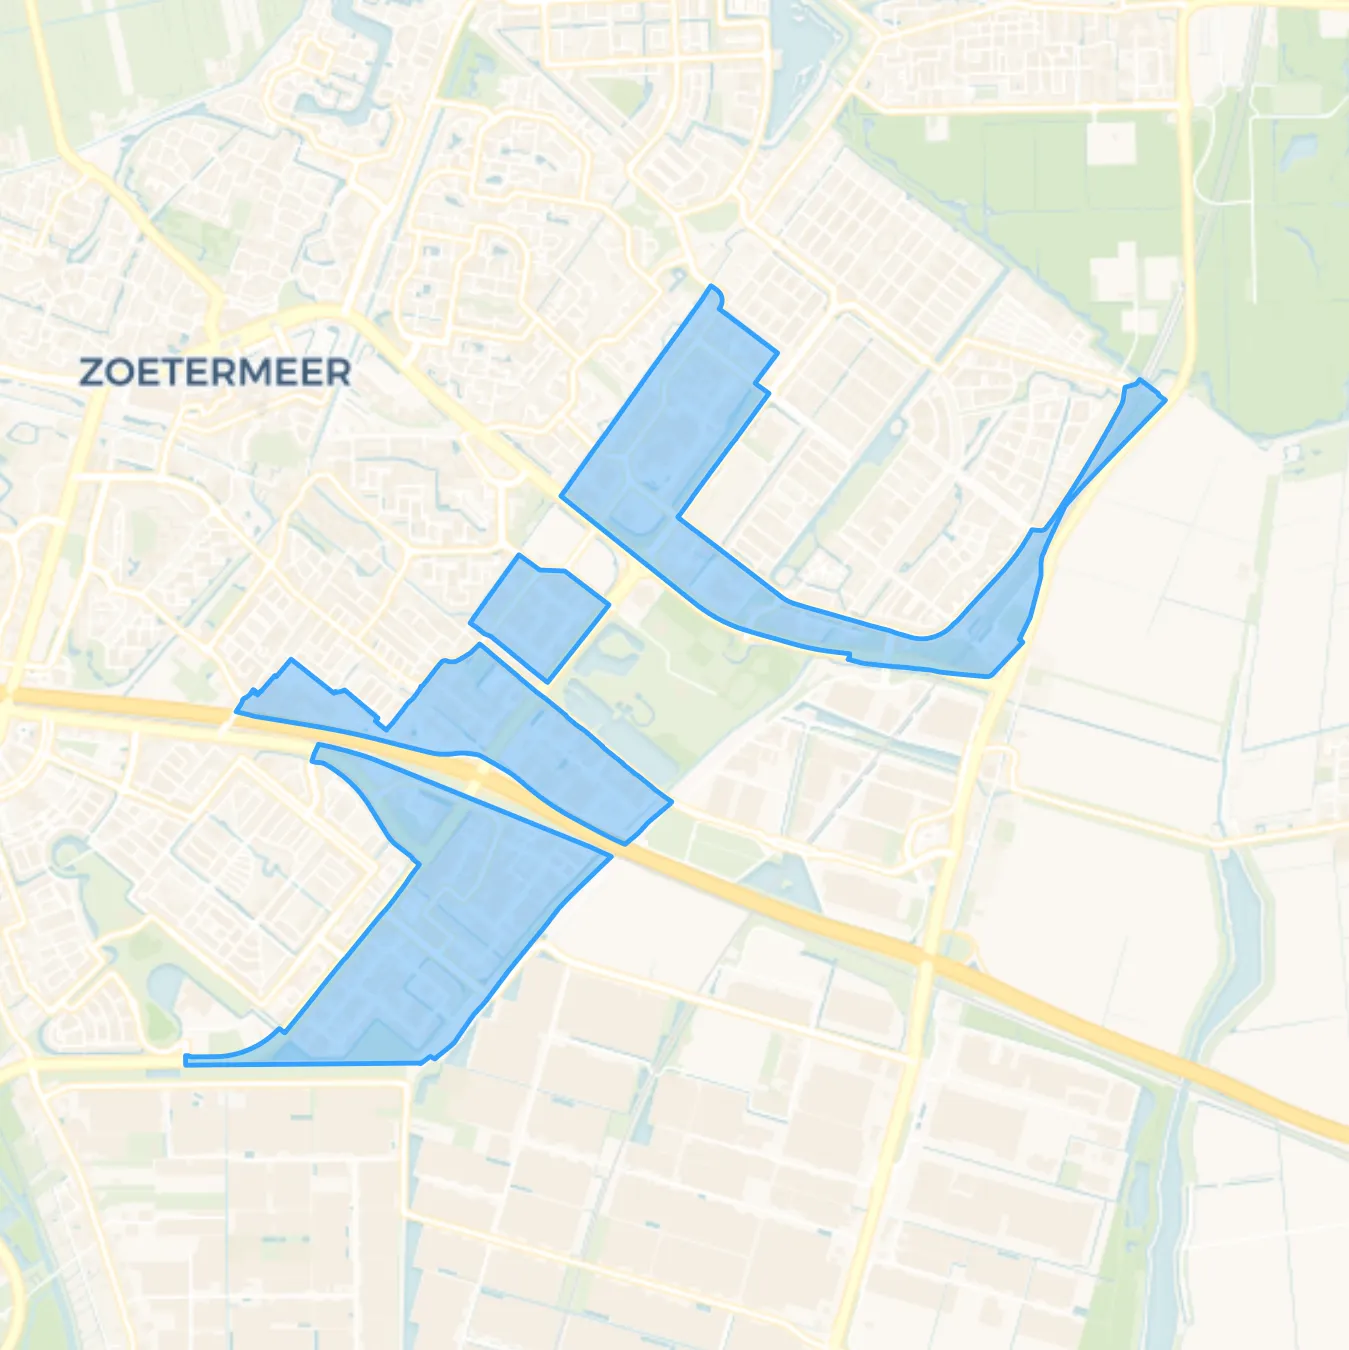
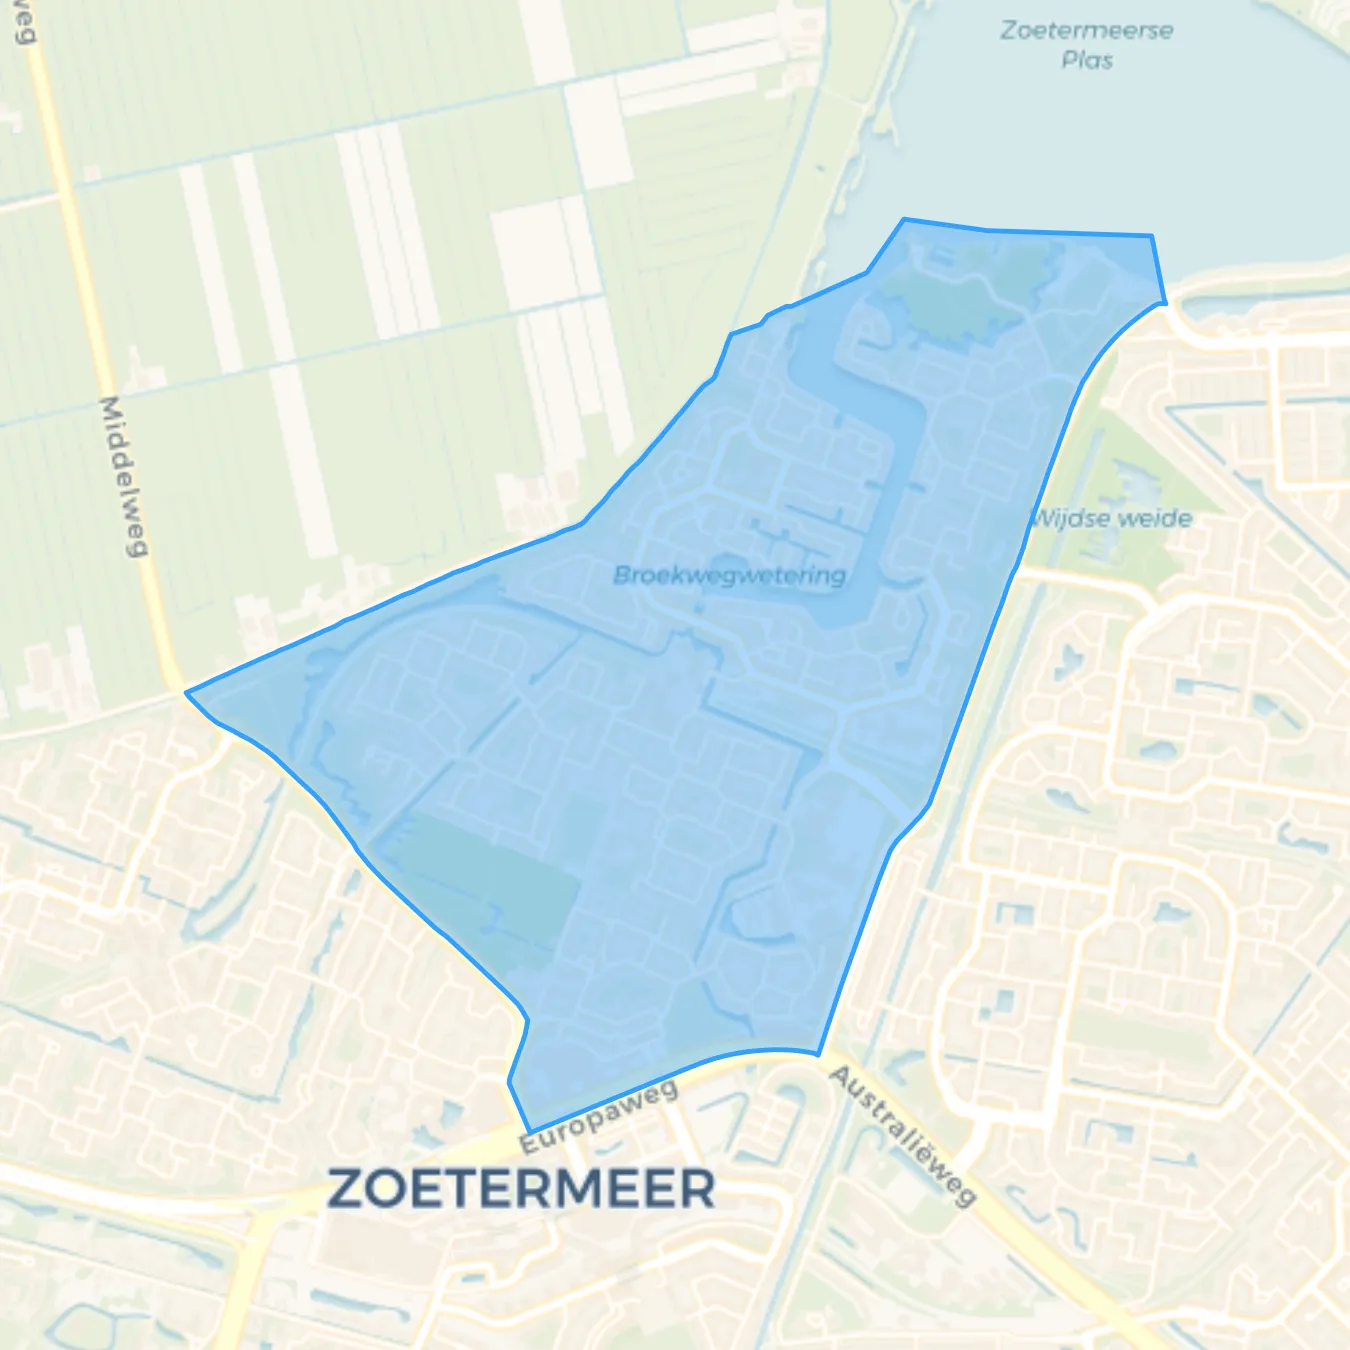


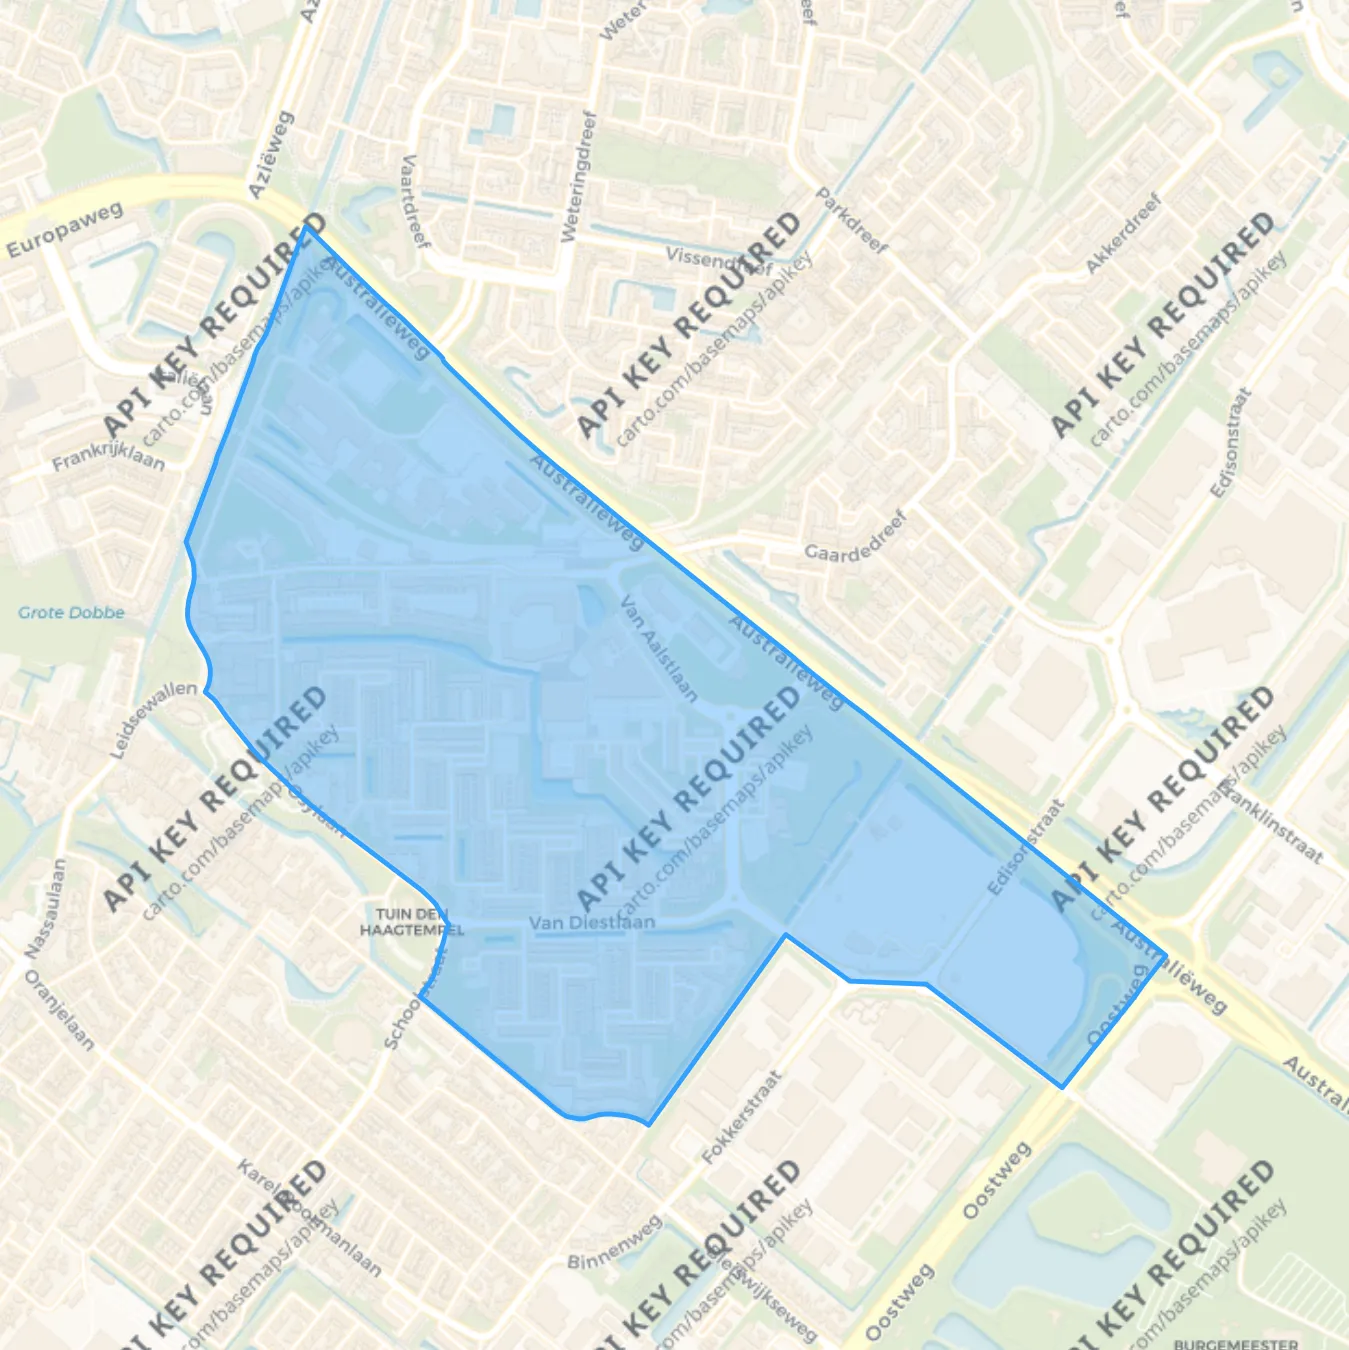
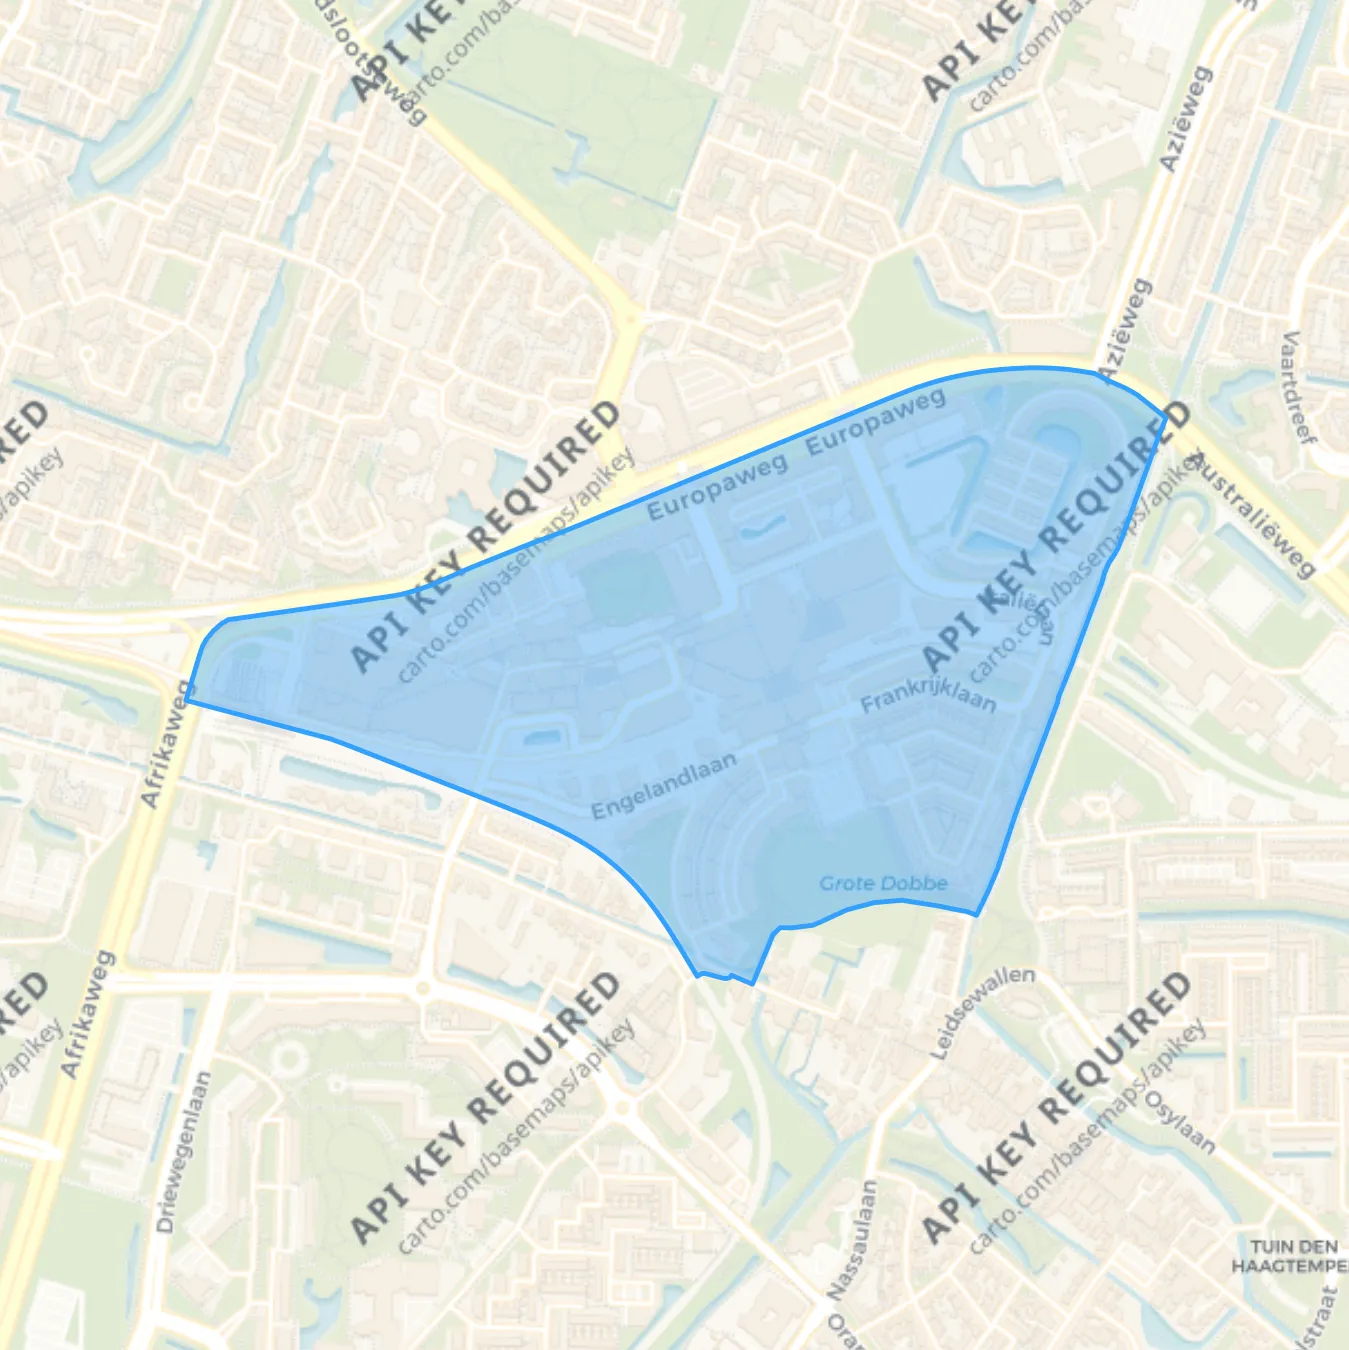


I live here with great pleasure. It is a quiet, green and pleasant neighbourhood where you can enjoy walking and nature. Everything you need is nearby (such as shops, public transport and other amenities). The neighbours are friendly and helpful, and there is a pleasant atmosphere. I feel safe here and can definitely recommend this neighbourhood.
Auto-translated to English by AIVery nice and cosy neighbourhood to live in.
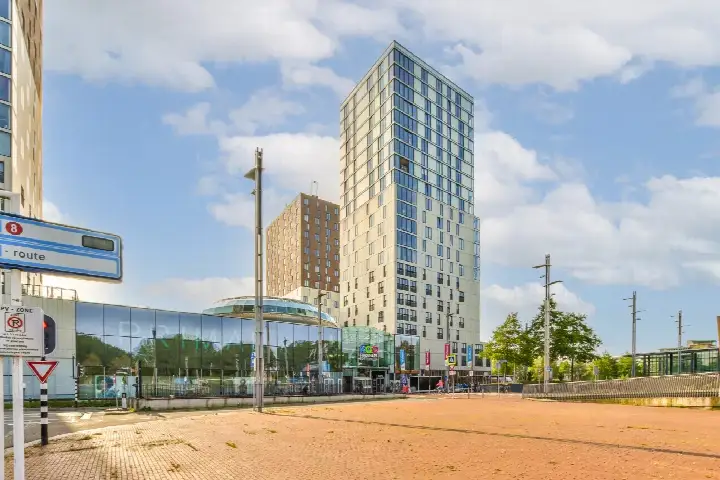
Auto-translated to English by AIWe live in a beautiful apartment on the Bentwoud and enjoy it every day in every season! The Bentwoud in particular is excellently maintained!!! The synergy and looking out for each other in the apartment complex disappoints us! That could be better! Otherwise, we live here just fine, and we also feel safe here!
Auto-translated to English by AIWe live on the Bentwoud, and you can see, smell and feel it! I always have the feeling that we live in a healthy environment! We also feel safe in the beautiful apartment building. The only thing that disappoints us is the sense of community in our complex Panoramique Bentwoud. Neighbours hardly know each other and have little interest in others. We often organise something but there is little to no interest, a shame especially because there are many elderly people living there who could use some help and/or attention!
Auto-translated to English by AIWe live in a nice neighbourhood, sometimes there's a bit of trouble but where isn't there. Lovely house, nice neighbours and everything is easily accessible. In our flat we help each other when needed and there's also social control. We're having a great time here.
Auto-translated to English by AIWe have shops, a tram and other businesses in the neighbourhood, such as a gym to provide for us. There are many trees and nature here, which makes it very quiet. Only it is often dirty and dull-coloured buildings that made the neighbourhood a bit boring.
Auto-translated to English by AIThe neighborhood is really quiet, sometimes too quiet in my opinion.
Auto-translated to English by AIToo few amenities
Auto-translated to English by AIThe housing stock is mainly post-war — 63% was built between 1945 and 1990. In addition, the most common type is flats (46%).
Over the past year a home for sale in Zoetermeer was listed for an average of €483,227 (€4,258 per m²).
A rental home in Zoetermeer cost an average of €1,619 per month (€18 per m²). That is 25% below the national average.
Residents give Zoetermeer a 7.5 out of 10 based on 39 reviews. Accessibility stands out with a 8.1; cleanliness lags behind with a 6.8.
Gemeente Zoetermeer has 129,862 residents. Many families: 37% of the households have children.
The housing supply in Zoetermeer is remarkably efficient: 58% has an A, A+ or B label. The average natural gas consumption per household is 670 m³ per year.
From Zoetermeer you can on average reach a supermarket at 0.8 km, a GP at 0.9 km, a railway station at 3.4 km, a primary school at 0.6 km (as the crow flies, source: CBS).
Right now you will find 399 homes for sale and 84 homes for rent in Zoetermeer.