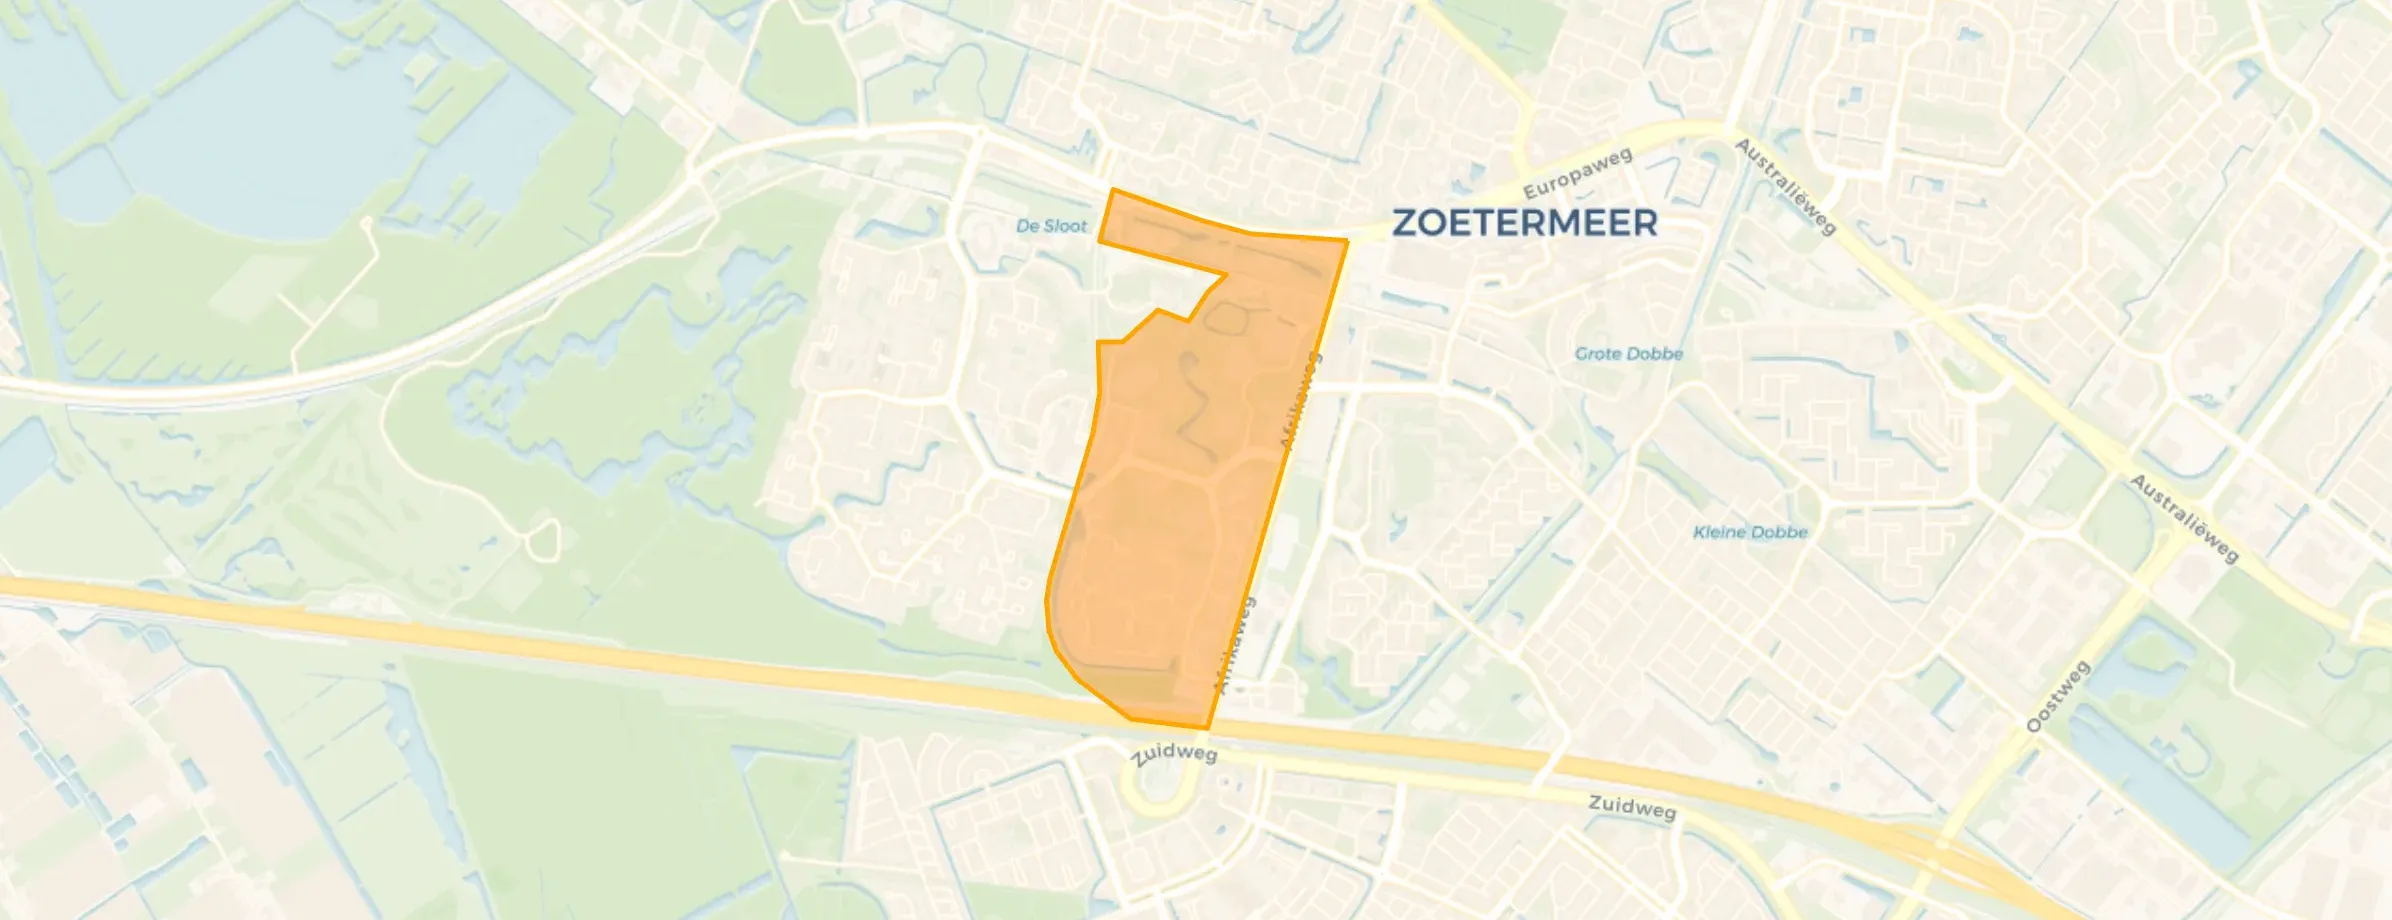
Neighbourhood in Zoetermeer
Meerzicht-Oost is located in the province of Zuid-Holland, in the municipality of Zoetermeer, in the district Meerzicht The neighbourhood has a total area of 89 hectares, of which 88 hectares are land and 2 hectares are water. The neighbourhood is coded as BU06370101. The postcode area is 2715AA-2716VD.
Three residents rate the neighbourhood as good with a score of 7.2. They describe it as 'Very satisfied', 'Green poverty' and 'Multicultural society'. Aspects such as community, education, safety are rated well in this neighbourhood, while housing and cleanliness score less well.
Meerzicht-Oost has 6.365 residents. Of these, 47,5% are men and 52,5% are women. Most residents are 25 to 45 years (27,3%). The other age groups are 22,9% for '45 to 65 years', 22,2% for '65 years or older', 16,5% for '0 to 15 years' and 11,2% for '15 to 25 years'. Of the residents, 52,5% is unmarried, 28,9% is married, 12,9% is divorced and 5,7% is widowed. 3.220 residents originate from the Netherlands, 685 come from Europe and 2.465 come from countries outside Europe.
There are 3.315 households in Meerzicht-Oost. 49,5% of these are single-person households, 20,4% households without children and 30,2% households with children. The average household size is 1,9 persons.
In Meerzicht-Oost there are 4.900 income recipients. The average income per income recipient is €30.700, which is €5.100 (14%) lower than the national average of €35.800. Per resident, the average income is €25.100, which is €4.100 (14%) lower than the national average of €29.200. Most residents of Meerzicht-Oost are educated to an intermediate level. 43,9% have an intermediate education (HAVO, VWO or MBO 2-4), 33,9% have a lower education (VMBO or MBO 1) and 22,3% have a university or higher professional education (HBO/WO).
Of the 6.365 residents, around 57% are in paid employment, which amounts to 3.628 people. This is 8% lower than the national average of 65%. The majority of workers are in salaried employment (88%), while 12% are self-employed. In Meerzicht-Oost, 31% of residents receive a benefit. The largest group is those receiving a state pension (AOW). 1.250 people receive this benefit.
In Meerzicht-Oost there are 3.108 homes with an average assessed value (WOZ) of €260.000. Of these, around 98% are occupied and 2% unoccupied. Most homes are rental properties. This amounts to 60% rental homes and 40% owner-occupied homes. Of the homes, 40% privately owned, 54% owned by housing associations and 6% owned by other landlords. The most common construction periods in Meerzicht-Oost are 1970-1980 (93%) and 2000-2010 (4%).
There are currently 21 homes for sale in Meerzicht-Oost. The most recently listed home is Jonkerbos 29 by Ooms Makelaars Lansingerland. Over the past year, 87 homes were sold in Meerzicht-Oost. On average, a home was sold within 40 days.
The average asking price for a home for sale in Meerzicht-Oost over the past year was €363.156. This is 40% higher than the average assessed value (WOZ) of €260.000. The average asking price per m² of plot is €3.426.
There is 1 homes for rent in Meerzicht-Oost. The most recent home is Albrandswaard 349, offered by www.woonnet-haaglanden.nl. Over the past year, 16 homes were let in Meerzicht-Oost. On average, a listing was let within 18 days.
No recent rental data available for Meerzicht-Oost.
In Meerzicht-Oost there are 3.132 addresses with a registered energy label. The most common labels are E (22%), A (17%) and C (16%). On average, an address in Meerzicht-Oost uses 2.530 kWh of electricity per year. This is 10% below the national average of 2.810 kWh. With an annual consumption of 790 m³ per address, natural gas consumption is 38% below the national average of 1.280 m³.
I live here with great pleasure. It is a quiet, green and pleasant neighbourhood where you can enjoy walking and nature. Everything you need is nearby (such as shops, public transport and other amenities). The neighbours are friendly and helpful, and there is a pleasant atmosphere. I feel safe here and can definitely recommend this neighbourhood.
Auto-translated to English by AIMeerzicht used to be a beautiful green neighbourhood, with many lovely tall trees and shrubs, rich in birds, bird concerts at various times from early morning to late evening. Benches in the park and other spots every few hundred metres where you could safely enjoy and meet others. Now too many tall trees have been cut down, often for completely unclear reasons, a park with only a few trees, almost all shrubs cut to the ground, hardly any benches left. It has become quiet. Birds are no longer allowed to be fed, they have nowhere to nest, benches are gone. Vandalism, unsafety, pollution, litter, decay and loneliness are visibly increasing. People no longer want to know each other. This is not only due to the increased multicultural society, although it does contribute to it. Children learn little in that regard, compared to the stricter upbringing in the past at home, at school and being addressed on the street. There are so many studies on how important trees and well-maintained greenery are for the social climate and behaviour in a neighbourhood. Trees provide oxygen, air purification, shade and coolness in the heat and shelter, noise reduction, besides all the animals, insects, birds that live in them. People behave better in a well-maintained green neighbourhood. That is why this large-scale removal of all greenery is incomprehensible and almost criminal. There is far too little replacement planting. We cannot enjoy what might have a chance in fifty years to survive the blunt axes. And there are no benches to rest for a moment and for social contacts. We are stuck with green poverty now, vanished birds, loneliness.
Auto-translated to English by AIThe neighbourhood is really deteriorating. Unsafe feeling. Go outside as little as possible in the dark. There are quite a few polluters who couldn't care less. Litter, cigarette butts, vandalism, drugs, damaged cars, burglaries, occasional loud noise, fireworks all year round. Parking nuisance and traffic jams on Fridays. People don't dare to address each other. A number of volunteers try to make improvements by picking up rubbish and such, nice neighbourhood initiatives for their own flat or street, neighbourhood management tries to help improve, municipal subsidy for that. In combination with sustainability actions we are waiting for. All ages. So facilities for the elderly are also needed, I've been calling for more benches, a community garden, low-threshold meeting spaces for all target groups for years. All of that used to be there and that's how there was more community in the literal sense. Since Palenstein moved in this direction, deterioration has accelerated rapidly. We have a RandstadRail stop, but there is no longer a neighbourhood bus, much too far to walk if you live further away. The flats and shopping centre are old and urgently need a thorough renovation. A lot of deferred maintenance. There is also an urgent need for housing here. Although some are occupied by people who have them for free and are themselves long-term in their home country. There are many primary schools in this district. I don't have children myself, so I can't judge the quality. Far too many trees have been cut down, bushes removed, birds can hardly find perches anymore, so there are few. We can hardly attract them by feeding because of severe mice and rat infestation. The park is far too bare. Due to a water project, many old large trees have disappeared and little replanting. And many more tree removals are on the list. Maintenance and care of existing greenery is apparently too expensive. There are tree doctors who could possibly help the old trees too. Much more greenery should be added, also on the flats, galleries, etc. For appearance, birds, insects, bees and butterflies especially. It also makes people happier and more involved and reduces vandalism. That's psychologically proven. Monthly bulky waste collection should return. Possibly a different day per district or group of streets. That would save a lot of illegal dumping. And who knows, promote recycling. Due to vandalism, we cannot place a mini library or give-away boxes, not even a notice board with offers, even though there is a need for that. In the past, there were many spaces that could be rented cheaply by associations and small entrepreneurs. Around the shopping centre. The range of shops was also much more complete with a Blokker, DIY store, shoe shop, heel bar, Jamin, Readshop, etc. Now everything is gone and unaffordable. Many people try to move to better neighbourhoods. There is loneliness. Someone lay dead in their house for four months and that's not the first time. Days, weeks have also occurred. The environment is not really inspiring, little involvement due to the deterioration and few free or cheap options.
Auto-translated to English by AIThe housing stock is mainly post-war — 94% was built between 1945 and 1990. In addition, the most common type is flats (82%).
Over the past year a home for sale in Meerzicht-Oost was listed for an average of €342,866 (€3,428 per m²). Last quarter prices fell by 7%.
A considerable share of the supply in Meerzicht-Oost is less efficient: 51% has an E, F or G label. The average natural gas consumption per household is 790 m³ per year.
From Meerzicht-Oost you can on average reach a supermarket at 1.0 km, a GP at 0.9 km, a railway station at 2.7 km, a primary school at 0.6 km (as the crow flies, source: CBS).
Right now you will find 15 homes for sale in Meerzicht-Oost.
