Neighbourhood in Rotterdam
Bergpolder is located in the province of Zuid-Holland, in the municipality of Rotterdam, in the district Noord The neighbourhood has a total area of 45 hectares, of which 44 hectares are land and 1 hectares are water. The neighbourhood is coded as BU05990531. The postcode area is 3037BK-3038XZ.
Five residents rate the neighbourhood as more than satisfactory with a score of 6.5. They describe it as 'Good', 'Quiet neighbourhood with room for improvement' and 'Worthless damp house in winter..and bloody sweltering hot in summer..and the neighbourhood is also Dutch unfriendly'. Residents experience big differences in this neighbourhood: education, accessibility, community receive high ratings, while cleanliness and housing are mentioned as weak points.
Bergpolder has 8.050 residents. Of these, 50,5% are men and 49,5% are women. Most residents are 25 to 45 years (55,0%). The other age groups are 16,6% for '45 to 65 years', 13,7% for '15 to 25 years', 7,7% for '0 to 15 years' and 7,1% for '65 years or older'. Of the residents, 79,5% is unmarried, 13,0% is married, 6,1% is divorced and 1,5% is widowed. 4.100 residents originate from the Netherlands, 1.375 come from Europe and 2.575 come from countries outside Europe.
There are 5.255 households in Bergpolder. 63,7% of these are single-person households, 24,3% households without children and 12,1% households with children. The average household size is 1,5 persons. The national average is 2,1 persons.
In Bergpolder there are 7.200 income recipients. The average income per income recipient is €43.600, which is €1.400 (3%) higher than the national average of €42.200. Per resident, the average income is €39.100, which is €4.200 (12%) higher than the national average of €34.900. Most residents of Bergpolder are highly educated. 57,9% have a university or higher professional education (HBO/WO), 26,8% have an intermediate education (HAVO, VWO or MBO 2-4) and 15,3% have a lower education (VMBO or MBO 1).
Of the 8.050 residents, around 78% are in paid employment, which amounts to 6.279 people. This is 6% higher than the national average of 72%. The majority of workers are in salaried employment (85%), while 15% are self-employed. In Bergpolder, 14% of residents receive a benefit. The largest group is those receiving a state pension (AOW). 480 people receive this benefit.
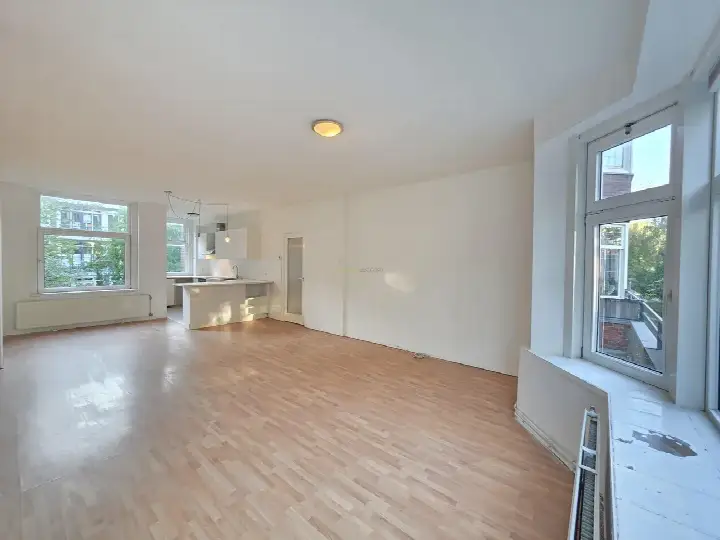
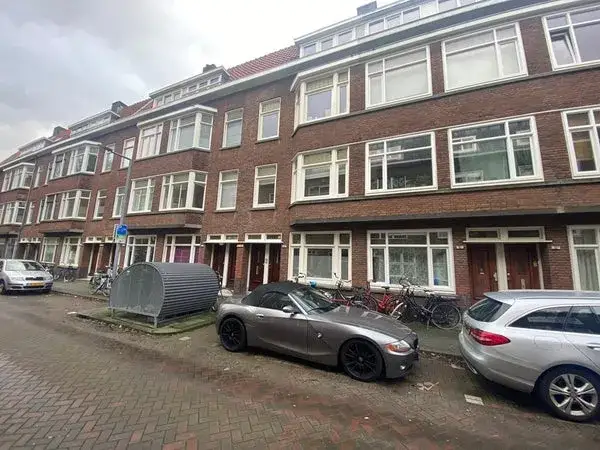
In Bergpolder there are 4.872 homes with an average assessed value (WOZ) of €317.000. Of these, around 93% are occupied and 7% unoccupied. Most homes are rental properties. This amounts to 64% rental homes and 36% owner-occupied homes. Of the homes, 36% privately owned, 20% owned by housing associations and 44% owned by other landlords. The most common construction periods in Bergpolder are 1925-1950 (85%) and 1950-1970 (6%).
There are currently 98 homes for sale in Bergpolder. The most recently listed home is De Savornin Lohmanlaan 91B by TW3 Strategie Marketing Makelaardij op Funda. Over the past year, 657 homes were sold in Bergpolder. On average, a home was sold within 55 days.
The average asking price for a home for sale in Bergpolder over the past year was €375.806. This is 19% higher than the average assessed value (WOZ) of €317.000. The average asking price per m² of plot is €4.421.
There are 24 homes for rent in Bergpolder. The most recent home is Luzacstraat 16A02, offered by Tweelwonen Leiden B.V.. Over the past year, 203 homes were let in Bergpolder. On average, a listing was let within 28 days.
The average rent for a rental home in Bergpolder over the past year was €2.450 per month. Per m² of plot area that is €26 per month.
In Bergpolder there are 4.092 addresses with a registered energy label. The most common labels are C (29%), D (20%) and B (15%). On average, an address in Bergpolder uses 1.710 kWh of electricity per year. This is 33% below the national average of 2.550 kWh. With an annual consumption of 680 m³ per address, natural gas consumption is 15% below the national average of 800 m³.
Since I've been living here, I've come across friendly people.
Auto-translated to English by AIBergpolder has improved significantly in recent years. Many apartments have been renovated, there is an influx of nice new residents, and the location is ideal. You do notice a clear difference in lifestyle between the old and new residents, but that is not disturbing in itself. Gentrification is underway, following the surrounding neighbourhoods, but is somewhat controlled by the large stock of (social) rental homes in the area. The result is that you can literally meet anyone here, from yuppie to student to family to asylum seeker. Everyone lives together harmoniously, but within their own bubble. Houses are old, very old, so they often need some love if they haven't been renovated yet. But the location is perfect, and there are many beautiful inner gardens that compensate for the bare streets. Everything you need is within walking distance. I think the arrival of the Hofbogenpark will give the neighbourhood a further boost. The greenery is still a bit sparse in some places in the area.
Auto-translated to English by AIUnfriendly neighbourhood..everyone on their own island..houses damp and poor in winter..bloody hot in summer.
Auto-translated to English by AINice neighbourhood, often many outings and organisations that are made here for children as well as for adults, good causes are achieved and good environment
Auto-translated to English by AIFairly quiet living, though expensive, the Schieweg is often messy and there should be more benches in the neighbourhood. Here and there some green spots to enjoy nature. Supermarkets are a bit of a walk away, but there's a chip shop and a convenience store on every street corner. The Schieweg also has its own tram stop with frequent trams. Buses are scarce in the area.
Auto-translated to English by AIThe housing stock is predominantly pre-war — 90% of the homes date from before 1945. In addition, the most common type is flats (99%).
Over the past year a home for sale in Bergpolder was listed for an average of €375,461 (€5,245 per m²). That is 29% below the Dutch national average. Last quarter prices rose by 13%.
A rental home in Bergpolder cost an average of €1,793 per month (€24 per m²). That is 17% below the national average.
Residents give Bergpolder a 6.5 out of 10 based on 5 reviews. The strongest score is for education (9.0), the weakest for housing (5.6).
Buurt Bergpolder has 8,050 residents. The largest age group is 25 to 45 years (55%). Notably, 64% of the households are single-person households.
From Bergpolder you can on average reach a supermarket at 0.6 km, a GP at 0.5 km, a railway station at 2.2 km, a primary school at 0.5 km (as the crow flies, source: CBS).
Right now you will find 119 homes for sale and 18 homes for rent in Bergpolder.