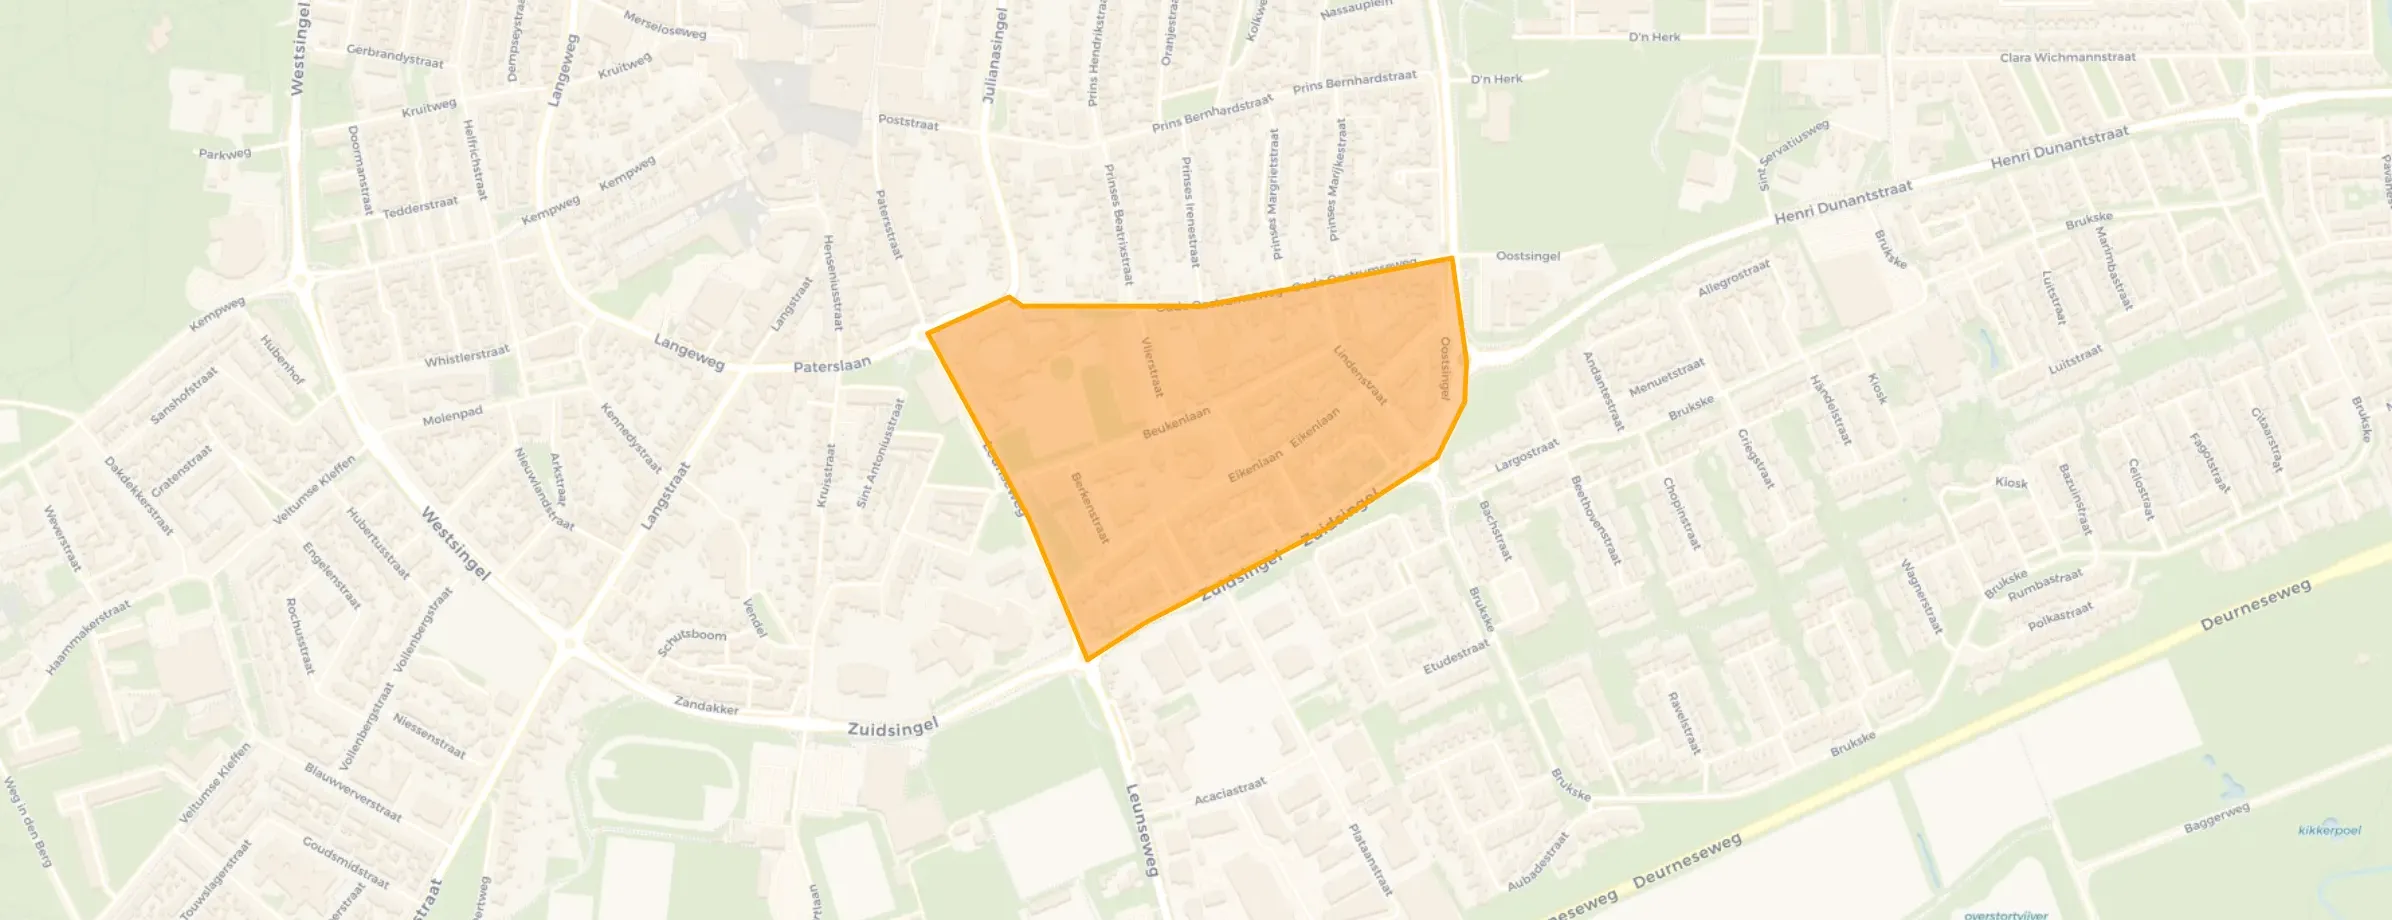
Neighbourhood in Venray
Bomenbuurt is located in the province of Limburg, in the municipality of Venray, in the district Oost The neighbourhood has a total area of 16 hectares, of which 16 hectares are land and 0 hectares are water. The neighbourhood is coded as BU09841203. The postcode area is 5802AP-5802EE.
Bomenbuurt has 840 residents. Of these, 47,6% are men and 52,4% are women. Most residents are 65 years or older (36,9%). The other age groups are 22,6% for '45 to 65 years', 22,0% for '25 to 45 years', 11,3% for '0 to 15 years' and 7,1% for '15 to 25 years'. Of the residents, 38,7% is unmarried, 38,7% is married, 11,3% is divorced and 11,9% is widowed. 565 residents originate from the Netherlands, 90 come from Europe and 190 come from countries outside Europe.
There are 450 households in Bomenbuurt. 47,8% of these are single-person households, 32,2% households without children and 20,0% households with children. The average household size is 1,8 persons.
In Bomenbuurt there are 700 income recipients. The average income per income recipient is €27.400, which is €8.400 (23%) lower than the national average of €35.800. Per resident, the average income is €23.900, which is €5.300 (18%) lower than the national average of €29.200. Most residents of Bomenbuurt are educated to an intermediate level. 40,4% have an intermediate education (HAVO, VWO or MBO 2-4), 40,4% have a lower education (VMBO or MBO 1) and 19,3% have a university or higher professional education (HBO/WO).
Of the 840 residents, around 58% are in paid employment, which amounts to 487 people. This is 7% lower than the national average of 65%. The majority of workers are in salaried employment (88%), while 12% are self-employed. In Bomenbuurt, 46% of residents receive a benefit. The largest group is those receiving a state pension (AOW). 290 people receive this benefit.
In Bomenbuurt there are 454 homes with an average assessed value (WOZ) of €249.000. Of these, around 99% are occupied and 1% unoccupied. Most homes are rental properties. This amounts to 67% rental homes and 33% owner-occupied homes. Of the homes, 33% privately owned, 58% owned by housing associations and 9% owned by other landlords. The most common construction periods in Bomenbuurt are 1950-1970 (43%) and 2000-2010 (19%).
There are currently no homes for sale in Bomenbuurt. The most recently listed home is Beukenlaan 8 by Ovida makelaars. No homes were sold in Bomenbuurt over the past year.
There are currently no homes for rent in Bomenbuurt. The most recent home is Zuidsingel 61, offered by www.thuisinlimburg.nl. No homes were let in Bomenbuurt over the past year.
No recent rental data available for Bomenbuurt.
In Bomenbuurt there are 462 addresses with a registered energy label. The most common labels are A (35%), C (19%) and B (12%). On average, an address in Bomenbuurt uses 2.150 kWh of electricity per year. This is 23% below the national average of 2.810 kWh. With an annual consumption of 850 m³ per address, natural gas consumption is 34% below the national average of 1.280 m³.

The housing stock is mainly post-war — 61% was built between 1945 and 1990. In addition, the most common type is flats (47%).
Over the past year a home for sale in Bomenbuurt was listed for an average of €413,824 (€3,156 per m²).
Buurt Bomenbuurt has 840 residents. The largest age group is 65+ years (37%).
The housing supply in Bomenbuurt is remarkably efficient: 64% has an A, A+ or B label. The average natural gas consumption per household is 850 m³ per year.
From Bomenbuurt you can on average reach a supermarket at 0.8 km, a GP at 0.8 km, a railway station at 2.7 km, a primary school at 0.2 km (as the crow flies, source: CBS).

Buurtje.nl uses cookies to make the site work and to improve it. In doing so, we process data such as your IP address and the pages you visit.
We use this data for three purposes: running the website (functional), measuring visits so we can improve Buurtje.nl (analytics), and — if you allow it — tailoring ads to your interests (marketing).
How we handle your data is described in our privacy policy. You can change your preferences at any time via 'Cookie preferences' at the bottom of every page.
Choose per category which cookies we may place. Read more in our privacy policy.