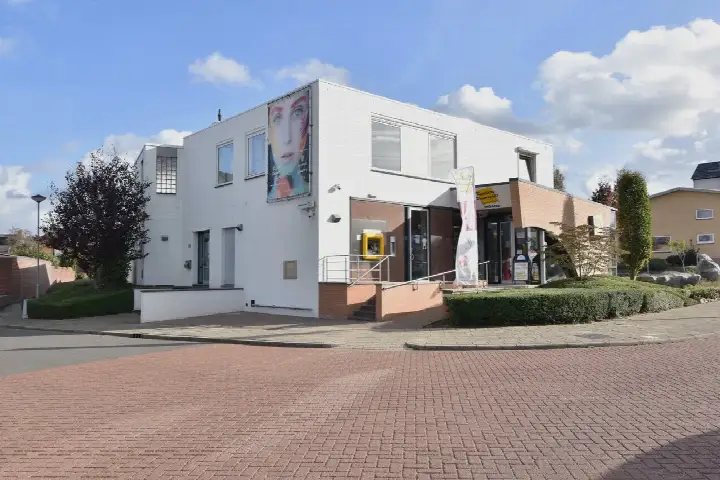
Province in the Netherlands
Limburg has a unique hilly landscape and a Burgundian lifestyle, with Maastricht as its best-known city. The province has a total area of 220.986 hectares, of which 214.465 hectares are land and 6.521 hectares are water. The province is coded as PV31. The postcode area is 5766PB-6599EG.
Limburg has 1.135.328 residents. Of these, 49,8% are men and 50,2% are women. Most residents are 45 to 65 years (27,4%). The other age groups are 25,8% for '65 years or older', 23,0% for '25 to 45 years', 12,6% for '0 to 15 years' and 11,2% for '15 to 25 years'. Of the residents, 45,5% is unmarried, 39,6% is married, 8,7% is divorced and 6,2% is widowed. 840.306 residents originate from the Netherlands, 163.743 come from Europe and 131.279 come from countries outside Europe.
There are 553.078 households in Limburg. 40,5% of these are single-person households, 31,4% households without children and 28,0% households with children. The average household size is 2,0 persons. The national average is 2,1 persons.
In Limburg there are 936.100 income recipients. The average income per income recipient is €38.796, which is €3.404 (8%) lower than the national average of €42.200. Per resident, the average income is €33.058, which is €1.842 (5%) lower than the national average of €34.900. Most residents of Limburg are educated to an intermediate level. 42,7% have an intermediate education (HAVO, VWO or MBO 2-4), 28,7% have a lower education (VMBO or MBO 1) and 28,6% have a university or higher professional education (HBO/WO).
Of the 1.135.328 residents, around 67% are in paid employment, which amounts to 760.670 people. This is 5% lower than the national average of 72%. The majority of workers are in salaried employment (85%), while 15% are self-employed. In Limburg, 32% of residents receive a benefit. The largest group is those receiving a state pension (AOW). 260.940 people receive this benefit.
In Limburg there are 551.489 homes with an average assessed value (WOZ) of €311.134. Of these, around 95% are occupied and 5% unoccupied. Most homes are owner-occupied. This amounts to 39% rental homes and 61% owner-occupied homes. Of the homes, 60% privately owned, 26% owned by housing associations and 14% owned by other landlords. The most common construction periods in Limburg are 1950-1970 (25%) and 1970-1980 (17%).
There are currently no homes for sale in Limburg. The most recently listed home is Maastrichterlaan 19 by Pickee Makelaardij op Funda. No homes were sold in Limburg over the past year.
There are currently no homes for rent in Limburg. The most recent home is Raadhuisstraat 4B, offered by STERCKWONEN. No homes were let in Limburg over the past year.
No recent rental data available for Limburg.
In Limburg there are 357.372 addresses with a registered energy label. The most common labels are A (27%), C (24%) and B (17%). On average, an address in Limburg uses 2.728 kWh of electricity per year. This is 7% above the national average of 2.550 kWh. Natural gas consumption, at 889 m³ per year, is 11% above the national average of 800 m³.


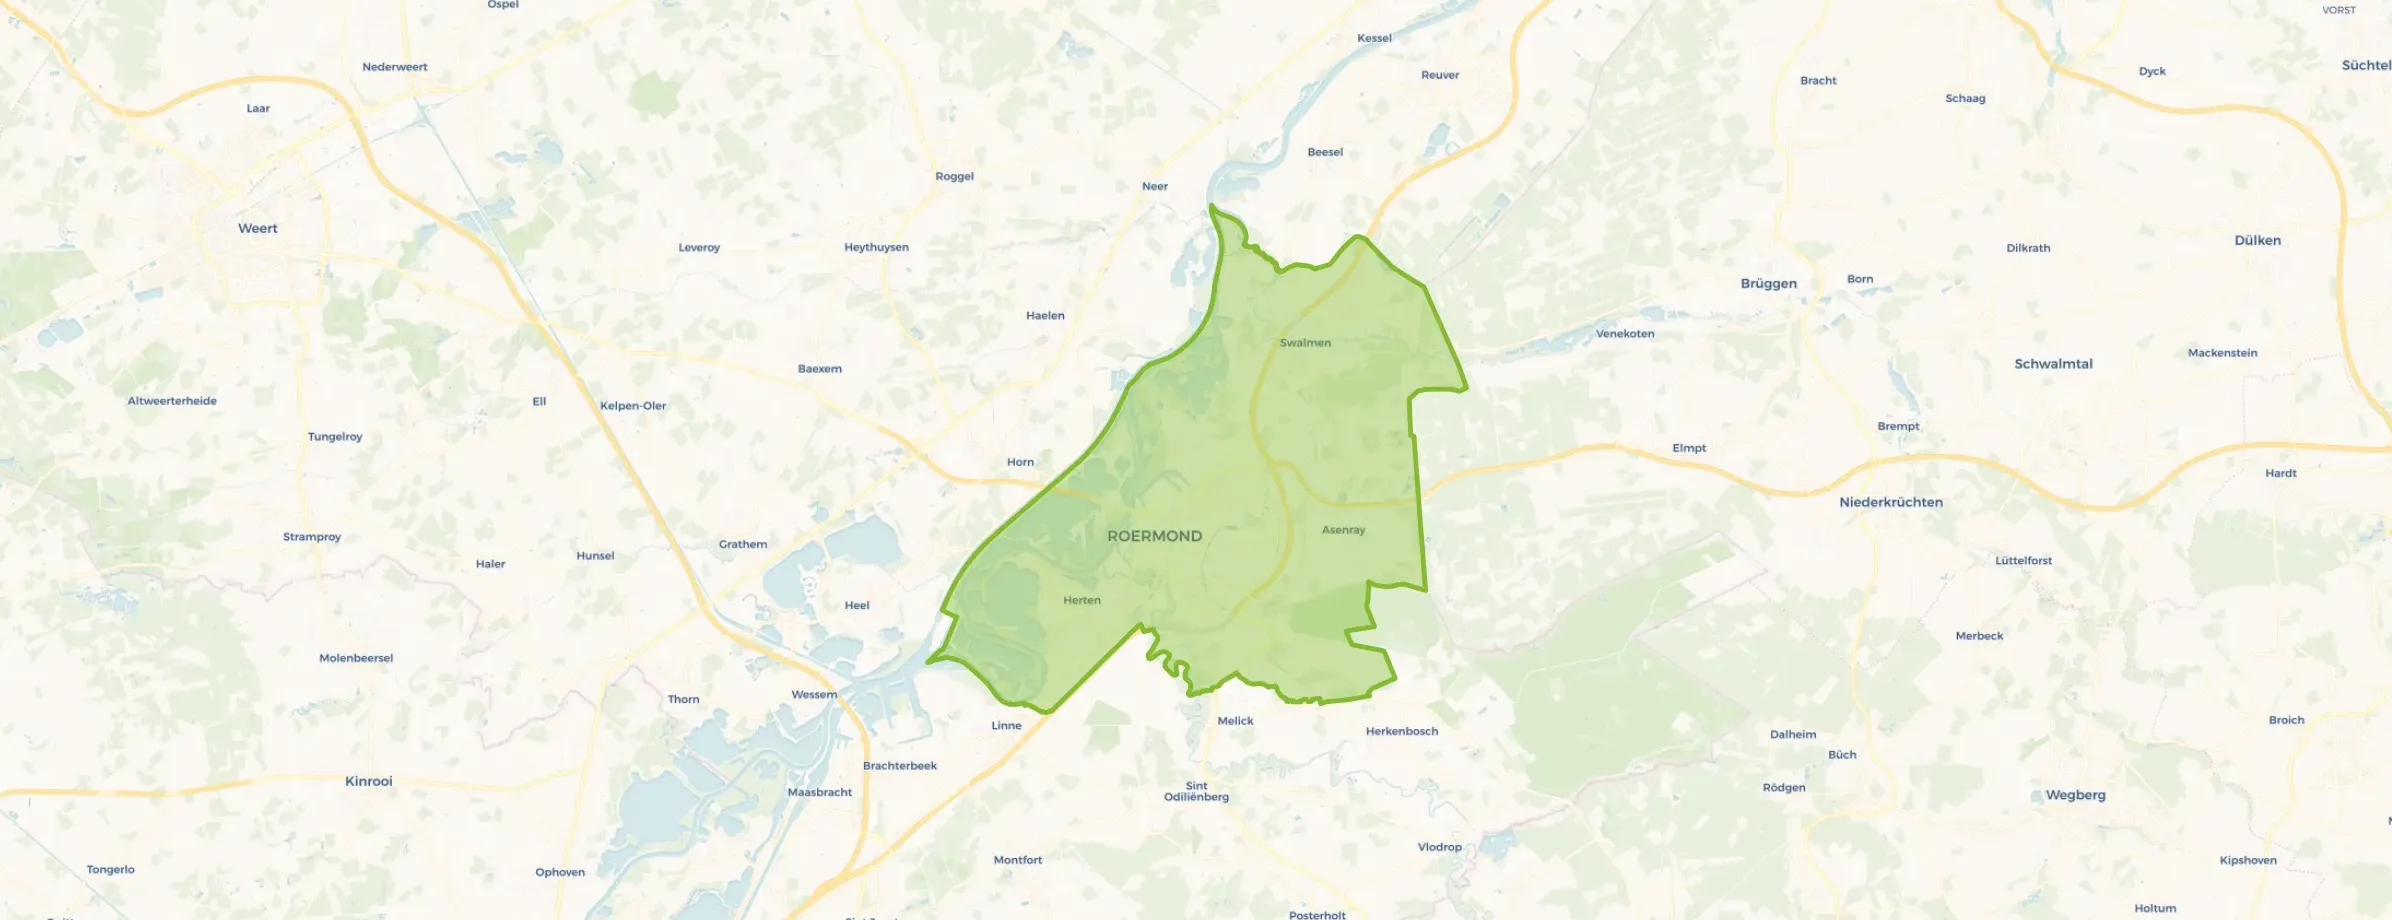


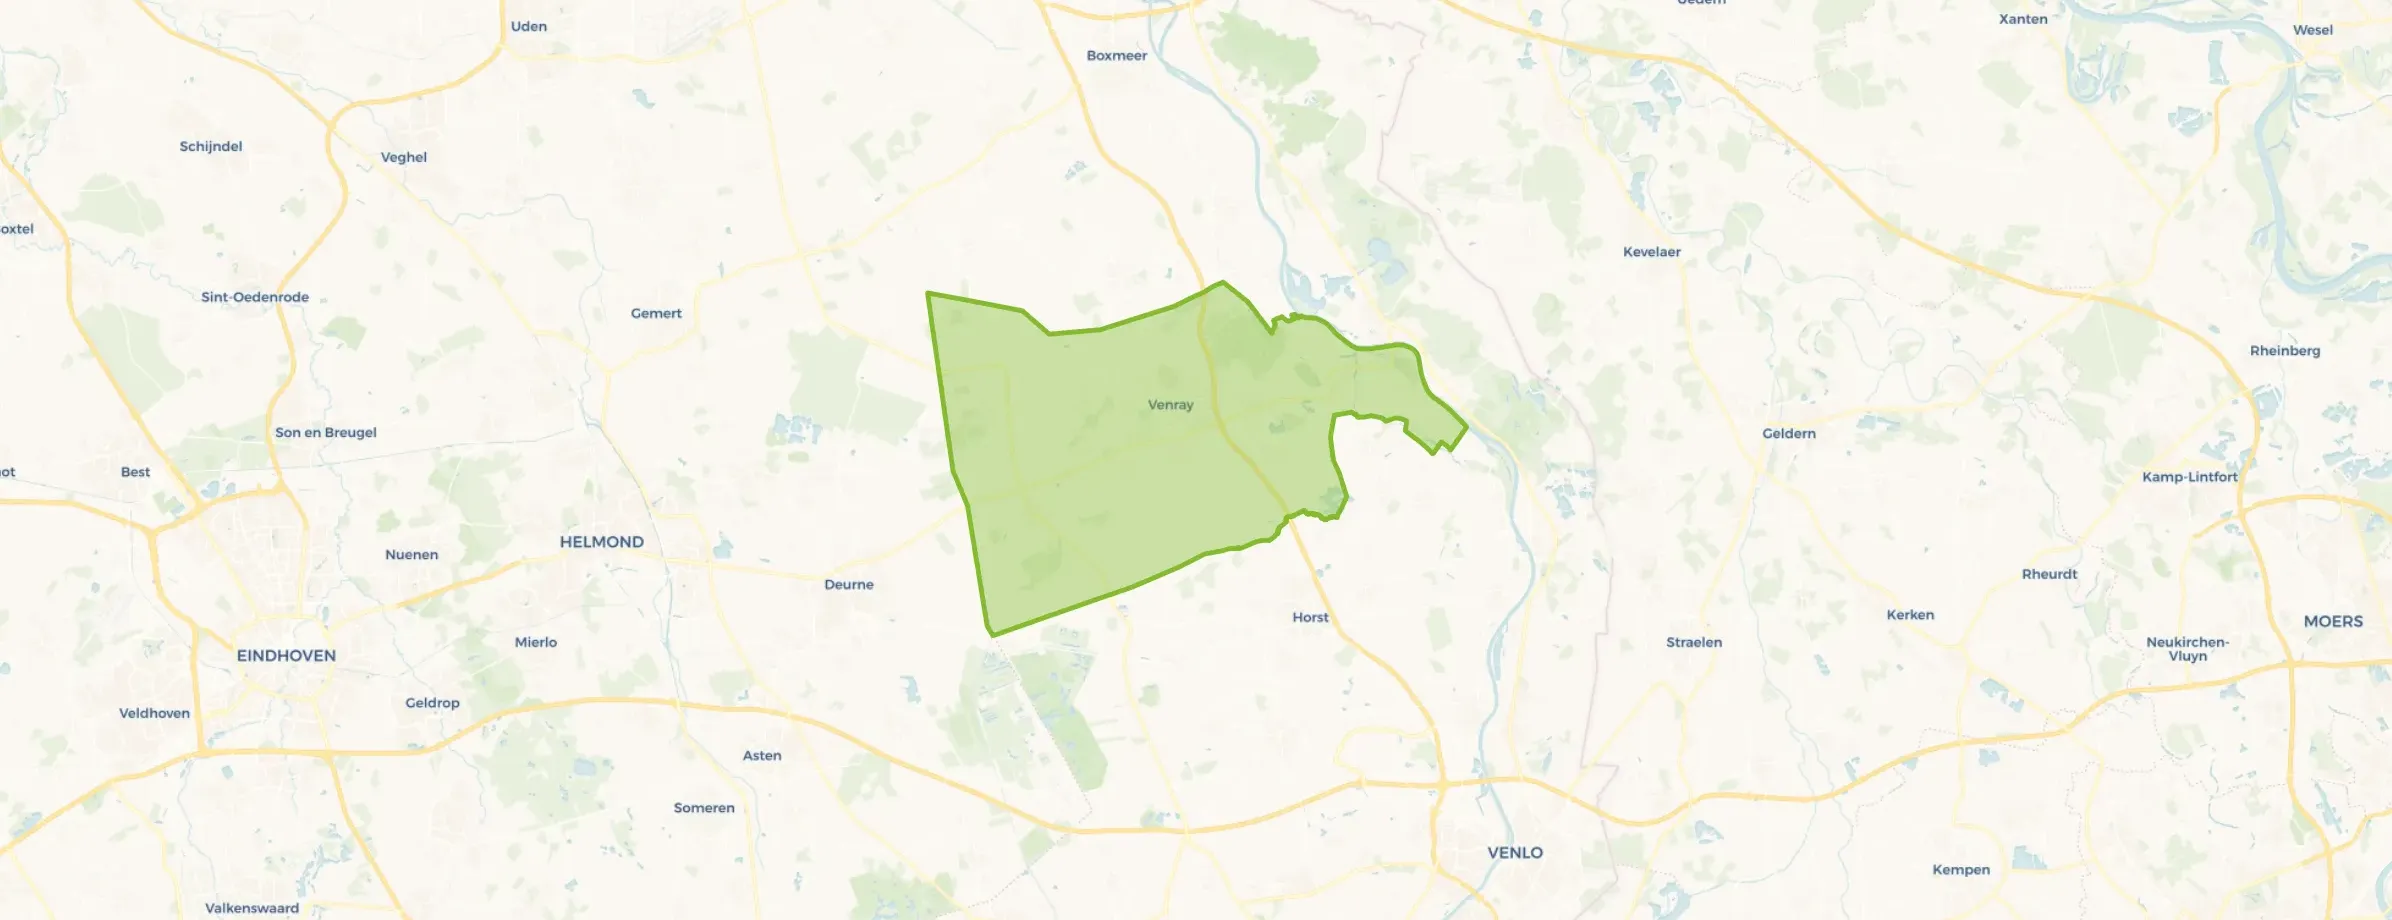
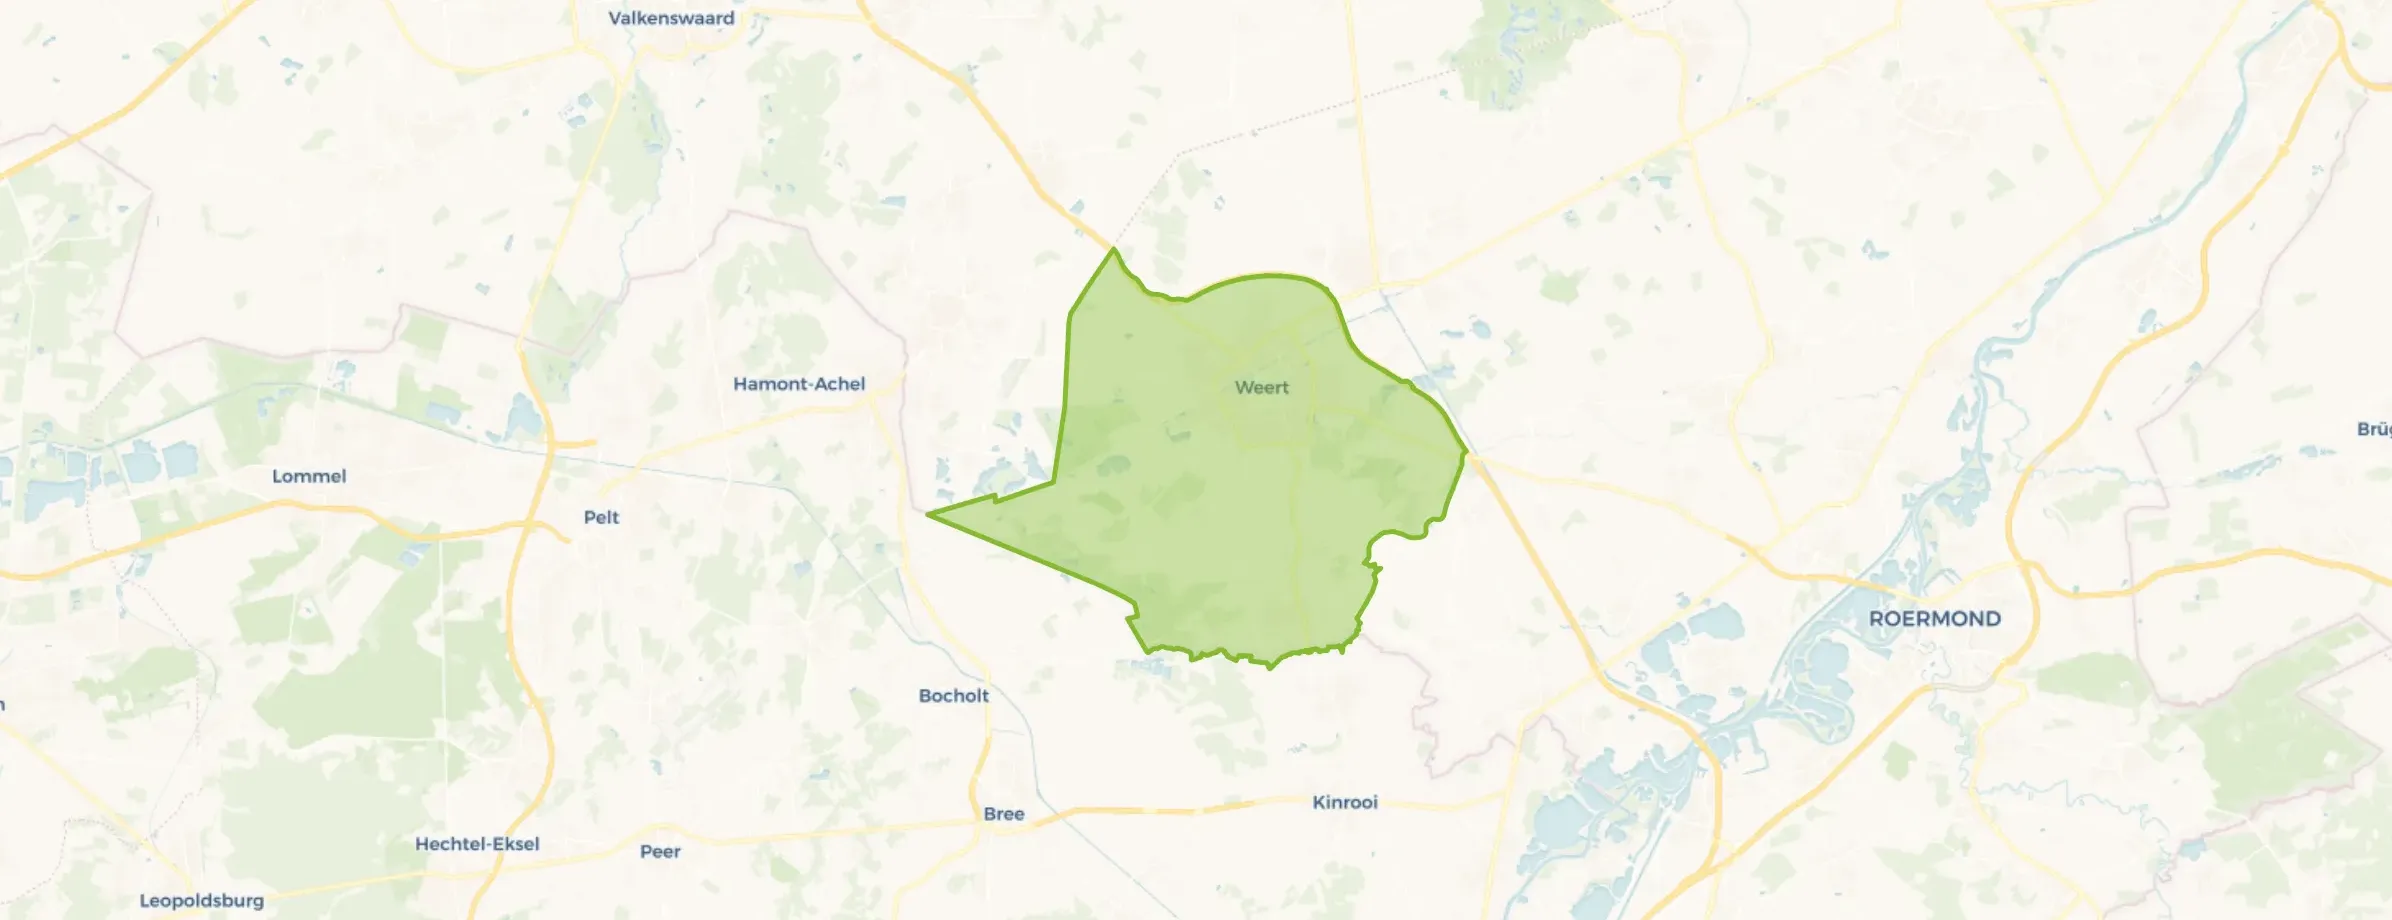









Kern Buggenum is een oude buurt, waarin met respect door de bewoners wordt geleefd. Veel samenhang en bereidheid voor elkaar.
Auto-translated to English by AIFijne buurt,gemeenschap,rustig
Auto-translated to English by AIMooie veilige groene buurt met een fijne sfeer tussen de dorpsbewoners, enige jammere is dat er geen winkels goed bereikbaar zijn, wel een restaurant, en een school in het buurdorp. Openbaar vervoer is minimaal.
Auto-translated to English by AIQuietly situated in nature on a dead-end road. Good accessibility to the city and motorway and all amenities. All types of schools within very short cycling distance.
Auto-translated to English by AII give this neighbourhood a failing grade on several important aspects. Safety feels limited due to persistent nuisance and lack of supervision. The community is not close-knit; many residents move away quickly or pass away, resulting in little social cohesion. Hygiene leaves much to be desired. There is often rubbish on the streets and public spaces are poorly maintained. Housing is also of poor quality. Many homes are in bad condition, with deferred maintenance and conditions reminiscent of slums. Furthermore, the living environment is unpleasant due to constant noise pollution and air pollution. The lack of greenery and an attractive natural environment makes the neighbourhood even less pleasant to live in. All in all, this is an area where the quality of life is low and improvement is needed in many areas. Due to the poor living conditions, noise pollution and pollution, I recommend considering another neighbourhood. Avoid this area if you value peace, safety and a clean living environment.
Auto-translated to English by AIIt's a nice neighbourhood to live in. I feel safe and most people are friendly. However, we do think the greenery is really in need of renewal, and the pavements and roads also give a somewhat outdated and neglected impression. The neighbourhood could do with a makeover and more colour. The playground in the Dassenkuil has just been newly laid out, but it's really only for a certain age group. The older children have nothing. Too bad!
Auto-translated to English by AIeverything perfect lovely people and many amenities
Auto-translated to English by AINeat and cosy neighbourhood. Quick contact with the neighbours.
Auto-translated to English by AIThe housing stock is mainly post-war — 58% was built between 1945 and 1990.
Over the past year a home for sale in Limburg was listed for an average of €433,764 (€3,044 per m²). That is 18% below the Dutch national average. Last quarter prices rose by 41%.
A rental home in Limburg cost an average of €1,316 per month (€15 per m²). That is 39% below the national average.
Residents give Limburg a 7.6 out of 10 based on 315 reviews. Especially nature and greenery (7.9) scores well; amenities (7.2) receives the lowest rating.
From Limburg you can on average reach a supermarket at 1.0 km, a GP at 1.1 km, a railway station at 3.9 km, a primary school at 0.8 km (as the crow flies, source: CBS).
Right now you will find 7,936 homes for sale and 1,332 homes for rent in Limburg.