Neighbourhood in Heerlen
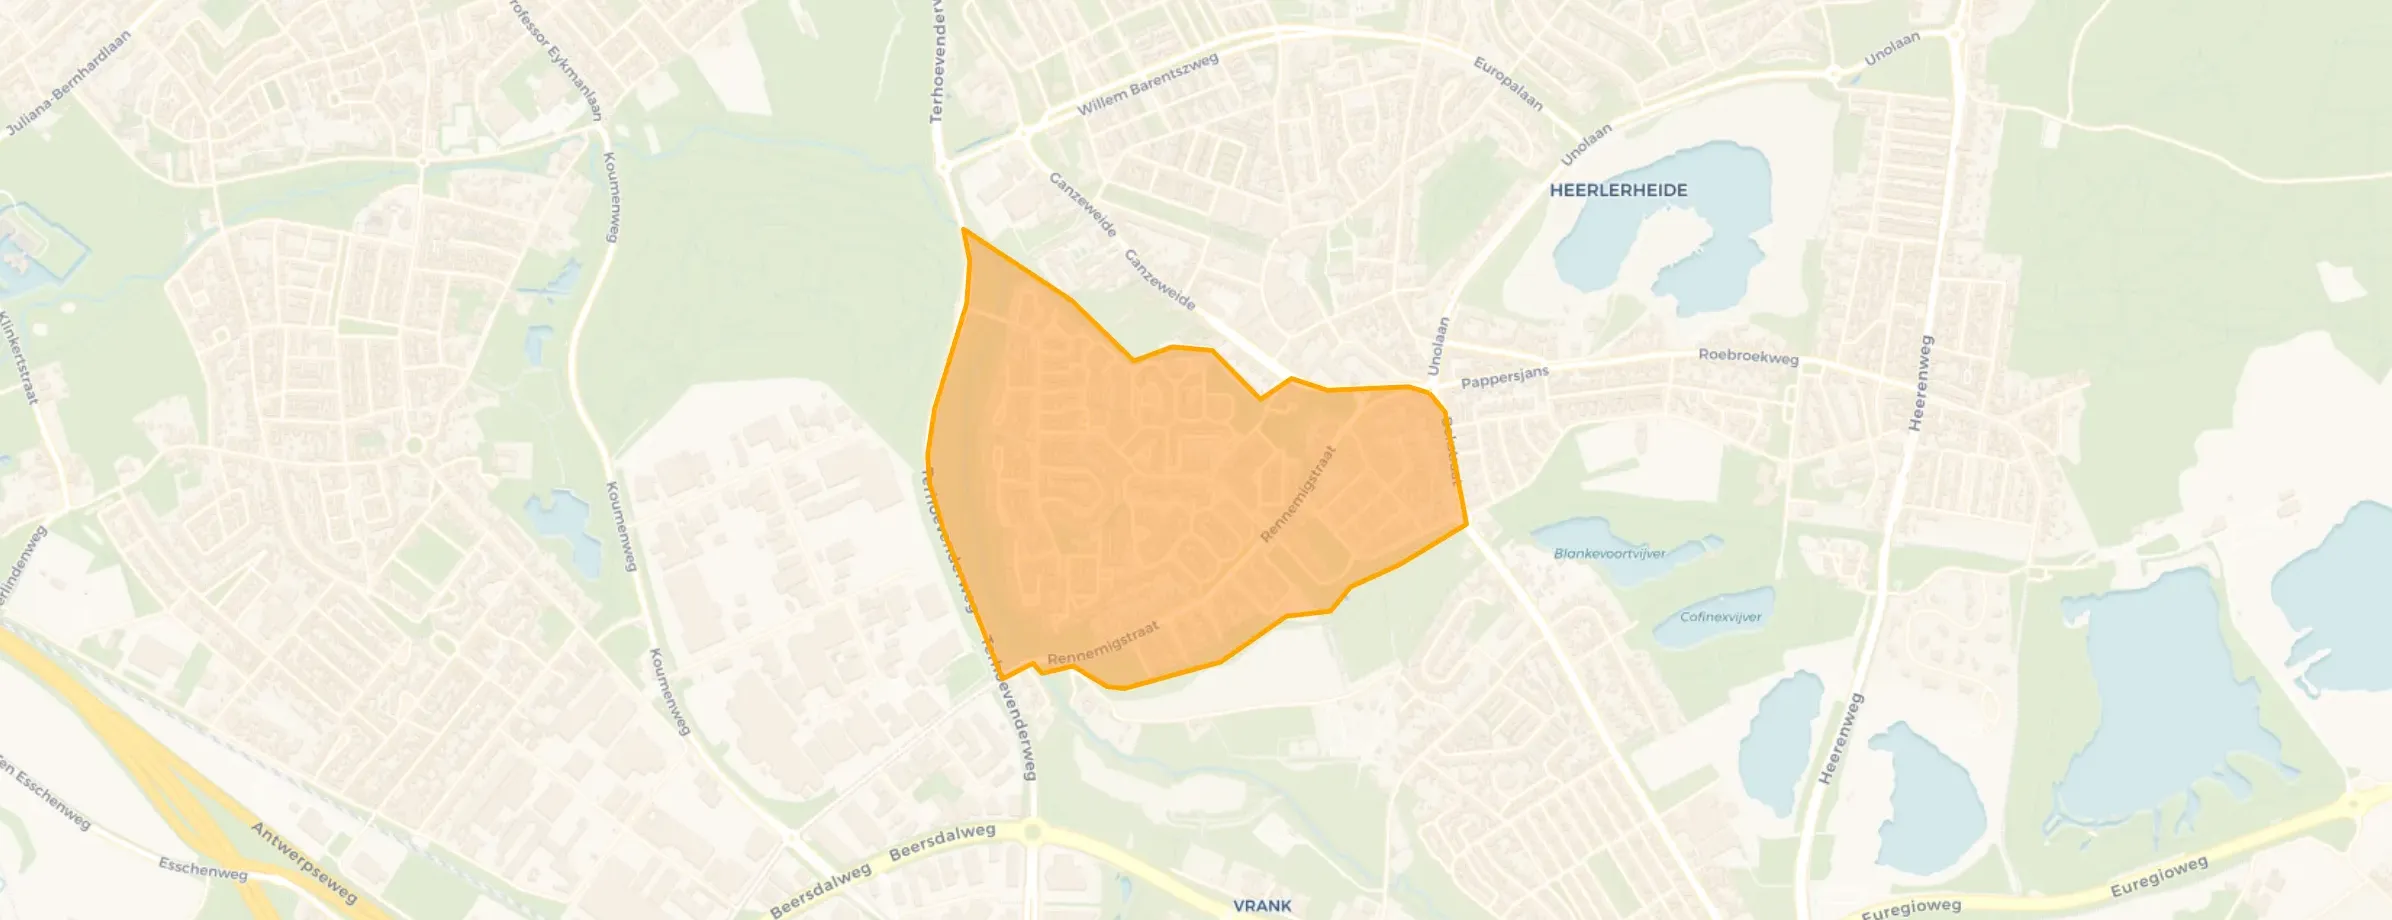
Rennemig is located in the province of Limburg, in the municipality of Heerlen, in the district Rennemig-Beersdal The neighbourhood has a total area of 63 hectares, of which 63 hectares are land and 0 hectares are water. The neighbourhood is coded as BU09172400. The postcode area is 6413AR-6413MR.
Two residents rate the neighbourhood as good with a score of 7.2. They describe it as 'Nice neighbourhood h' and 'Nice bond between residents, unfortunately a lot of criminal activity.'. Based on a limited number of reviews, no clear trends are visible yet in this neighbourhood.
Rennemig has 3.085 residents. Of these, 50,2% are men and 49,9% are women. Most residents are 45 to 65 years (31,0%). The other age groups are 26,9% for '25 to 45 years', 15,4% for '65 years or older', 14,7% for '0 to 15 years' and 12,2% for '15 to 25 years'. Of the residents, 51,9% is unmarried, 33,2% is married, 11,5% is divorced and 3,4% is widowed. 2.010 residents originate from the Netherlands, 535 come from Europe and 540 come from countries outside Europe.
There are 1.535 households in Rennemig. 42,0% of these are single-person households, 24,8% households without children and 33,2% households with children. The average household size is 2,0 persons. The national average is 2,1 persons.
In Rennemig there are 2.500 income recipients. The average income per income recipient is €30.300, which is €11.900 (28%) lower than the national average of €42.200. Per resident, the average income is €26.600, which is €8.300 (24%) lower than the national average of €34.900. Most residents of Rennemig are educated to an intermediate level. 46,6% have an intermediate education (HAVO, VWO or MBO 2-4), 41,3% have a lower education (VMBO or MBO 1) and 12,1% have a university or higher professional education (HBO/WO).
Of the 3.085 residents, around 62% are in paid employment, which amounts to 1.913 people. This is 10% lower than the national average of 72%. The majority of workers are in salaried employment (89%), while 11% are self-employed. In Rennemig, 31% of residents receive a benefit. The largest group is those receiving a state pension (AOW). 390 people receive this benefit.
In Rennemig there are 1.533 homes with an average assessed value (WOZ) of €184.000. Of these, around 97% are occupied and 3% unoccupied. In Rennemig there are roughly as many rental as owner-occupied homes. This amounts to 52% rental homes and 48% owner-occupied homes. Of the homes, 48% privately owned, 42% owned by housing associations and 11% owned by other landlords. The most common construction periods in Rennemig are 1980-1990 (70%) and 1950-1970 (10%).
There are currently 12 homes for sale in Rennemig. The most recently listed home is Fossielenerf 94 by Brandsma Vastgoed Woningmakelaardij B.V.. Over the past year, 37 homes were sold in Rennemig. On average, a home was sold within 51 days.
The average asking price for a home for sale in Rennemig over the past year was €270.703. This is 47% higher than the average assessed value (WOZ) of €184.000. The average asking price per m² of plot is €2.183.
There is 1 homes for rent in Rennemig. The most recent home is Belemnieterf 263, offered by www.thuisinlimburg.nl. Over the past year, 16 homes were let in Rennemig. On average, a listing was let within 35 days.
The average rent for a rental home in Rennemig over the past year was €2.950 per month. Per m² of plot area that is €11 per month.
In Rennemig there are 978 addresses with a registered energy label. The most common labels are C (38%), B (34%) and A (12%). On average, an address in Rennemig uses 2.550 kWh of electricity per year. This is in line with the national average. With an annual consumption of 760 m³ per address, natural gas consumption is 5% below the national average of 800 m³.
Very pleasant street, do a lot together. Street party, carnival, New Year's Eve.
Auto-translated to English by AII have lived on the Rennemig in Heerlen-Noord since I was 3. Unfortunately, I quickly noticed that education in this neighbourhood is not exactly the best, because I attended school there myself. Teachers who mistreat children, hurt them or don't take their feelings seriously. For example, if a child was bullied, it was often not taken seriously. A teacher dragged me by my wrist to apologise for something I hadn't done and that happened outside school hours. Besides that, there is a lot of theft in the village, especially at Jumbo, Plus and Kruidvat. Certain items have alarms on them, while in Landgraaf, for example, they don't. Also, there is often a lot of rubbish on the street, especially on the street where I live, things are sometimes thrown off the flats. At the playgrounds in the area, there is often animal excrement or glass. Vandalism is also a big issue, with bins being set on fire on holidays. The people, on the other hand, are very friendly and helpful if you respect them. There are also many places where you can get help.
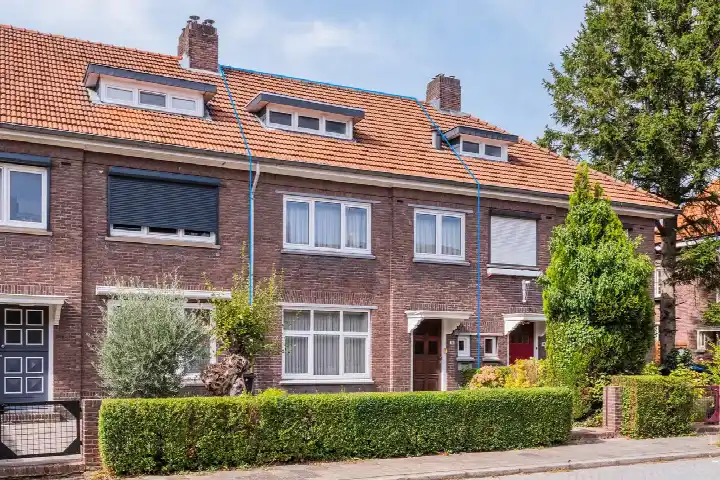
Auto-translated to English by AIThe housing stock is mainly post-war — 83% was built between 1945 and 1990. In addition, the most common type is terraced houses (55%).
Over the past year a home for sale in Rennemig was listed for an average of €270,703 (€2,398 per m²). That is 49% below the Dutch national average.
Buurt Rennemig has 3,085 residents. The largest age group is 45 to 65 years (31%).
From Rennemig you can on average reach a supermarket at 0.7 km, a GP at 0.6 km, a railway station at 2.5 km, a primary school at 0.4 km (as the crow flies, source: CBS).
Right now you will find 14 homes for sale and 2 homes for rent in Rennemig.