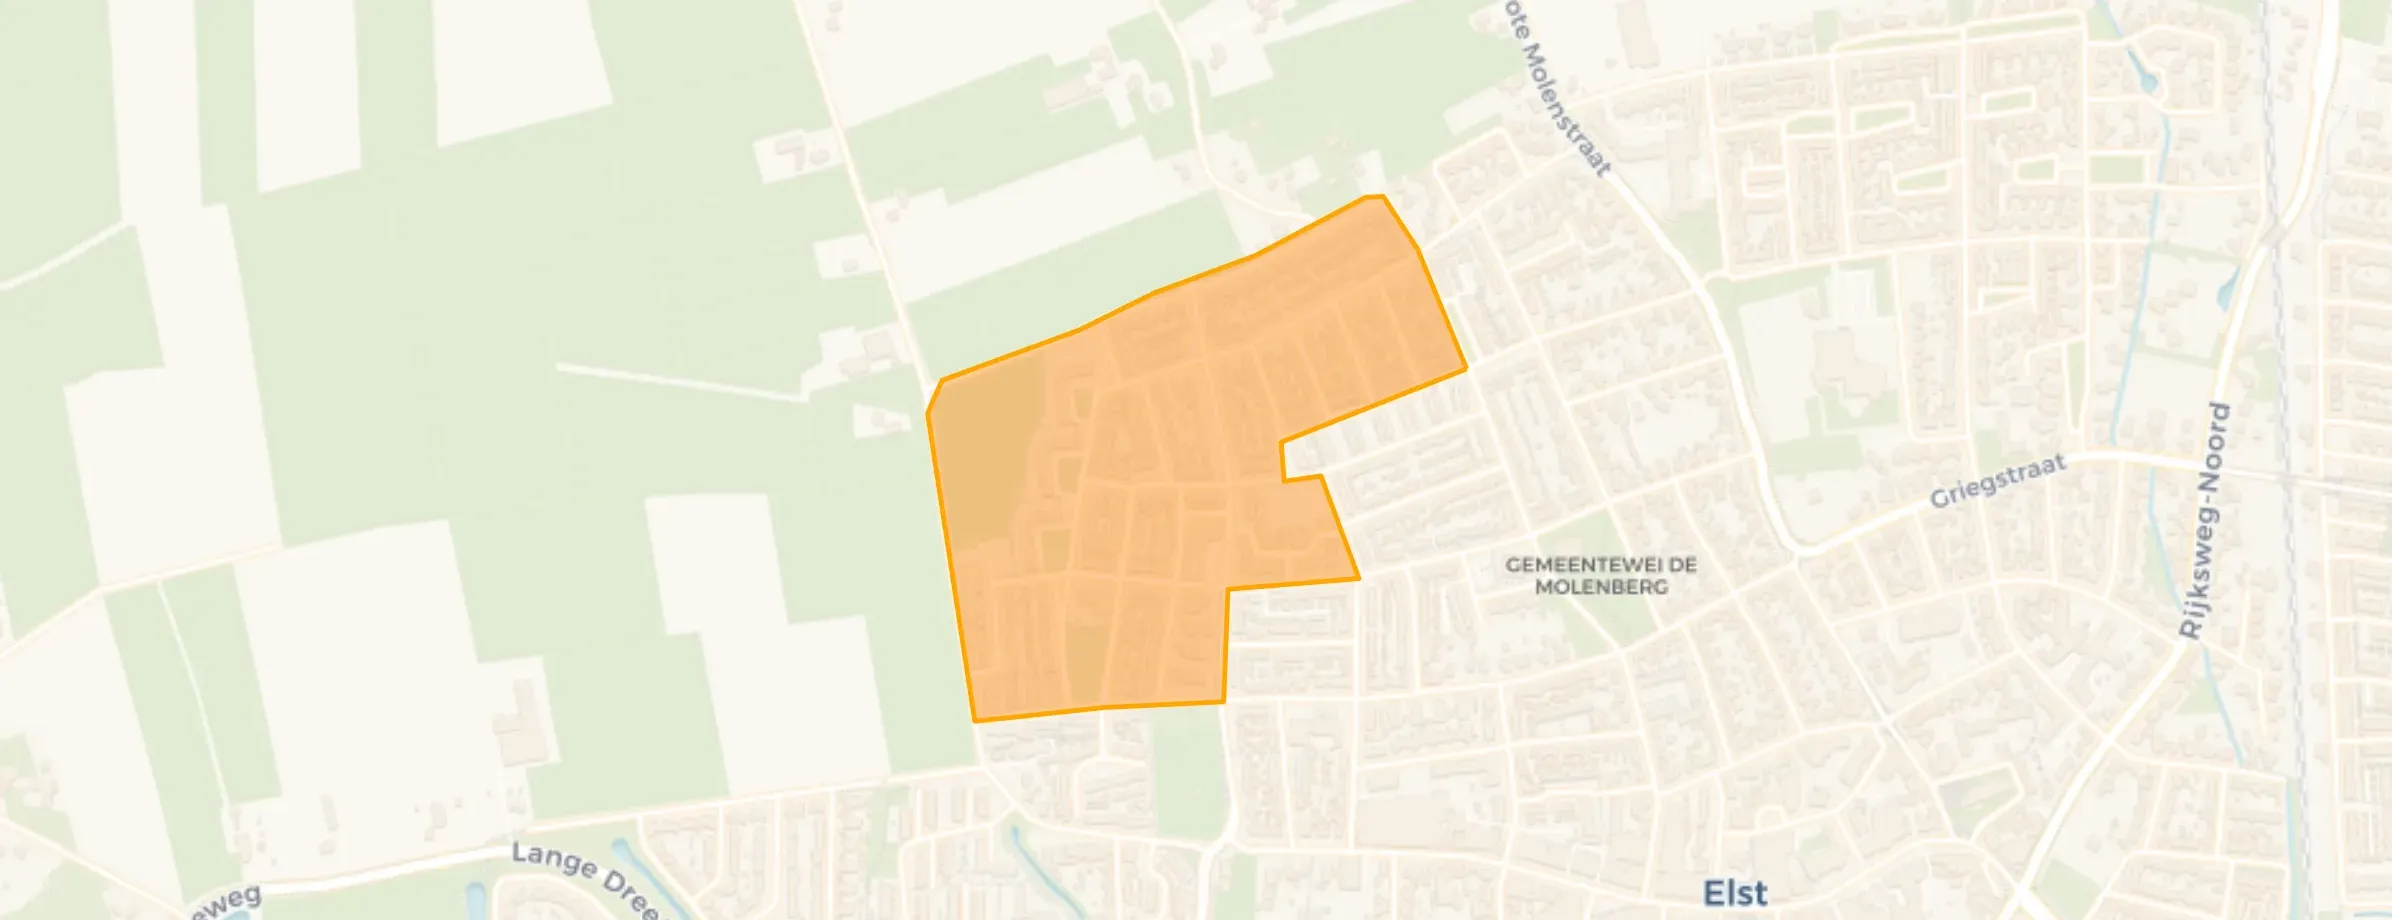
Neighbourhood in Overbetuwe
Hollanderbroek is located in the province of Gelderland, in the municipality of Overbetuwe, in the district Elst-Noord The neighbourhood has a total area of 22 hectares, of which 22 hectares are land and 0 hectares are water. The neighbourhood is coded as BU17340305. The postcode area is 6661GA-6661ZK.
Four residents rate the neighbourhood as more than satisfactory with a score of 6.5. They describe it as 'Everything in the neighbourhood', 'A neighbourhood where you don't know anyone' and 'impoverished'. Aspects such as amenities, education, safety are rated well in this neighbourhood, while housing and cleanliness score less well.
Hollanderbroek has 1.200 residents. Of these, 47,5% are men and 52,5% are women. Most residents are 45 to 65 years (27,5%). The other age groups are 25,0% for '25 to 45 years', 22,5% for '65 years or older', 14,2% for '0 to 15 years' and 11,3% for '15 to 25 years'. Of the residents, 50,0% is unmarried, 33,8% is married, 10,4% is divorced and 5,4% is widowed. 910 residents originate from the Netherlands, 45 come from Europe and 240 come from countries outside Europe.
There are 595 households in Hollanderbroek. 41,2% of these are single-person households, 26,9% households without children and 31,9% households with children. The average household size is 2,0 persons. The national average is 2,1 persons.
In Hollanderbroek there are 1.000 income recipients. The average income per income recipient is €30.300, which is €11.900 (28%) lower than the national average of €42.200. Per resident, the average income is €25.500, which is €9.400 (27%) lower than the national average of €34.900. Most residents of Hollanderbroek are educated to an intermediate level. 50,6% have an intermediate education (HAVO, VWO or MBO 2-4), 33,7% have a lower education (VMBO or MBO 1) and 15,7% have a university or higher professional education (HBO/WO).
Of the 1.200 residents, around 66% are in paid employment, which amounts to 792 people. This is 6% lower than the national average of 72%. The majority of workers are in salaried employment (89%), while 11% are self-employed. In Hollanderbroek, 33% of residents receive a benefit. The largest group is those receiving a state pension (AOW). 240 people receive this benefit.
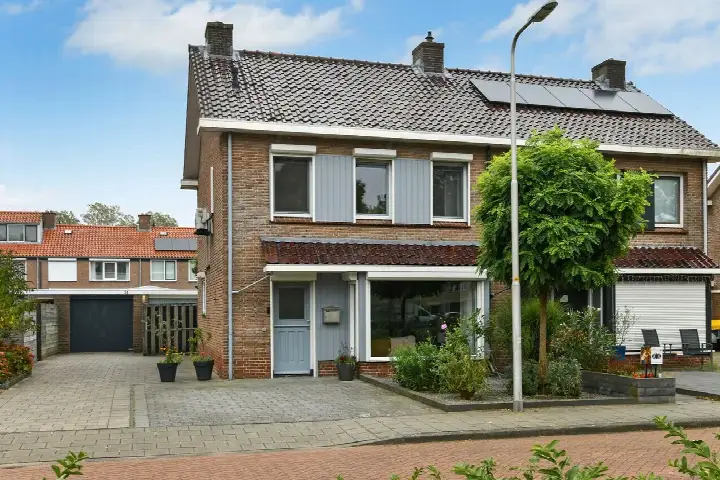
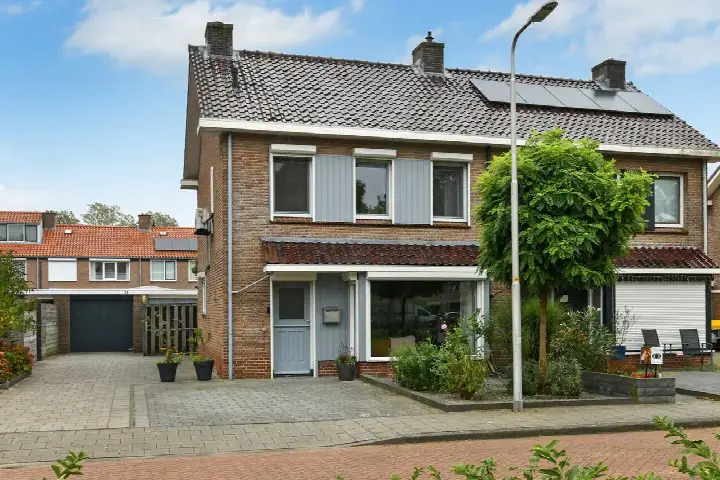
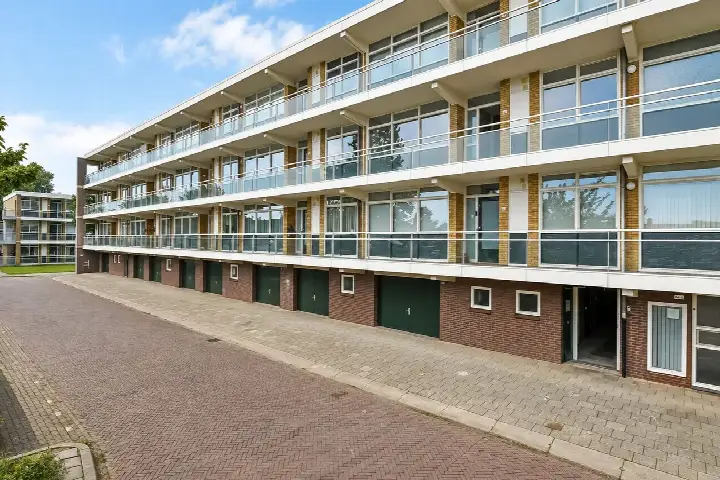
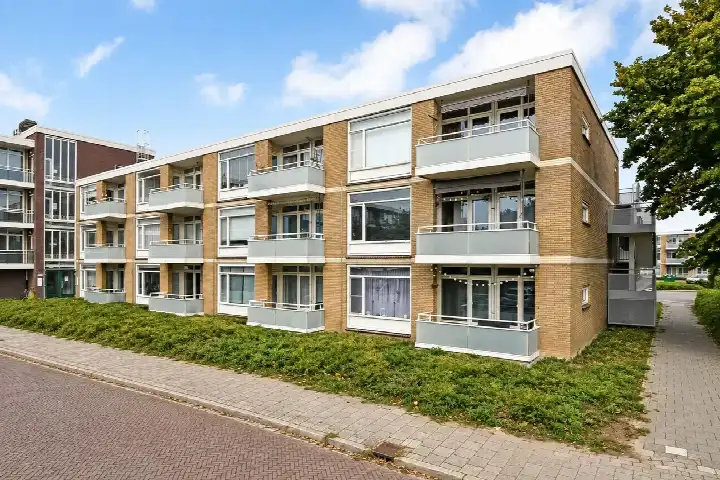
In Hollanderbroek there are 595 homes with an average assessed value (WOZ) of €280.000. Of these, around 99% are occupied and 1% unoccupied. Most homes are rental properties. This amounts to 67% rental homes and 33% owner-occupied homes. Of the homes, 33% privately owned, 50% owned by housing associations and 17% owned by other landlords. The most common construction periods in Hollanderbroek are 1950-1970 (80%) and 1970-1980 (15%).
There are currently 9 homes for sale in Hollanderbroek. The most recently listed home is Van Hallstraat 20 by Witjes Makelaars op Funda. Over the past year, 26 homes were sold in Hollanderbroek. On average, a home was sold within 36 days.
The average asking price for a home for sale in Hollanderbroek over the past year was €418.385. This is 49% higher than the average assessed value (WOZ) of €280.000. The average asking price per m² of plot is €4.809.
There are currently no homes for rent in Hollanderbroek. No homes were let in Hollanderbroek over the past year.
No recent rental data available for Hollanderbroek.
In Hollanderbroek there are 365 addresses with a registered energy label. The most common labels are C (42%), B (20%) and A (12%). On average, an address in Hollanderbroek uses 2.120 kWh of electricity per year. This is 17% below the national average of 2.550 kWh. Natural gas consumption, at 830 m³ per year, is 4% above the national average of 800 m³.
For us, it's less than a 10-minute walk to the village, we have the Albert Heijn less than 5 minutes away. Around the corner we have a baker and a GP, and for the children the playground is between the houses. Ideal. The gym is also just around the corner. And the bus connection is fine. You're in Arnhem or Nijmegen within half an hour.
Auto-translated to English by AIWhen I walk through the neighbourhood, I don't really know anyone. Because there are no street parties or places where we all come together, which I think is a shame.
Auto-translated to English by AIThe neighbourhood has been going downhill more and more. Stone front gardens with cameras, piles of household waste around PMD containers. Dogs are walked on the street and do their business before they even reach the dog field. Playgrounds are also full of dirt, poo and graffiti. Firework nuisance well before New Year's Eve. Fatbike youth hang around the playgrounds where you also keep finding broken glass and little balloons. (laughing gas?)
Auto-translated to English by AIDeprived neighbourhood Many single parents. Lots of social contacts and control. Poor paving, pavements and green spaces. Frequent drug nuisance in the area. Old neighbourhood that is increasingly deteriorating. Making it feel unsafe in the evenings.
Auto-translated to English by AIThe housing stock is mainly post-war — 100% was built between 1945 and 1990. In addition, the most common type is terraced houses (48%).
Over the past year a home for sale in Hollanderbroek was listed for an average of €415,000 (€4,652 per m²). That is 21% below the Dutch national average.
Residents give Hollanderbroek a 6.5 out of 10 based on 4 reviews. The strongest score is for amenities (7.5), the weakest for housing (5.8).
From Hollanderbroek you can on average reach a supermarket at 0.7 km, a GP at 0.4 km, a railway station at 1.9 km, a primary school at 1.1 km (as the crow flies, source: CBS).