Neighbourhood in Huizen
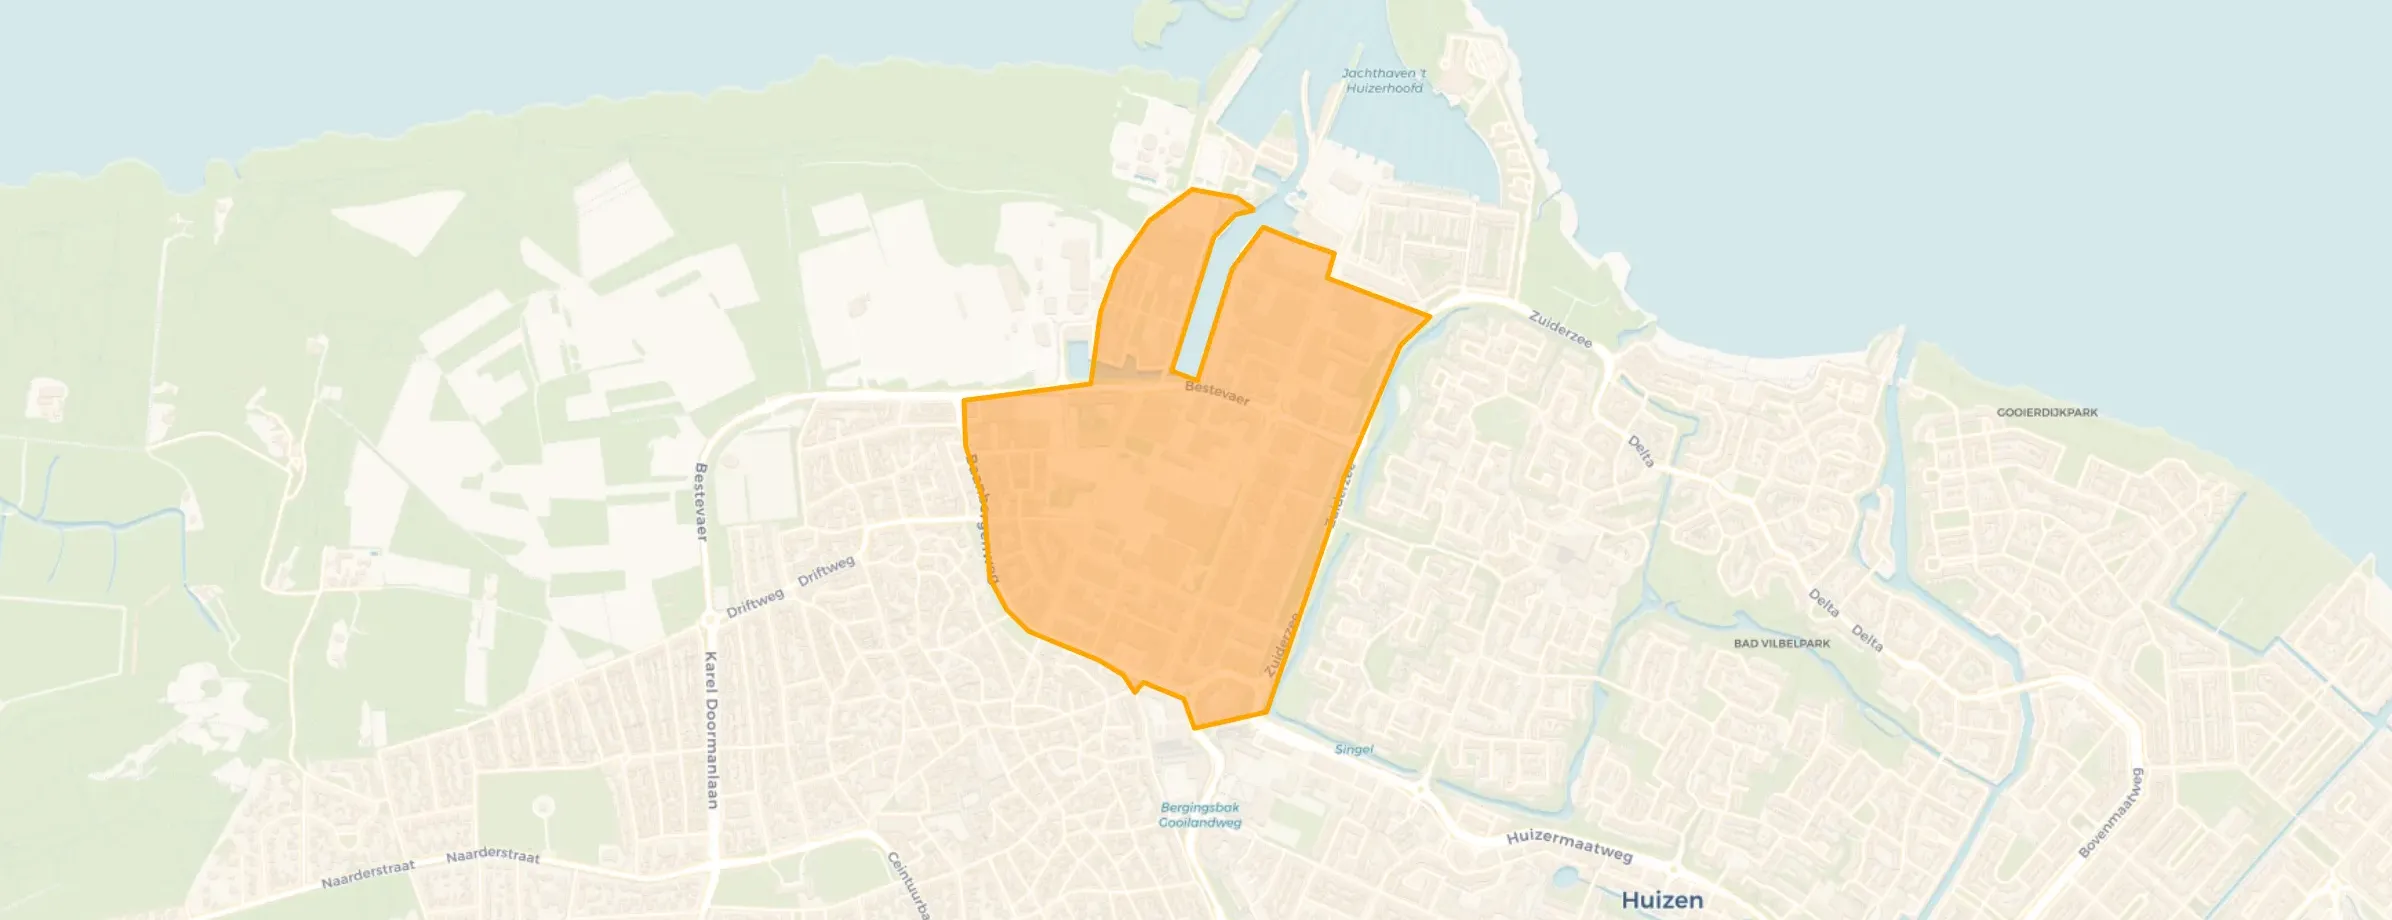
Industriewijk ’t Plaveen is located in the province of Noord-Holland, in the municipality of Huizen, in the district Havengebied The neighbourhood has a total area of 63 hectares, of which 62 hectares are land and 0 hectares are water. The neighbourhood is coded as BU04060513. The postcode area is 1271AC-1276KA.
Two residents rate the neighbourhood as more than satisfactory with a score of 6.4. They describe it as 'The people are nice' and 'Unhygienic'. Based on a limited number of reviews, no clear trends are visible yet in this neighbourhood.
Industriewijk ’t Plaveen has 860 residents. Of these, 47,7% are men and 52,3% are women. Most residents are 25 to 45 years (24,4%). The other age groups are 22,7% for '45 to 65 years', 22,1% for '0 to 15 years', 20,9% for '65 years or older' and 9,9% for '15 to 25 years'. Of the residents, 45,3% is unmarried, 43,6% is married, 5,8% is divorced and 4,7% is widowed. 595 residents originate from the Netherlands, 50 come from Europe and 215 come from countries outside Europe.
There are 340 households in Industriewijk ’t Plaveen. 26,5% of these are single-person households, 30,9% households without children and 42,6% households with children. The average household size is 2,5 persons. The national average is 2,1 persons.
In Industriewijk ’t Plaveen there are 700 income recipients. The average income per income recipient is €45.300, which is €3.100 (7%) higher than the national average of €42.200. Per resident, the average income is €35.600, which is €700 (2%) higher than the national average of €34.900. Most residents of Industriewijk ’t Plaveen are educated to an intermediate level. 44,8% have an intermediate education (HAVO, VWO or MBO 2-4), 37,9% have a university or higher professional education (HBO/WO) and 17,2% have a lower education (VMBO or MBO 1).
Of the 860 residents, around 72% are in paid employment, which amounts to 619 people. This is 0% lower than the national average of 72%. The majority of workers are in salaried employment (80%), while 20% are self-employed. In Industriewijk ’t Plaveen, 27% of residents receive a benefit. The largest group is those receiving a state pension (AOW). 170 people receive this benefit.
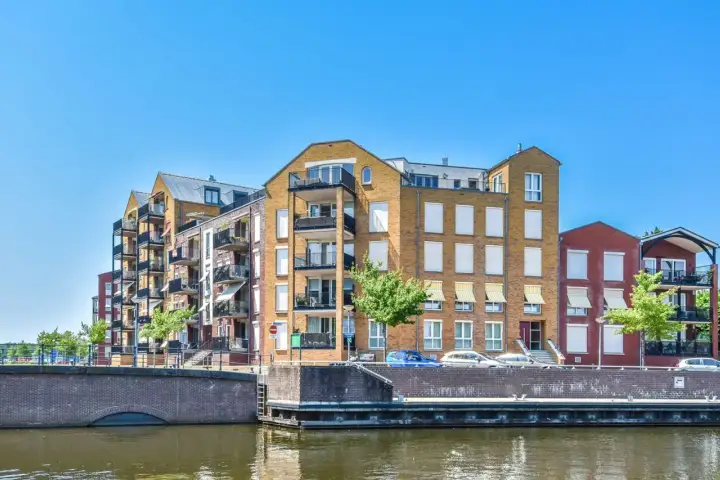
In Industriewijk ’t Plaveen there are 346 homes with an average assessed value (WOZ) of €510.000. Of these, around 97% are occupied and 3% unoccupied. Most homes are owner-occupied. This amounts to 33% rental homes and 67% owner-occupied homes. Of the homes, 67% privately owned, 29% owned by housing associations and 4% owned by other landlords. The most common construction periods in Industriewijk ’t Plaveen are 2000-2010 (32%) and 2020 and later (21%).
There are currently 14 homes for sale in Industriewijk ’t Plaveen. The most recently listed home is IJsbaankade 193 by KAPPELLE MAKELAARS LAREN. Over the past year, 45 homes were sold in Industriewijk ’t Plaveen. On average, a home was sold within 55 days.
The average asking price for a home for sale in Industriewijk ’t Plaveen over the past year was €677.867. This is 33% higher than the average assessed value (WOZ) of €510.000. The average asking price per m² of plot is €4.984.
There is 1 homes for rent in Industriewijk ’t Plaveen. The most recent home is IJsbaankade 33, offered by ViaDaan. Over the past year, 3 homes were let in Industriewijk ’t Plaveen. On average, a listing was let within 10 days.
The average rent for a rental home in Industriewijk ’t Plaveen over the past year was €2.320 per month. Per m² of plot area that is €30 per month.
In Industriewijk ’t Plaveen there are 414 addresses with a registered energy label. The most common labels are A (40%), A+++ (30%) and B (8%). On average, an address in Industriewijk ’t Plaveen uses 2.760 kWh of electricity per year. This is 8% above the national average of 2.550 kWh. With an annual consumption of 510 m³ per address, natural gas consumption is 36% below the national average of 800 m³.
Cozy atmosphere
Auto-translated to English by AIThe neighbourhood is often dirty. There's a lot of rubbish and the drains are regularly blocked. People drive extremely fast through the neighbourhood. I don't dare let my children play freely. Many work vans and trucks drive through our street to make the route to Havenstraat easier. Because the industrial estate borders our residential area, there is almost never any parking space for us residents. The garage that is there parks its cars in our neighbourhood because it can no longer accommodate them itself. There is also a gym where all members park in the neighbourhood. As a result, we often have to walk far to get to our homes. The neighbourhood is not child-friendly due to the heavy traffic and there is little to do. There is a playground but they cannot go there safely. It would be ideal if there were one-way traffic. And more rubbish bins.
Auto-translated to English by AIThe housing stock is relatively young — 100% dates from after 1990. In addition, the most common type is terraced houses (41%).
Over the past year a home for sale in Industriewijk ’t Plaveen was listed for an average of €697,659 (€5,757 per m²). That is 32% above the Dutch national average.
Buurt Industriewijk ’t Plaveen has 860 residents. Many families: 43% of the households have children.
The housing supply in Industriewijk ’t Plaveen is remarkably efficient: 100% has an A, A+ or B label. The average natural gas consumption per household is 510 m³ per year.
From Industriewijk ’t Plaveen you can on average reach a supermarket at 0.5 km, a GP at 1.0 km, a railway station at 7.1 km, a primary school at 1.6 km (as the crow flies, source: CBS).
Right now you will find 16 homes for sale and 1 homes for rent in Industriewijk ’t Plaveen.